Good Life Advisors – Talking Points – Week 33
Delta and Afghanistan
The week started off with another all-time high for the S&P (4480) but the spread of the Delta variant is starting to dampen reopening momentum. High frequency data checks on restaurants, air travel and leisure spending points to a growth moderation. A growth slow down coming right as the unemployment benefit cliff approaches could be problematic. Goldman Sachs this week said the impact from Delta on growth, may be more than the firm expected and lowered its forecast for Q3 GDP growth to 5.5% from 9%, which now implies 2021 growth of 6%, down from 6.4% previously and below the 6.2% consensus
You can see from the graph below the number of new cases is rising quickly. 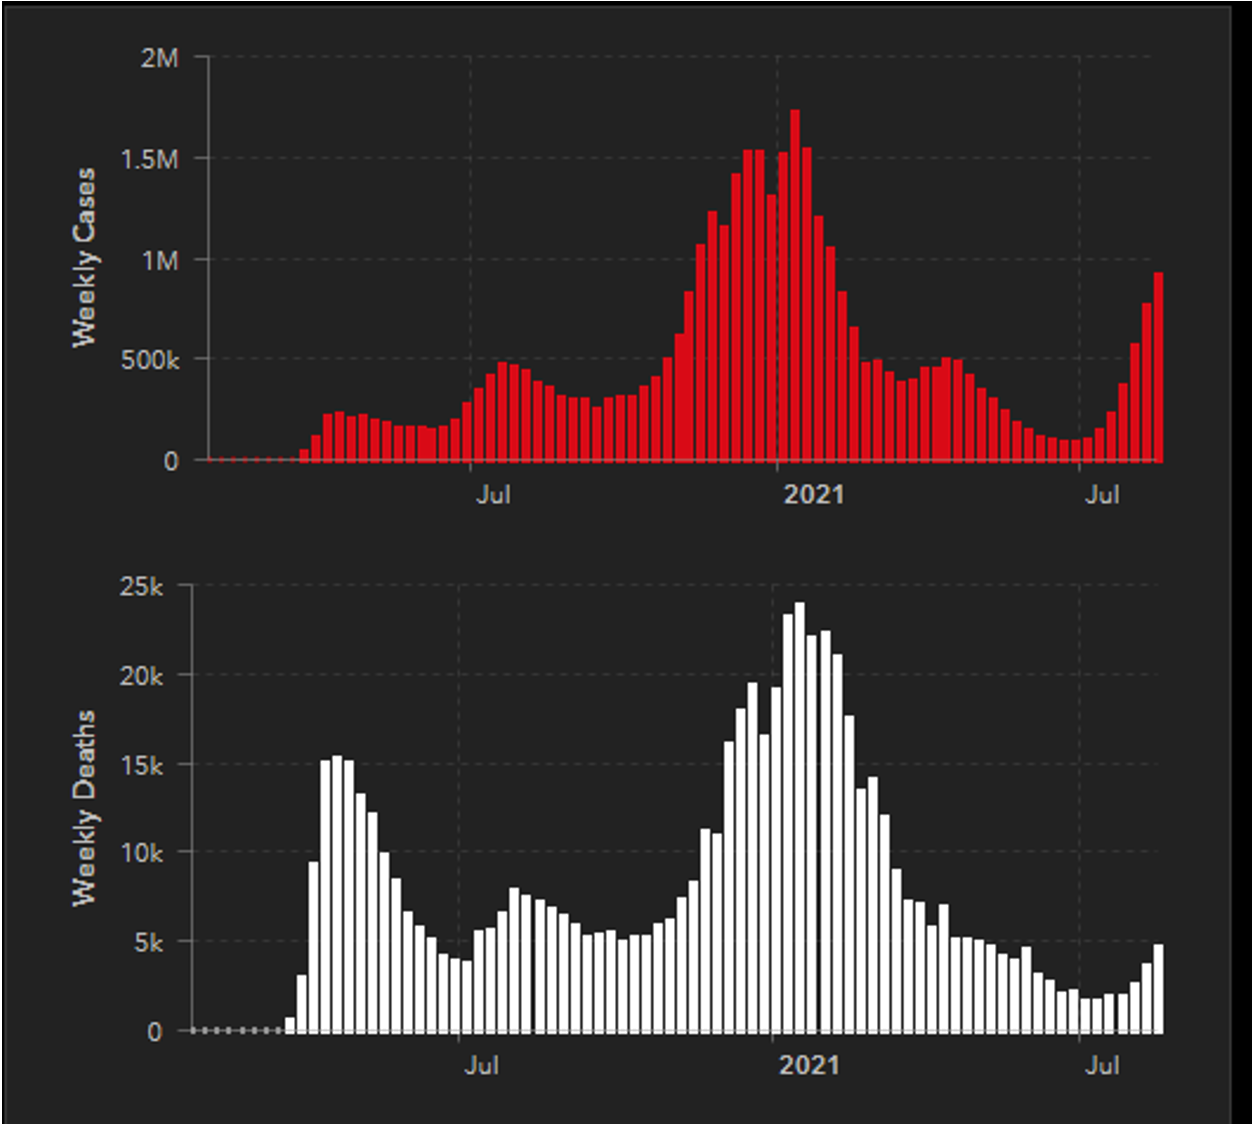 https://coronavirus.jhu.edu/map.html
Geopolitical tensions dominated the headlines and the political fallout for the Biden administration from the Afghan debacle was flagged as another complication for additional fiscal stimulus. Many people have been left wondering how there could be such a massive order of operations error for an Afghan withdrawal. Although markets don’t normally move too much on geo-political situations in war torn countries, the pictures from the ground may hurt overall market sentiment.
Equities finished mostly lower this week with energy the biggest loser, as oil suffered its longest losing streak since autumn of 2019. Value underperformed vs growth, while small and mid-caps took a beating both down over 2%. Treasuries were mostly firmer with some curve flattening. 10-year yields were down 4 bp at 1.26%. The dollar index jumped ~1%. Gold gained 0.3%. WTI crude fell nearly 9%.

Greater China shares came under pressure again this week with Hong Kong’s Hang Seng Index down nearly 6% and entering bear market territory. A broadening regulatory crackdown remained the big driver of the selloff. This week brought the publication of draft rules for internet sector regulation, the formal approval of a strict new data privacy law, online pharmacies, liquor makers and cosmetics firms in the regulatory crosshairs, and President Xi’s call for stronger regulation of high incomes.
It’s worth pointing out lumbers meteoric rise then subsequent fall back down. At its May high the price of lumber was up over 120%- On Friday it closed down 33% for the year.
Fixed Income
July FOMC Statement FOMC Minutes Credit, Liquidity and Balance Sheet Federal Reserve Dot Plots
US Corporate Debt Tops 7 Trillion. Treasury.gov yields FOMC Policy Normalization Statement Longer Run Goals August 2020
Global Bond Yields
Daily US Treasury Yields
Foreign Exchange Market
Energy Complex
The Baker Hughes rig count increased by 3 this week. There are 503 oil and gas rigs operating in the US – Up 249 over last year.
Metals Complex
Employment Picture
Weekly Unemployment Claims – Released Thursday 8/19/2021 – Initial jobless claims for the week ending August 14th decreased 29k to 348k. The 4-week moving average was 378k, a decrease of 19k.
Job Openings & Labor Turnover Survey JOLTS – Released 8/9/2021 – The U.S. Bureau of Labor Statistics reported the number and rate of job openings increased to 10.2 million on the last business day of June. Over the month, hires increased to 6.7 million and separations increased to 5.6 million. Within separations, the quits rate increased to 2.7%. The layoffs and discharges rates were unchanged at 0.9%.
July Jobs Report – BLS Summary Released 8/6/2021 – The US Economy added 943k nonfarm jobs in July and the Unemployment rate declined 0.5% to 5.4. Average hourly earnings increased by 11 cents to $30.54. Hiring highlights include+380k Leisure and Hospitality, +60k Professional and Business Services, +87 Education and Health Services, and +240k Government.
- Average hourly earnings increased by 11 cents to $30.54.
- U3 unemployment rate declined 0.5% to 5.4%. U6 unemployment rate declined to 9.2%.
- The labor force participation rate was little changed at 61.7%.
- Average work week was unchanged at 34.8 hours.
Employment Cost Index – Released 7/30/2021 – Compensation costs for civilian workers increased 0.7% for the 3-month period ending in June 2021. The 12-month period ending in June 2021 saw compensation costs increase by 2.9%. The 12-month period ending June 2020 increased 2.7%. Wages and salaries increased 3.2 percent over the year and increased 2.9 percent for the 12-month period ending in June 2020. Benefit costs increased 2.2 percent over the year and increased 2.2 percent for the 12-month period ending in June 2020. This report is published quarterly.
This Week’s Economic Data
Links take you to the data source
Housing Starts – Released 8/18/2021 – New home starts in July were at a seasonally adjusted annual rate of 1.534 million; down 7.0% below June, but 2.5% above last July’s rate. Building Permits were at a seasonally adjusted annual rate of 1.635 million, up 2.6% compared to June, and up 6.0% over last year.
Retail Sales – Released 8/17/2021 – U.S. retail sales for July decreased 1.1% to $617.7 billion but retail sales are 15.8% above July 2020. U.S. retail sales are up 20.6% year/y.
Industrial Production and Capacity Utilization – Released 8/17/2021 – In July Industrial production increased 0.9%. Manufacturing increased 1.4%. Mining increased 1.2%. Utilities output declined 2.1%. Motor Vehicles and Parts increased 11.2% contributing nearly half the gain seen in factory output last month. Total industrial production was 6.6% higher in July than a year ago, but still 0.2% below its pre-pandemic level. Total capacity utilization increased 0.7% to 76.1% in July which is 3.5% below its long run average.
Recent Economic Data
Links take you to the data source
Producer Price Index – Released 8/12/2021 – The Producer Price Index for final demand increased 1.0% in July. PPI less food and energy increased 1.0% in July.
Consumer Price Index – Released 8/11/2021 – Consumer prices rose 0.5% m/m in July following a 0.9% gain in June. Core consumer prices increased 0.3% m/m in June following a 0.9% gain in June.
Consumer Credit – Released 8/6/2021 – Consumer credit increased at a seasonally adjusted annual rate of 8.8 percent in the second quarter of 2021. Revolving credit increased at an annual rate of 10.7 percent, while nonrevolving credit increased at an annual rate of 8.3 percent. In June, revolving credit increased at an annual rate of 22.0 percent, while nonrevolving credit increased at an annual rate of 7.2 percent.
US Light Vehicle Sales – Released 8/6/2021 – U.S. light vehicle sales were at a seasonally adjusted annual rate (SAAR) of 14.750 million units in July.
U.S. Trade Balance – Released 8/5/2021 – According to the U.S. Census Bureau of Economic Analysis the goods and services deficit increased in June by $4.8 billion to $75.7 billion. June exports were $207.7 billion, $1.2 billion more than May exports. June imports were $283.4 billion, $6.0 billion more than May imports. Year to date the goods and services deficit increased $135.8 billion or 46.4%, from the same period in 2020. Year to date exports and imports increased $150.9 billion or 14.3% and increased $286.7 billion or 21.3% respectively.
PMI Non-Manufacturing Index – Released 8/4/2021 – Economic activity in the non-manufacturing sector grew in July for the 14th consecutive month. ISM Non-Manufacturing registered 64.1 percent, which is 4.0 percentage points above the adjusted June reading of 60.1 percent.
PMI Manufacturing Index – Released 8/2/2021 – July PMI declined 1.1% to 59.5% down from June’s reading of 60.6%. The New Orders Index was down 1.1% from June’s reading of 66.0% to 64.9%. The Production Index registered 58.4%, down 2.4%.
U.S. Construction Spending – Released 8/2/2021 – Construction spending increased 0.1% in June measuring at a seasonally adjusted annual rate of $1,552.2 billion. The June figure is 8.2% above the June 2020 estimate. Private construction spending was 0.4% above the revised May estimate at $1,215.2 billion. Public construction spending was 1.2% below the revised May estimate at $337.0 billion.
Chicago PMI – Released 7/30/2021 – Chicago PMI increased to a two-month high at 73.4 points in July. Among the main five indicators, Production saw the largest increase, followed by New Orders, while Supplier Deliveries remained unchanged.
Personal Income – Released 7/30/2021 – Personal income increased $26.1 billion or 0.1 percent in June according to estimates released today by the Bureau of Economic Analysis. Disposable personal income (DPI) decreased $2.6 billion or 0.1 percent and personal consumption expenditures (PCE) increased $155.4 billion or 1.0 percent.
Advance Estimate of 2nd Quarter 2021 GDP – Released 7/29/2021 – Real gross domestic product (GDP) increased at an annual rate of 6.5 percent in the second quarter of 2021, according to the advance estimate released by the Bureau of Economic Analysis. The first quarter observed a 6.3 percent increase in real GDP. The GDP estimate released today is based on data that are incomplete or subject to additional revision. The increase in real GDP in the second quarter reflected increases in personal consumption expenditures (PCE), nonresidential fixed investment, exports, and state and local government spending that were partly offset by decreases in private inventory investment, residential fixed investment, and federal government spending. Imports, which are a subtraction in the calculation of GDP, increased.
Consumer Confidence – Released 7/27/2021 – The Consumer confidence index was relatively unchanged in June following five consecutive months of increases. The Index now shows its highest reading in a year of 129.1, up from 128.9 in June.
Durable Goods – Released 7/27/2021 – New orders for manufactured durable goods in June increased $2.1 billion or 0.8% to $257.6 billion. Transportation equipment led the increase rising $1.6 billion or 2.1% to $77.5 billion.
New Residential Sales – Released 7/26/2021 – Sales of new single-family homes decreased 6.6% to 724k, seasonally adjusted, in June. The median sales price of new homes sold in June was $361,800 with an average sales price of $428,700. At the end of June, the seasonally adjusted estimate of new homes for sale was 353k. This represents a supply of 6.3 months at the current sales rate.
Existing Home Sales – Released 7/22/2021 – Existing home sales increased in June ending four consecutive months of declines. Sales increased 1.4% to a seasonally adjusted rate of 5.86 million in June. Sales are currently up 22.9% from one year ago. Housing inventory sits at 1.25 million units. Up 3.3% from May’s inventory. Down 18.8% over last year. Unsold inventory sits at a 2.6-month supply. The median existing home price for all housing types was $363,300.
Next week we get data on Existing Home Sales, New Residential Sales, Durable Goods, Personal Income, and the Second Estimate of 2nd Quarter GDP.
Data Sources:
Bureau of Economic Analysis (BEA)
Congressional Budget Office (CBO)
U.S. Bureau of Labor Statistics (BLS)
Federal Reserve Economic Data (FRED Charts)
CME Fed Watch
U.S. Treasury – Yields
U.S. Census Bureau
Institute for Supply Management (ISM)
Weekly DOL Employment Data
BLS Monthly Jobs Report
JOLTS
US Energy Admin (EIA)
BLS Consumer Price Index CPI
BLS Producer Price Index PPI
Atlanta Fed GDPNOW
NY Fed Nowcast GDP
US Census Bureau Housing Starts
Consumer Credit
USCB Retail Sales
Construction Spending
Federal Reserve Dot Plots
NY Empire Index
Philadelphia Federal Reserve
P/E Ratio Data -Yardeni Research
Technical Analysis Info:
StockCharts.com – Financial Charts
Exponential vs Simple moving average
Other Links:
1973 Arab Oil Embargo
Hunt Brothers Silver
Long-Term Capital bailout


Week 33 Talking Points
Good Life Advisors – Talking Points – Week 33
Delta and Afghanistan
The week started off with another all-time high for the S&P (4480) but the spread of the Delta variant is starting to dampen reopening momentum. High frequency data checks on restaurants, air travel and leisure spending points to a growth moderation. A growth slow down coming right as the unemployment benefit cliff approaches could be problematic. Goldman Sachs this week said the impact from Delta on growth, may be more than the firm expected and lowered its forecast for Q3 GDP growth to 5.5% from 9%, which now implies 2021 growth of 6%, down from 6.4% previously and below the 6.2% consensus
You can see from the graph below the number of new cases is rising quickly. https://coronavirus.jhu.edu/map.html
Geopolitical tensions dominated the headlines and the political fallout for the Biden administration from the Afghan debacle was flagged as another complication for additional fiscal stimulus. Many people have been left wondering how there could be such a massive order of operations error for an Afghan withdrawal. Although markets don’t normally move too much on geo-political situations in war torn countries, the pictures from the ground may hurt overall market sentiment.
Equities finished mostly lower this week with energy the biggest loser, as oil suffered its longest losing streak since autumn of 2019. Value underperformed vs growth, while small and mid-caps took a beating both down over 2%. Treasuries were mostly firmer with some curve flattening. 10-year yields were down 4 bp at 1.26%. The dollar index jumped ~1%. Gold gained 0.3%. WTI crude fell nearly 9%.
Greater China shares came under pressure again this week with Hong Kong’s Hang Seng Index down nearly 6% and entering bear market territory. A broadening regulatory crackdown remained the big driver of the selloff. This week brought the publication of draft rules for internet sector regulation, the formal approval of a strict new data privacy law, online pharmacies, liquor makers and cosmetics firms in the regulatory crosshairs, and President Xi’s call for stronger regulation of high incomes.
It’s worth pointing out lumbers meteoric rise then subsequent fall back down. At its May high the price of lumber was up over 120%- On Friday it closed down 33% for the year.
Table of Contents
Fixed Income
July FOMC Statement FOMC Minutes Credit, Liquidity and Balance Sheet Federal Reserve Dot Plots
US Corporate Debt Tops 7 Trillion. Treasury.gov yields FOMC Policy Normalization Statement Longer Run Goals August 2020
Global Bond Yields
Daily US Treasury Yields
Foreign Exchange Market
Energy Complex
The Baker Hughes rig count increased by 3 this week. There are 503 oil and gas rigs operating in the US – Up 249 over last year.
Metals Complex
Employment Picture
Weekly Unemployment Claims – Released Thursday 8/19/2021 – Initial jobless claims for the week ending August 14th decreased 29k to 348k. The 4-week moving average was 378k, a decrease of 19k.
Job Openings & Labor Turnover Survey JOLTS – Released 8/9/2021 – The U.S. Bureau of Labor Statistics reported the number and rate of job openings increased to 10.2 million on the last business day of June. Over the month, hires increased to 6.7 million and separations increased to 5.6 million. Within separations, the quits rate increased to 2.7%. The layoffs and discharges rates were unchanged at 0.9%.
July Jobs Report – BLS Summary Released 8/6/2021 – The US Economy added 943k nonfarm jobs in July and the Unemployment rate declined 0.5% to 5.4. Average hourly earnings increased by 11 cents to $30.54. Hiring highlights include+380k Leisure and Hospitality, +60k Professional and Business Services, +87 Education and Health Services, and +240k Government.
Employment Cost Index – Released 7/30/2021 – Compensation costs for civilian workers increased 0.7% for the 3-month period ending in June 2021. The 12-month period ending in June 2021 saw compensation costs increase by 2.9%. The 12-month period ending June 2020 increased 2.7%. Wages and salaries increased 3.2 percent over the year and increased 2.9 percent for the 12-month period ending in June 2020. Benefit costs increased 2.2 percent over the year and increased 2.2 percent for the 12-month period ending in June 2020. This report is published quarterly.
This Week’s Economic Data
Links take you to the data source
Housing Starts – Released 8/18/2021 – New home starts in July were at a seasonally adjusted annual rate of 1.534 million; down 7.0% below June, but 2.5% above last July’s rate. Building Permits were at a seasonally adjusted annual rate of 1.635 million, up 2.6% compared to June, and up 6.0% over last year.
Retail Sales – Released 8/17/2021 – U.S. retail sales for July decreased 1.1% to $617.7 billion but retail sales are 15.8% above July 2020. U.S. retail sales are up 20.6% year/y.
Industrial Production and Capacity Utilization – Released 8/17/2021 – In July Industrial production increased 0.9%. Manufacturing increased 1.4%. Mining increased 1.2%. Utilities output declined 2.1%. Motor Vehicles and Parts increased 11.2% contributing nearly half the gain seen in factory output last month. Total industrial production was 6.6% higher in July than a year ago, but still 0.2% below its pre-pandemic level. Total capacity utilization increased 0.7% to 76.1% in July which is 3.5% below its long run average.
Recent Economic Data
Links take you to the data source
Producer Price Index – Released 8/12/2021 – The Producer Price Index for final demand increased 1.0% in July. PPI less food and energy increased 1.0% in July.
Consumer Price Index – Released 8/11/2021 – Consumer prices rose 0.5% m/m in July following a 0.9% gain in June. Core consumer prices increased 0.3% m/m in June following a 0.9% gain in June.
Consumer Credit – Released 8/6/2021 – Consumer credit increased at a seasonally adjusted annual rate of 8.8 percent in the second quarter of 2021. Revolving credit increased at an annual rate of 10.7 percent, while nonrevolving credit increased at an annual rate of 8.3 percent. In June, revolving credit increased at an annual rate of 22.0 percent, while nonrevolving credit increased at an annual rate of 7.2 percent.
US Light Vehicle Sales – Released 8/6/2021 – U.S. light vehicle sales were at a seasonally adjusted annual rate (SAAR) of 14.750 million units in July.
U.S. Trade Balance – Released 8/5/2021 – According to the U.S. Census Bureau of Economic Analysis the goods and services deficit increased in June by $4.8 billion to $75.7 billion. June exports were $207.7 billion, $1.2 billion more than May exports. June imports were $283.4 billion, $6.0 billion more than May imports. Year to date the goods and services deficit increased $135.8 billion or 46.4%, from the same period in 2020. Year to date exports and imports increased $150.9 billion or 14.3% and increased $286.7 billion or 21.3% respectively.
PMI Non-Manufacturing Index – Released 8/4/2021 – Economic activity in the non-manufacturing sector grew in July for the 14th consecutive month. ISM Non-Manufacturing registered 64.1 percent, which is 4.0 percentage points above the adjusted June reading of 60.1 percent.
PMI Manufacturing Index – Released 8/2/2021 – July PMI declined 1.1% to 59.5% down from June’s reading of 60.6%. The New Orders Index was down 1.1% from June’s reading of 66.0% to 64.9%. The Production Index registered 58.4%, down 2.4%.
U.S. Construction Spending – Released 8/2/2021 – Construction spending increased 0.1% in June measuring at a seasonally adjusted annual rate of $1,552.2 billion. The June figure is 8.2% above the June 2020 estimate. Private construction spending was 0.4% above the revised May estimate at $1,215.2 billion. Public construction spending was 1.2% below the revised May estimate at $337.0 billion.
Chicago PMI – Released 7/30/2021 – Chicago PMI increased to a two-month high at 73.4 points in July. Among the main five indicators, Production saw the largest increase, followed by New Orders, while Supplier Deliveries remained unchanged.
Personal Income – Released 7/30/2021 – Personal income increased $26.1 billion or 0.1 percent in June according to estimates released today by the Bureau of Economic Analysis. Disposable personal income (DPI) decreased $2.6 billion or 0.1 percent and personal consumption expenditures (PCE) increased $155.4 billion or 1.0 percent.
Advance Estimate of 2nd Quarter 2021 GDP – Released 7/29/2021 – Real gross domestic product (GDP) increased at an annual rate of 6.5 percent in the second quarter of 2021, according to the advance estimate released by the Bureau of Economic Analysis. The first quarter observed a 6.3 percent increase in real GDP. The GDP estimate released today is based on data that are incomplete or subject to additional revision. The increase in real GDP in the second quarter reflected increases in personal consumption expenditures (PCE), nonresidential fixed investment, exports, and state and local government spending that were partly offset by decreases in private inventory investment, residential fixed investment, and federal government spending. Imports, which are a subtraction in the calculation of GDP, increased.
Consumer Confidence – Released 7/27/2021 – The Consumer confidence index was relatively unchanged in June following five consecutive months of increases. The Index now shows its highest reading in a year of 129.1, up from 128.9 in June.
Durable Goods – Released 7/27/2021 – New orders for manufactured durable goods in June increased $2.1 billion or 0.8% to $257.6 billion. Transportation equipment led the increase rising $1.6 billion or 2.1% to $77.5 billion.
New Residential Sales – Released 7/26/2021 – Sales of new single-family homes decreased 6.6% to 724k, seasonally adjusted, in June. The median sales price of new homes sold in June was $361,800 with an average sales price of $428,700. At the end of June, the seasonally adjusted estimate of new homes for sale was 353k. This represents a supply of 6.3 months at the current sales rate.
Existing Home Sales – Released 7/22/2021 – Existing home sales increased in June ending four consecutive months of declines. Sales increased 1.4% to a seasonally adjusted rate of 5.86 million in June. Sales are currently up 22.9% from one year ago. Housing inventory sits at 1.25 million units. Up 3.3% from May’s inventory. Down 18.8% over last year. Unsold inventory sits at a 2.6-month supply. The median existing home price for all housing types was $363,300.
Next week we get data on Existing Home Sales, New Residential Sales, Durable Goods, Personal Income, and the Second Estimate of 2nd Quarter GDP.
Data Sources:
Bureau of Economic Analysis (BEA)
Congressional Budget Office (CBO)
U.S. Bureau of Labor Statistics (BLS)
Federal Reserve Economic Data (FRED Charts)
CME Fed Watch
U.S. Treasury – Yields
U.S. Census Bureau
Institute for Supply Management (ISM)
Weekly DOL Employment Data
BLS Monthly Jobs Report
JOLTS
US Energy Admin (EIA)
BLS Consumer Price Index CPI
BLS Producer Price Index PPI
Atlanta Fed GDPNOW
NY Fed Nowcast GDP
US Census Bureau Housing Starts
Consumer Credit
USCB Retail Sales
Construction Spending
Federal Reserve Dot Plots
NY Empire Index
Philadelphia Federal Reserve
P/E Ratio Data -Yardeni Research
Technical Analysis Info:
StockCharts.com – Financial Charts
Exponential vs Simple moving average
Other Links:
1973 Arab Oil Embargo
Hunt Brothers Silver
Long-Term Capital bailout
Categories:
Tags: