New All-Time Highs Again for the S&P500 – 38 and counting in 2021
The S&P500 closed at another all-time high on Friday, pushed buy large cap growth. LCG pushed the index to new highs while extending its outperformance vs value by about 130 bps for the week. REITs put in the best performance with digital and communication infrastructure names the bright spots. Consumer discretionary was another standout though AMZN +5.9% was largely responsible for the move. Homebuilders came under pressure, cruise lines sold off, hotels and casinos were mostly weaker and most of the retail space lagged. Tech beat the tape with upside leadership from AAPL +3.7%, which saw some positive sell-side commentary. Healthcare was up with the tape with help from BIIB +2.7%. Consumer staples was largely in line with COST +3.4% a notable gainer following stronger June comps. Industrials trailed the tape a bit but still finished higher. Airlines were down on coronavirus concerns, railroads were hit by potential regulatory headwinds for M&A, and machinery names were mostly weaker. Materials also lagged though there were pockets of strength in the industrial metals. Communications services lost ground this week some drag from FB (1.2%) after a big two-week rally, along with the pullback in most media names. Financials ended lower as banks underperformed as the yield curve continued flattening. Energy put in the worst performance on reflation trade unwinds and as oil snapped a big six-week winning streak on expectations that OPEC+ will ultimately repair its recent divisions and boost output. Treasuries rallied again with the 10-year yield ending the week down 8 bp at 1.37%, after falling all the way to the 1.26% level on Thursday. The dollar index was down 0.1%. Gold gained 1.5%. WTI crude lost 0.8%.
The big story this week was the continued downward pressure on bond yields. This was accompanied by some further scrutiny on the reflation trade in equities after value lagged growth by 400 bps in June and 720 bps and in Q2. Most of the focus remained on the traction behind the peak growth and peak inflation themes. The Fed’s hawkish tilt at the June FOMC meeting also continued to receive attention. In addition, there was widespread discussion about how the rate move was exacerbated by an unwinding of outsized short positioning. Worries about the potential global recovery risks from the Delta coronavirus variant were another factor. Much of the attention was on data out of Israel that showed the efficacy of the Pfizer vaccine had fallen to 64% over the past month from 94% against previous strains. The peak growth theme was supported by the weaker than expected June ISM services.
China was also in the headlines throughout the week as Beijing ramped up its tech crackdown with ride hailing giant Didi in the crosshairs following its recent IPO. However, the market continued to largely ignore the ramp in US regulatory scrutiny surrounding big tech given the combination of high antitrust hurdles (both from a judicial and legislative perspective), longstanding sell-side skepticism about tail/breakup risk and the group’s leverage to secular growth and disruption themes. There did not seem to be anything particularly incremental surrounding fiscal policy. While a bipartisan infrastructure plan could be on the Senate floor in just a couple of weeks, the path to additional stimulus remained complicated by Democrats’ insistence on passing a separate measure via reconciliation. Despite the extent to which the deregulation theme played into the bullish narrative during the Trump administration, the broader market did not seem particularly concerned about the Biden administration’s far-reaching executive order today against anticompetitive practices.
Q3 earnings season kicks off next week. According to FactSet’s latest Earnings Insight report, S&P 500 earnings are expected to increase 64% y/y, up over 12 pp from the start of the quarter. Banks will grab the bulk of the attention with the bar seemingly low after the group gained just over 4% in Q2, lagging the broader market by 400 bps as the reflation trade came under scrutiny and management teams highlighted headwinds facing consumer banking and a more normalized trading environment. Fed Chair Powell delivers his semi-annual monetary policy testimony to Congress on Wednesday and Thursday. He is widely expected to reiterate the Fed’s largely transitory view of price pressures and commitment to a robust and inclusive labor market recovery. While he is likely to remain upbeat on the recovery path, he may also highlight risks from coronavirus variants. He is also likely to stress the extent to which the Fed will telegraph its tapering plans when it determines substantial further progress has been achieved
Value made new ATHs in May but hasn’t been able to push higher while growth hit new highs this week.

P/E ratios are still at the upper end of the range in most cases. Take a look at the difference between the R1kV and the R1kG, almost 1300 bps difference against 2022 estimates – Or even wider is the difference between the R2k growth and value 43.1 vs 17 respectively (2022 est.).
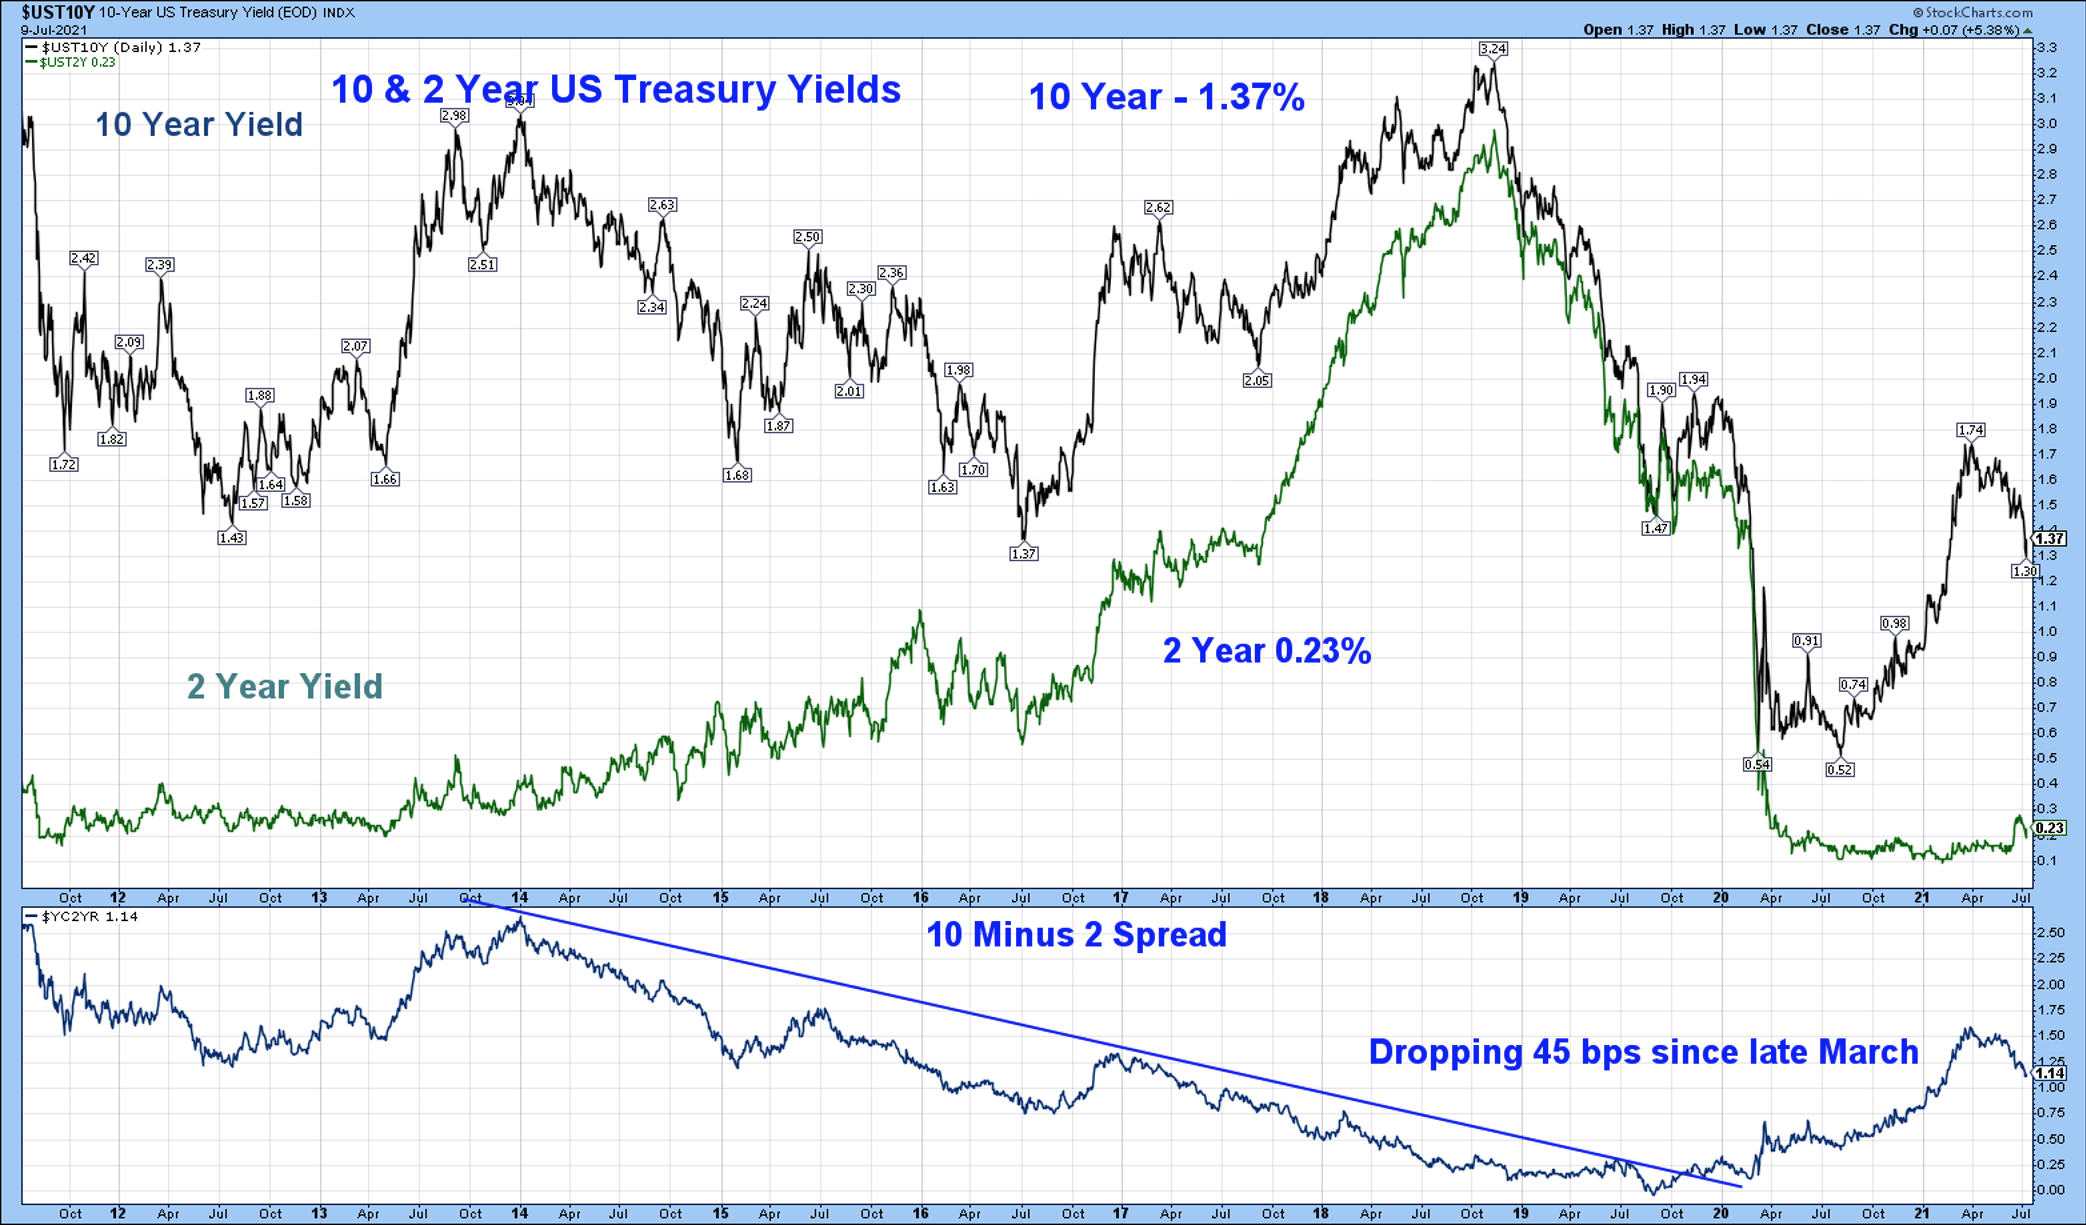
10 Year Break Even inflation rate now stands at 2.22% down 10% from its May high of 2.54% As the Fed signaled that it recognized the building inflation pressures by bringing forward rate increase expectations, longer-term yields fell, in turn causing the yield curve to flatten from the first quarter. The 10-year yield fell 29 basis points to 1.45% after reaching a recent high in March. On Thursday the 10-year touched 1.26% and closed the week at 1.37%
Fixed Income
4/28/21 FOMC Statement FOMC Minutes Credit, Liquidity and Balance Sheet Federal Reserve Dot Plots US Corporate Debt Tops 7 Trillion Treasury.gov yields FOMC Policy Normalization Statement Longer Run Goals August 2020
Global Bond Yields
Daily US Treasury Yields
Foreign Exchange Market
Energy Complex
The Baker Hughes rig count increased by 4 this week. There are 479 oil and gas rigs operating in the US – Up 221 over last year.
Metals Complex
Employment Picture
Weekly Unemployment Claims – Released Thursday 7/8/2021 – Initial jobless claims for the week ending July 3rd increased 2k to 373k. The 4-week moving average was 395k, a decrease of 250.
Job Openings & Labor Turnover Survey JOLTS – Released 7/7/2021 – The U.S. Bureau of Labor Statistics reported the number and rate of job openings was little changed at 9.2 million on the last business day of May. Over the month, hires were little changed at 5.9 million and separations decreased to 5.3 million. Within separations, the quits rate decreased to 2.5%. The layoffs and discharges rates decreased to 0.9%.
June Jobs Report – BLS Summary – Released 7/2/2021 – The US Economy added 850k nonfarm jobs in June and the Unemployment rate was little changed 5.9%. Average hourly earnings increased by 10 cents to $30.40. Hiring highlights include +343k Leisure and Hospitality, +72k Professional and Business Services, and +188k Government.
- Average hourly earnings increased by 10 cents to $30.40.
- U3 unemployment rate was little changed at 5.9%. U6 unemployment rate declined to 9.8%.
- The labor force participation rate was unchanged at 61.6%.
- Average work week decreased 0.1 hour to 34.7 hours.
Employment Cost Index – Released 4/30/2021 – Compensation costs for civilian workers increased 0.9% for the 3-month period ending in March 2021. The 12-month period ending in March 2021 saw compensation costs increase by 2.6%. The 12-month period ending March 2020 increased 2.8%. Wages and salaries increased 2.7 percent over the year and increased 3.1 percent for the 12-month period ending in March 2020. Benefit costs increased 2.5 percent over the year and increased 2.1 percent for the 12-month period ending in March 2020. This report is published quarterly.
This Week’s Economic Data
Links take you to the data source
Consumer Credit – Released 7/8/2021 – Consumer credit increased at a seasonally adjusted annual rate of 10.0 percent in May. Revolving credit increased at an annual rate of 11.4 percent, while non revolving credit increased at an annual rate of 9.5 percent.
PMI Non-Manufacturing Index – Released 7/6/2021 – Economic activity in the non-manufacturing sector grew in June for the 13th consecutive month. ISM Non-Manufacturing registered 60.1 percent, which is 3.9 percentage points below the adjusted May reading of 64.0 percent.
Recent Economic Data
Links take you to the data source
US Light Vehicle Sales – Released 7/2/2021 – U.S. light vehicle sales were at a seasonally adjusted annual rate (SAAR) of 15.365 million units in June.
U.S. Trade Balance – Released 7/2/2021 – According to the U.S. Census Bureau of Economic Analysis the goods and services deficit increased in May by $2.2 billion to $71.2 billion. May exports were $206.0 billion, $1.3 billion more than April exports. May imports were $277.3 billion, $3.5 billion more than April imports. Year to date the goods and services deficit increased $110.9 billion or 45.8%, from the same period in 2020. Year to date exports and imports increased $101.6 billion or 11.4% and increased $212.5 billion or 18.7% respectively.
PMI Manufacturing Index – Released 7/1/2021 – June PMI declined 0.6% to 60.6% down from May’s reading of 61.2%. The New Orders Index was down 1.0% from May’s reading of 67.0% to 66.0%. The Production Index registered 60.8%, up 2.3%.
U.S. Construction Spending – Released 7/1/2021 – Construction spending declined 0.3% in May measuring at a seasonally adjusted annual rate of $1,545.3 billion. The May figure is 7.5% above the May 2020 estimate. Private construction spending was 0.3% below the revised April estimate at $1,203.3 billion. Public construction spending was 0.2% below the revised April estimate at $342.0 billion.
Chicago PMI – Released 6/30/2021 – Chicago PMI declined to a four-month low at 66.1 points in June. This marks 12 consecutive month above the 50-mark following a full year under it. Among the main five indicators, Order Backlogs saw the largest decline, with Supplier Deliveries posting the only gain.
Consumer Confidence – Released 6/29/2021 – The Consumer confidence index increased 6.1% in June marking four consecutive months of increases. The Index now shows its highest reading in a year of 127.3, up from 120.0 in May.
Personal Income – Released 6/25/2021 – Personal income decreased $414.3 billion or 2.0 percent in May according to estimates released today by the Bureau of Economic Analysis. Disposable personal income (DPI) decreased $436.3 billion or 2.3 percent and personal consumption expenditures (PCE) increased $2.9 billion or 0.1 percent.
Third Estimate of 1st Quarter 2021 GDP – Released 6/24/2021 – Real gross domestic product (GDP) increased at an annual rate of 6.4 percent in the first quarter of 2021, according to the third estimate released by the Bureau of Economic Analysis. The fourth quarter of 2020 saw an increase of 4.3 percent in real GDP. The increase in real GDP in the first quarter reflected increases in personal consumption expenditures (PCE), nonresidential fixed investment, federal government spending, residential fixed investment, and state and local government spending that were partly offset by decreases in private inventory investment and exports. Imports, which are a subtraction in the calculation of GDP, increased. The second estimate is based on more complete source data than were available for the “advance” estimate issued last month. In the advance estimate, the increase in real GDP was also 6.4 percent. Upward revisions to consumer spending and nonresidential fixed investment were offset by downward revisions to exports and private inventory investment. Imports, which are a subtraction in the calculation of GDP, were revised up. The third estimate of GDP released today is based on more complete source data than were available for the second estimate issued last month. In the second estimate, the increase in real GDP was also 6.4 percent. Upward revisions to nonresidential fixed investment, private inventory investment, and exports were offset by an upward revision to imports, which are a subtraction in the calculation of GDP.
Durable Goods – Released 6/24/2021 – New orders for manufactured durable goods in May increased $5.7 billion or 2.3% to $253.3 billion. Transportation equipment led the increase rising $5.2 billion or 7.6% to $74.2 billion.
New Residential Sales – Released 6/23/2021 – Sales of new single-family homes decreased 5.9% to 817,000, seasonally adjusted, in May. The median sales price of new homes sold in May was $374,400 with an average sales price of $430,600. At the end of May, the seasonally adjusted estimate of new homes for sale was 330k. This represents a supply of 5.1 months at the current sales rate.
Existing Home Sales – Released 6/22/2021 – Existing home sales decreased in May marking four consecutive months of declines. Sales decreased 0.9% to a seasonally adjusted rate of 5.80 million in May. Sales are currently up 44.6% from one year ago. Housing inventory sits at 1.23 million units. Up 7.0% from April’s inventory. Down 20.6% over last year. Unsold inventory sits at a 2.5-month supply. The median existing home price for all housing types was $350,300.
Housing Starts – Released 6/16/2021 – New home starts in May were at a seasonally adjusted annual rate of 1.572 million; down 9.5% below March, but 67.3% above last April’s rate. Building Permits were at a seasonally adjusted annual rate of 1.760 million, up 0.3% compared to March and up 60.9% over last year.
Retail Sales – Released 6/15/2021 – U.S. retail sales for May declined 1.3% to $620.2 billion but retail sales are 28.1% above May 2020. U.S. retail sales are up 36.2% year/y.
Industrial Production and Capacity Utilization – Released 6/15/2021 – In May Industrial production increased 0.8%. Manufacturing increased 0.9%. Mining increased 1.2%. Utilities output increased 0.2%. Total industrial production was 16.3% higher in May than a year ago, but still 1.4% below its pre-pandemic level. Total capacity utilization increased 0.6% to 75.2% in May which is 4.4% below its long run average.
Producer Price Index – Released 6/15/2021 – The Producer Price Index for final demand increased 0.8% in May. PPI less food and energy increased 1.1% in May.
Consumer Price Index – Released 6/10/2021 – Headline consumer prices rose 0.64% m/m in May following a 0.8% gain in April, ahead of the 0.5% consensus. Core consumer prices increased 0.74% m/m in May following a 0.9% gain in April, ahead of the 0.5% consensus. Headline prices were up 5.0% y/y, the biggest increase since June 2008. Core prices were up 3.8% y/y, the biggest increase since June 1992. Similar to the April CPI report, economist takeaways flagged base effects, reopening momentum and supply chain pressures. Airfares, parking fees, apparel and hotel lodging were among the reopening categories that saw some upward pressure. The semi shortage led to a 7.3% increase in used car prices following a 10.0% surge in April that UBS said was the largest increase in at least 68 years. New car prices were up 1.6%. BofA noted that together, new and used cars contributed 37 bp to core CPI, accounting for half of the May increase. Economists noted these trends largely fit with the Fed’s messaging about how price pressures will be transitory. However, they also pointed out that reopening categories and car prices have more room to run and “transitory” may be longer than expected, a dynamic that could have adverse implications for inflation expectations. There were also thoughts that higher commodity and housing/rental prices, as well as higher wages, could play into concerns about stickier inflation.
Next week we get data on CPI, PPI, Industrial Production and Capacity Utilization, and Retail Sales.
Data Sources:
Bureau of Economic Analysis (BEA)
Congressional Budget Office (CBO)
U.S. Bureau of Labor Statistics (BLS)
Federal Reserve Economic Data (FRED Charts)
CME Fed Watch
U.S. Treasury – Yields
U.S. Census Bureau
Institute for Supply Management (ISM)
Weekly DOL Employment Data
BLS Monthly Jobs Report
JOLTS
US Energy Admin (EIA)
BLS Consumer Price Index CPI
BLS Producer Price Index PPI
Atlanta Fed GDPNOW
NY Fed Nowcast GDP
US Census Bureau Housing Starts
Consumer Credit
USCB Retail Sales
Construction Spending
Federal Reserve Dot Plots
NY Empire Index
Philadelphia Federal Reserve
P/E Ratio Data -Yardeni Research
Technical Analysis Info:
StockCharts.com – Financial Charts
Exponential vs Simple moving average
Other Links:
1973 Arab Oil Embargo
Hunt Brothers Silver
Long-Term Capital bailout


New All-Time Highs Again for the S&P500 – 38 and counting in 2021
The S&P500 closed at another all-time high on Friday, pushed buy large cap growth. LCG pushed the index to new highs while extending its outperformance vs value by about 130 bps for the week. REITs put in the best performance with digital and communication infrastructure names the bright spots. Consumer discretionary was another standout though AMZN +5.9% was largely responsible for the move. Homebuilders came under pressure, cruise lines sold off, hotels and casinos were mostly weaker and most of the retail space lagged. Tech beat the tape with upside leadership from AAPL +3.7%, which saw some positive sell-side commentary. Healthcare was up with the tape with help from BIIB +2.7%. Consumer staples was largely in line with COST +3.4% a notable gainer following stronger June comps. Industrials trailed the tape a bit but still finished higher. Airlines were down on coronavirus concerns, railroads were hit by potential regulatory headwinds for M&A, and machinery names were mostly weaker. Materials also lagged though there were pockets of strength in the industrial metals. Communications services lost ground this week some drag from FB (1.2%) after a big two-week rally, along with the pullback in most media names. Financials ended lower as banks underperformed as the yield curve continued flattening. Energy put in the worst performance on reflation trade unwinds and as oil snapped a big six-week winning streak on expectations that OPEC+ will ultimately repair its recent divisions and boost output. Treasuries rallied again with the 10-year yield ending the week down 8 bp at 1.37%, after falling all the way to the 1.26% level on Thursday. The dollar index was down 0.1%. Gold gained 1.5%. WTI crude lost 0.8%.
The big story this week was the continued downward pressure on bond yields. This was accompanied by some further scrutiny on the reflation trade in equities after value lagged growth by 400 bps in June and 720 bps and in Q2. Most of the focus remained on the traction behind the peak growth and peak inflation themes. The Fed’s hawkish tilt at the June FOMC meeting also continued to receive attention. In addition, there was widespread discussion about how the rate move was exacerbated by an unwinding of outsized short positioning. Worries about the potential global recovery risks from the Delta coronavirus variant were another factor. Much of the attention was on data out of Israel that showed the efficacy of the Pfizer vaccine had fallen to 64% over the past month from 94% against previous strains. The peak growth theme was supported by the weaker than expected June ISM services.
China was also in the headlines throughout the week as Beijing ramped up its tech crackdown with ride hailing giant Didi in the crosshairs following its recent IPO. However, the market continued to largely ignore the ramp in US regulatory scrutiny surrounding big tech given the combination of high antitrust hurdles (both from a judicial and legislative perspective), longstanding sell-side skepticism about tail/breakup risk and the group’s leverage to secular growth and disruption themes. There did not seem to be anything particularly incremental surrounding fiscal policy. While a bipartisan infrastructure plan could be on the Senate floor in just a couple of weeks, the path to additional stimulus remained complicated by Democrats’ insistence on passing a separate measure via reconciliation. Despite the extent to which the deregulation theme played into the bullish narrative during the Trump administration, the broader market did not seem particularly concerned about the Biden administration’s far-reaching executive order today against anticompetitive practices.
Q3 earnings season kicks off next week. According to FactSet’s latest Earnings Insight report, S&P 500 earnings are expected to increase 64% y/y, up over 12 pp from the start of the quarter. Banks will grab the bulk of the attention with the bar seemingly low after the group gained just over 4% in Q2, lagging the broader market by 400 bps as the reflation trade came under scrutiny and management teams highlighted headwinds facing consumer banking and a more normalized trading environment. Fed Chair Powell delivers his semi-annual monetary policy testimony to Congress on Wednesday and Thursday. He is widely expected to reiterate the Fed’s largely transitory view of price pressures and commitment to a robust and inclusive labor market recovery. While he is likely to remain upbeat on the recovery path, he may also highlight risks from coronavirus variants. He is also likely to stress the extent to which the Fed will telegraph its tapering plans when it determines substantial further progress has been achieved
Value made new ATHs in May but hasn’t been able to push higher while growth hit new highs this week.
P/E ratios are still at the upper end of the range in most cases. Take a look at the difference between the R1kV and the R1kG, almost 1300 bps difference against 2022 estimates – Or even wider is the difference between the R2k growth and value 43.1 vs 17 respectively (2022 est.).
10 Year Break Even inflation rate now stands at 2.22% down 10% from its May high of 2.54% As the Fed signaled that it recognized the building inflation pressures by bringing forward rate increase expectations, longer-term yields fell, in turn causing the yield curve to flatten from the first quarter. The 10-year yield fell 29 basis points to 1.45% after reaching a recent high in March. On Thursday the 10-year touched 1.26% and closed the week at 1.37%
Table of Contents
Fixed Income
4/28/21 FOMC Statement FOMC Minutes Credit, Liquidity and Balance Sheet Federal Reserve Dot Plots US Corporate Debt Tops 7 Trillion Treasury.gov yields FOMC Policy Normalization Statement Longer Run Goals August 2020
Global Bond Yields
Daily US Treasury Yields
Foreign Exchange Market
Energy Complex
The Baker Hughes rig count increased by 4 this week. There are 479 oil and gas rigs operating in the US – Up 221 over last year.
Metals Complex
Employment Picture
Weekly Unemployment Claims – Released Thursday 7/8/2021 – Initial jobless claims for the week ending July 3rd increased 2k to 373k. The 4-week moving average was 395k, a decrease of 250.
Job Openings & Labor Turnover Survey JOLTS – Released 7/7/2021 – The U.S. Bureau of Labor Statistics reported the number and rate of job openings was little changed at 9.2 million on the last business day of May. Over the month, hires were little changed at 5.9 million and separations decreased to 5.3 million. Within separations, the quits rate decreased to 2.5%. The layoffs and discharges rates decreased to 0.9%.
June Jobs Report – BLS Summary – Released 7/2/2021 – The US Economy added 850k nonfarm jobs in June and the Unemployment rate was little changed 5.9%. Average hourly earnings increased by 10 cents to $30.40. Hiring highlights include +343k Leisure and Hospitality, +72k Professional and Business Services, and +188k Government.
Employment Cost Index – Released 4/30/2021 – Compensation costs for civilian workers increased 0.9% for the 3-month period ending in March 2021. The 12-month period ending in March 2021 saw compensation costs increase by 2.6%. The 12-month period ending March 2020 increased 2.8%. Wages and salaries increased 2.7 percent over the year and increased 3.1 percent for the 12-month period ending in March 2020. Benefit costs increased 2.5 percent over the year and increased 2.1 percent for the 12-month period ending in March 2020. This report is published quarterly.
This Week’s Economic Data
Links take you to the data source
Consumer Credit – Released 7/8/2021 – Consumer credit increased at a seasonally adjusted annual rate of 10.0 percent in May. Revolving credit increased at an annual rate of 11.4 percent, while non revolving credit increased at an annual rate of 9.5 percent.
PMI Non-Manufacturing Index – Released 7/6/2021 – Economic activity in the non-manufacturing sector grew in June for the 13th consecutive month. ISM Non-Manufacturing registered 60.1 percent, which is 3.9 percentage points below the adjusted May reading of 64.0 percent.
Recent Economic Data
Links take you to the data source
US Light Vehicle Sales – Released 7/2/2021 – U.S. light vehicle sales were at a seasonally adjusted annual rate (SAAR) of 15.365 million units in June.
U.S. Trade Balance – Released 7/2/2021 – According to the U.S. Census Bureau of Economic Analysis the goods and services deficit increased in May by $2.2 billion to $71.2 billion. May exports were $206.0 billion, $1.3 billion more than April exports. May imports were $277.3 billion, $3.5 billion more than April imports. Year to date the goods and services deficit increased $110.9 billion or 45.8%, from the same period in 2020. Year to date exports and imports increased $101.6 billion or 11.4% and increased $212.5 billion or 18.7% respectively.
PMI Manufacturing Index – Released 7/1/2021 – June PMI declined 0.6% to 60.6% down from May’s reading of 61.2%. The New Orders Index was down 1.0% from May’s reading of 67.0% to 66.0%. The Production Index registered 60.8%, up 2.3%.
U.S. Construction Spending – Released 7/1/2021 – Construction spending declined 0.3% in May measuring at a seasonally adjusted annual rate of $1,545.3 billion. The May figure is 7.5% above the May 2020 estimate. Private construction spending was 0.3% below the revised April estimate at $1,203.3 billion. Public construction spending was 0.2% below the revised April estimate at $342.0 billion.
Chicago PMI – Released 6/30/2021 – Chicago PMI declined to a four-month low at 66.1 points in June. This marks 12 consecutive month above the 50-mark following a full year under it. Among the main five indicators, Order Backlogs saw the largest decline, with Supplier Deliveries posting the only gain.
Consumer Confidence – Released 6/29/2021 – The Consumer confidence index increased 6.1% in June marking four consecutive months of increases. The Index now shows its highest reading in a year of 127.3, up from 120.0 in May.
Personal Income – Released 6/25/2021 – Personal income decreased $414.3 billion or 2.0 percent in May according to estimates released today by the Bureau of Economic Analysis. Disposable personal income (DPI) decreased $436.3 billion or 2.3 percent and personal consumption expenditures (PCE) increased $2.9 billion or 0.1 percent.
Third Estimate of 1st Quarter 2021 GDP – Released 6/24/2021 – Real gross domestic product (GDP) increased at an annual rate of 6.4 percent in the first quarter of 2021, according to the third estimate released by the Bureau of Economic Analysis. The fourth quarter of 2020 saw an increase of 4.3 percent in real GDP. The increase in real GDP in the first quarter reflected increases in personal consumption expenditures (PCE), nonresidential fixed investment, federal government spending, residential fixed investment, and state and local government spending that were partly offset by decreases in private inventory investment and exports. Imports, which are a subtraction in the calculation of GDP, increased. The second estimate is based on more complete source data than were available for the “advance” estimate issued last month. In the advance estimate, the increase in real GDP was also 6.4 percent. Upward revisions to consumer spending and nonresidential fixed investment were offset by downward revisions to exports and private inventory investment. Imports, which are a subtraction in the calculation of GDP, were revised up. The third estimate of GDP released today is based on more complete source data than were available for the second estimate issued last month. In the second estimate, the increase in real GDP was also 6.4 percent. Upward revisions to nonresidential fixed investment, private inventory investment, and exports were offset by an upward revision to imports, which are a subtraction in the calculation of GDP.
Durable Goods – Released 6/24/2021 – New orders for manufactured durable goods in May increased $5.7 billion or 2.3% to $253.3 billion. Transportation equipment led the increase rising $5.2 billion or 7.6% to $74.2 billion.
New Residential Sales – Released 6/23/2021 – Sales of new single-family homes decreased 5.9% to 817,000, seasonally adjusted, in May. The median sales price of new homes sold in May was $374,400 with an average sales price of $430,600. At the end of May, the seasonally adjusted estimate of new homes for sale was 330k. This represents a supply of 5.1 months at the current sales rate.
Existing Home Sales – Released 6/22/2021 – Existing home sales decreased in May marking four consecutive months of declines. Sales decreased 0.9% to a seasonally adjusted rate of 5.80 million in May. Sales are currently up 44.6% from one year ago. Housing inventory sits at 1.23 million units. Up 7.0% from April’s inventory. Down 20.6% over last year. Unsold inventory sits at a 2.5-month supply. The median existing home price for all housing types was $350,300.
Housing Starts – Released 6/16/2021 – New home starts in May were at a seasonally adjusted annual rate of 1.572 million; down 9.5% below March, but 67.3% above last April’s rate. Building Permits were at a seasonally adjusted annual rate of 1.760 million, up 0.3% compared to March and up 60.9% over last year.
Retail Sales – Released 6/15/2021 – U.S. retail sales for May declined 1.3% to $620.2 billion but retail sales are 28.1% above May 2020. U.S. retail sales are up 36.2% year/y.
Industrial Production and Capacity Utilization – Released 6/15/2021 – In May Industrial production increased 0.8%. Manufacturing increased 0.9%. Mining increased 1.2%. Utilities output increased 0.2%. Total industrial production was 16.3% higher in May than a year ago, but still 1.4% below its pre-pandemic level. Total capacity utilization increased 0.6% to 75.2% in May which is 4.4% below its long run average.
Producer Price Index – Released 6/15/2021 – The Producer Price Index for final demand increased 0.8% in May. PPI less food and energy increased 1.1% in May.
Consumer Price Index – Released 6/10/2021 – Headline consumer prices rose 0.64% m/m in May following a 0.8% gain in April, ahead of the 0.5% consensus. Core consumer prices increased 0.74% m/m in May following a 0.9% gain in April, ahead of the 0.5% consensus. Headline prices were up 5.0% y/y, the biggest increase since June 2008. Core prices were up 3.8% y/y, the biggest increase since June 1992. Similar to the April CPI report, economist takeaways flagged base effects, reopening momentum and supply chain pressures. Airfares, parking fees, apparel and hotel lodging were among the reopening categories that saw some upward pressure. The semi shortage led to a 7.3% increase in used car prices following a 10.0% surge in April that UBS said was the largest increase in at least 68 years. New car prices were up 1.6%. BofA noted that together, new and used cars contributed 37 bp to core CPI, accounting for half of the May increase. Economists noted these trends largely fit with the Fed’s messaging about how price pressures will be transitory. However, they also pointed out that reopening categories and car prices have more room to run and “transitory” may be longer than expected, a dynamic that could have adverse implications for inflation expectations. There were also thoughts that higher commodity and housing/rental prices, as well as higher wages, could play into concerns about stickier inflation.
Next week we get data on CPI, PPI, Industrial Production and Capacity Utilization, and Retail Sales.
Data Sources:
Bureau of Economic Analysis (BEA)
Congressional Budget Office (CBO)
U.S. Bureau of Labor Statistics (BLS)
Federal Reserve Economic Data (FRED Charts)
CME Fed Watch
U.S. Treasury – Yields
U.S. Census Bureau
Institute for Supply Management (ISM)
Weekly DOL Employment Data
BLS Monthly Jobs Report
JOLTS
US Energy Admin (EIA)
BLS Consumer Price Index CPI
BLS Producer Price Index PPI
Atlanta Fed GDPNOW
NY Fed Nowcast GDP
US Census Bureau Housing Starts
Consumer Credit
USCB Retail Sales
Construction Spending
Federal Reserve Dot Plots
NY Empire Index
Philadelphia Federal Reserve
P/E Ratio Data -Yardeni Research
Technical Analysis Info:
StockCharts.com – Financial Charts
Exponential vs Simple moving average
Other Links:
1973 Arab Oil Embargo
Hunt Brothers Silver
Long-Term Capital bailout
Categories:
Tags: