New All Time Highs, Again
US equities rallied this week. Value outperformed growth. Energy put in the best performance as oil gained for a fifth straight week. Financials outperformed as banks bounced with some help from a shift in focus to favorable capital return dynamics. Industrials rallied with upside leadership from machinery, equipment rental and building materials. Consumer discretionary was boosted by retail, apparel and accessories and select auto names. Communications services gained nearly 2.5% while Tech also fared well. Materials lagged the tape though industrial metals, particularly aluminum and copper names, saw big gains. Defensive sectors lagged though still finished higher. Treasuries were weaker with a big chunk of the damage done on Friday as 10-year yields jumped back above 1.50%. The dollar index was down ~0.5%. Gold was up 0.5%, snapping a three-week losing streak. WTI crude gained nearly 4%.
There seemed to be a number of different factors behind this week’s bounce. These included thoughts last week’s pullback was overdone, particularly in terms of the extent of the damage done to value and cyclicals. The buy-the-dip mantra remained intact with retail investors reportedly buying a record amount last Friday and inflows continuing this week. In addition, Fed leadership seemed to help dampen some of the concerns about the hawkish takeaways from the June FOMC meeting. The central bank liquidity tailwind remained a big theme with the Fed balance sheet hitting another new record high and posting its biggest four-week expansion in over a year. An agreement between a bipartisan group of senators and the White House on infrastructure stimulus was another bright spot for sentiment despite the still very complicated path to passage. More discussion about peak inflation, some strategist pushback against peak growth/revisions signaling for stocks, and the vaccination-driven improvement in the virus situation despite the increased prevalence of the Delta variant were among some of the other positives. Next week’s focus will be on June ISM manufacturing and employment data.
Despite bipartisan agreement, infrastructure deal remains complicated: President Biden said on Thursday that the White House had reached a deal with a bipartisan group of senators on infrastructure stimulus. As largely previewed, the $1.2T framework (over eight years) includes $579B in new spending largely focused on “traditional infrastructure” such as roads and bridges. Funding will come from increased IRS enforcement, redirecting unspent Covid relief funds, targeted corporate user fees and public-private partnerships, but not tax increases or indexing the gasoline tax to inflation. While the agreement was a positive for risk sentiment, there was a healthy dose of skepticism about the prospects for passage. This was largely a function of the insistence on the part of progressives, Democratic leadership and the White House that the Senate also pass a separate package via reconciliation that includes Democratic priorities surrounding climate change and human infrastructure. From a market perspective, the prospect of a larger bill via reconciliation keeps tax increases in play, though strategists don’t expect the corporate tax rate to go above 25% and have downplayed the impact of the selling related to an increase in the capital gains tax rate.
June payrolls the focus for next week: The economic calendar will be in focus next with the June China PMIs on Wednesday, ISM manufacturing on Thursday and non-farm payrolls on Friday. In terms of the latter, the Street is looking for a ~690K increase following disappointing 559K and 278JK gains in May and April, respectively. The unemployment rate is expected to tick down 0.1pp to 5.7%, while average hourly earnings are seen up 0.3% m/m and 3.6%, with both measures down slightly from May. When it comes to the labor market, the two big themes continue to revolve around reopening momentum and supply constraints.
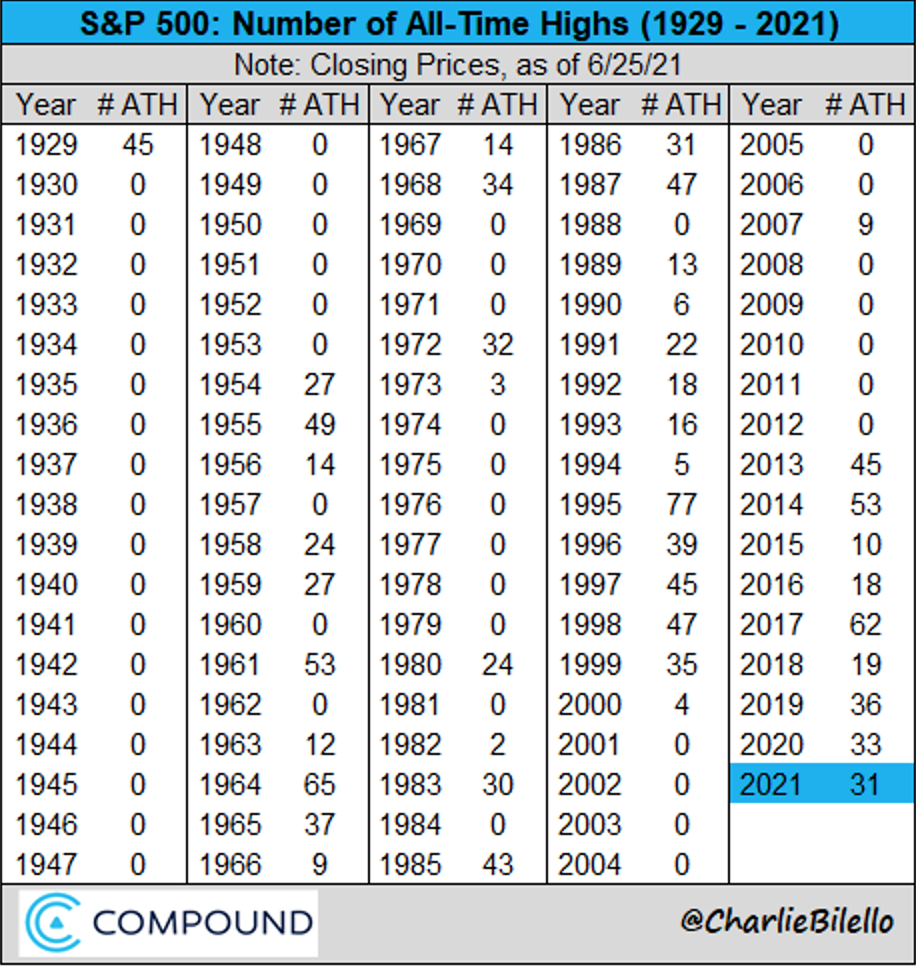
All-Time Highs – Friday’s all-time high on the S&P was this years’ 31st. Charlie Bilello over at Compound Advisors has done some great research on the matter and put this out over the weekend – https://twitter.com/charliebilello/status/1409224500047142913?s=20
All % calculations are done using the daily closing prices.

Fixed Income
4/28/21 FOMC Statement FOMC Minutes Credit, Liquidity and Balance Sheet Federal Reserve Dot Plots US Corporate Debt Tops 7 Trillion Treasury.gov yields FOMC Policy Normalization Statement Longer Run Goals August 2020
Global Bond Yields
Daily US Treasury Yields
Foreign Exchange Market
Energy Complex
Metals Complex
Employment Picture
Weekly Unemployment Claims – Released Thursday 6/24/2021 – Initial jobless claims for the week ending June 19th decreased 7k to 411k. The 4-week moving average was 398k, an increase of 1.5k.
Job Openings & Labor Turnover Survey JOLTS – Released 6/8/2021 – The U.S. Bureau of Labor Statistics reported the number and rate of job openings increased to 9.3 million on the last business day of April. Over the month, hires were little changed at 6.1 million and separations increased to 5.8 million. Within separations, the quits rate increased to 2.7%. The layoffs and discharges rates decreased to 1.0%.
May Jobs Report – BLS Summary – Released 6/4/2021 – The US Economy added 559k nonfarm jobs in May and the Unemployment rate declined 0.3% to 5.8%. Average hourly earnings increased by 15 cents to $30.33. Hiring highlights include +292k Leisure and Hospitality, +87k Education and Health Services, and +67k Government.
- Average hourly earnings increased by 15 cents to $30.33.
- U3 unemployment rate declined 0.3% to 5.8%. U6 unemployment rate declined to 10.2%.
- The labor force participation rate was little changed at 61.6%.
- Average work week was little changed at 34.9 hours.
Employment Cost Index – Released 4/30/2021 – Compensation costs for civilian workers increased 0.9% for the 3-month period ending in March 2021. The 12-month period ending in March 2021 saw compensation costs increase by 2.6%. The 12-month period ending March 2020 increased 2.8%. Wages and salaries increased 2.7 percent over the year and increased 3.1 percent for the 12-month period ending in March 2020. Benefit costs increased 2.5 percent over the year and increased 2.1 percent for the 12-month period ending in March 2020. This report is published quarterly.
This Week’s Economic Data
Links take you to the data source
Personal Income – Released 6/25/2021 – Personal income decreased $414.3 billion or 2.0 percent in May according to estimates released today by the Bureau of Economic Analysis. Disposable personal income (DPI) decreased $436.3 billion or 2.3 percent and personal consumption expenditures (PCE) increased $2.9 billion or 0.1 percent.
Third Estimate of 1st Quarter 2021 GDP – Released 6/24/2021 – Real gross domestic product (GDP) increased at an annual rate of 6.4 percent in the first quarter of 2021, according to the third estimate released by the Bureau of Economic Analysis. The fourth quarter of 2020 saw an increase of 4.3 percent in real GDP. The increase in real GDP in the first quarter reflected increases in personal consumption expenditures (PCE), nonresidential fixed investment, federal government spending, residential fixed investment, and state and local government spending that were partly offset by decreases in private inventory investment and exports. Imports, which are a subtraction in the calculation of GDP, increased. The second estimate is based on more complete source data than were available for the “advance” estimate issued last month. In the advance estimate, the increase in real GDP was also 6.4 percent. Upward revisions to consumer spending and nonresidential fixed investment were offset by downward revisions to exports and private inventory investment. Imports, which are a subtraction in the calculation of GDP, were revised up. The third estimate of GDP released today is based on more complete source data than were available for the second estimate issued last month. In the second estimate, the increase in real GDP was also 6.4 percent. Upward revisions to nonresidential fixed investment, private inventory investment, and exports were offset by an upward revision to imports, which are a subtraction in the calculation of GDP.
Durable Goods – Released 6/24/2021 – New orders for manufactured durable goods in May increased $5.7 billion or 2.3% to $253.3 billion. Transportation equipment led the increase rising $5.2 billion or 7.6% to $74.2 billion.
New Residential Sales – Released 6/23/2021 – Sales of new single-family homes decreased 5.9% to 817,000, seasonally adjusted, in May. The median sales price of new homes sold in May was $374,400 with an average sales price of $430,600. At the end of May, the seasonally adjusted estimate of new homes for sale was 330k. This represents a supply of 5.1 months at the current sales rate.
Existing Home Sales – Released 6/22/2021 – Existing home sales decreased in May marking four consecutive months of declines. Sales decreased 0.9% to a seasonally adjusted rate of 5.80 million in May. Sales are currently up 44.6% from one year ago. Housing inventory sits at 1.23 million units. Up 7.0% from April’s inventory. Down 20.6% over last year. Unsold inventory sits at a 2.5-month supply. The median existing home price for all housing types was $350,300.
Recent Economic Data
Links take you to the data source
Housing Starts – Released 6/16/2021 – New home starts in May were at a seasonally adjusted annual rate of 1.572 million; down 9.5% below March, but 67.3% above last April’s rate. Building Permits were at a seasonally adjusted annual rate of 1.760 million, up 0.3% compared to March and up 60.9% over last year.
Retail Sales – Released 6/15/2021 – U.S. retail sales for May declined 1.3% to $620.2 billion but retail sales are 28.1% above May 2020. U.S. retail sales are up 36.2% year/y.
Industrial Production and Capacity Utilization – Released 6/15/2021 – In May Industrial production increased 0.8%. Manufacturing increased 0.9%. Mining increased 1.2%. Utilities output increased 0.2%. Total industrial production was 16.3% higher in May than a year ago, but still 1.4% below its pre-pandemic level. Total capacity utilization increased 0.6% to 75.2% in May which is 4.4% below its long run average.
Producer Price Index – Released 6/15/2021 – The Producer Price Index for final demand increased 0.8% in May. PPI less food and energy increased 1.1% in May.
Consumer Price Index – Released 6/10/2021 – Headline consumer prices rose 0.64% m/m in May following a 0.8% gain in April, ahead of the 0.5% consensus. Core consumer prices increased 0.74% m/m in May following a 0.9% gain in April, ahead of the 0.5% consensus. Headline prices were up 5.0% y/y, the biggest increase since June 2008. Core prices were up 3.8% y/y, the biggest increase since June 1992. Similar to the April CPI report, economist takeaways flagged base effects, reopening momentum and supply chain pressures. Airfares, parking fees, apparel and hotel lodging were among the reopening categories that saw some upward pressure. The semi shortage led to a 7.3% increase in used car prices following a 10.0% surge in April that UBS said was the largest increase in at least 68 years. New car prices were up 1.6%. BofA noted that together, new and used cars contributed 37 bp to core CPI, accounting for half of the May increase. Economists noted these trends largely fit with the Fed’s messaging about how price pressures will be transitory. However, they also pointed out that reopening categories and car prices have more room to run and “transitory” may be longer than expected, a dynamic that could have adverse implications for inflation expectations. There were also thoughts that higher commodity and housing/rental prices, as well as higher wages, could play into concerns about stickier inflation.
U.S. Trade Balance – Released 6/8/2021 – According to the U.S. Census Bureau of Economic Analysis the goods and services deficit decreased in April by $6.1 billion to $68.9 billion. April exports were $205.0 billion, $2.3 billion more than March exports. April imports were $273.9 billion, $3.8 billion less than March imports. Year to date the goods and services deficit increased $94.5 billion or 50.5%, from the same period in 2020. Year to date exports and imports increased $42.0 billion or 5.6% and increased $136.4 billion or 14.6% respectively.
Consumer Credit – Released 6/7/2021 – Consumer credit increased at a seasonally adjusted annual rate of 5.3 percent in April. Revolving credit decreased at an annual rate of 2.4 percent, while non-revolving credit increased at an annual rate of 7.6 percent.
US Light Vehicle Sales –Released 6/4/2021 – U.S. light vehicle sales were at a seasonally adjusted annual rate (SAAR) of 16.988 million units in May.
PMI Non-Manufacturing Index – Released 6/3/2021 – Economic activity in the non-manufacturing sector grew in May for the 12th consecutive month. ISM Non-Manufacturing registered 64.0 percent, which is 1.3 percentage points above the adjusted April reading of 62.7 percent.
PMI Manufacturing Index – Released 6/1/2021 – May PMI increased 0.5% to 61.2% from April’s reading of 60.7%. The New Orders Index was up 2.7% from April’s reading of 64.3% to 67.0%. The Production Index registered 58.5%, down 4.0%.
U.S. Construction Spending – Released 6/1/2021 – Construction spending increased 0.2% in April measuring at a seasonally adjusted annual rate of $1,524.2 billion. The April figure is 9.8% above the April 2020 estimate. Private construction spending was 0.4% above the revised March estimate at $1,180.7 billion. Public construction spending was 0.6% below the revised March estimate at $345.6 billion.
Chicago PMI – Released 5/28/2021 – Chicago PMI increased to 75.2 points in May. This marks 11 consecutive months above the 50-mark following a full year under it. Among the main five indicators, New Orders and Order Backlogs saw the largest gains, while Employment recorded the only decline.
Consumer Confidence – Released 5/25/2021 – The Consumer confidence index increased 11.7% in April following a sharp increase in March. The Index now shows its highest reading in a year of 121.7, up from 109.0 in March.
Next week we get data on Consumer Confidence, Chicago PMI, U.S. Construction Spending, PMI Manufacturing, the U.S. Trade Balance, and the June Jobs Report.
Data Sources:
Bureau of Economic Analysis (BEA)
Congressional Budget Office (CBO)
U.S. Bureau of Labor Statistics (BLS)
Federal Reserve Economic Data (FRED Charts)
CME Fed Watch
U.S. Treasury – Yields
U.S. Census Bureau
Institute for Supply Management (ISM)
Weekly DOL Employment Data
BLS Monthly Jobs Report
JOLTS
US Energy Admin (EIA)
BLS Consumer Price Index CPI
BLS Producer Price Index PPI
Atlanta Fed GDPNOW
NY Fed Nowcast GDP
US Census Bureau Housing Starts
Consumer Credit
USCB Retail Sales
Construction Spending
Federal Reserve Dot Plots
NY Empire Index
Philadelphia Federal Reserve
P/E Ratio Data -Yardeni Research
Technical Analysis Info:
StockCharts.com – Financial Charts
Exponential vs Simple moving average
Other Links:
1973 Arab Oil Embargo
Hunt Brothers Silver
Long-Term Capital bailout


New All Time Highs, Again
US equities rallied this week. Value outperformed growth. Energy put in the best performance as oil gained for a fifth straight week. Financials outperformed as banks bounced with some help from a shift in focus to favorable capital return dynamics. Industrials rallied with upside leadership from machinery, equipment rental and building materials. Consumer discretionary was boosted by retail, apparel and accessories and select auto names. Communications services gained nearly 2.5% while Tech also fared well. Materials lagged the tape though industrial metals, particularly aluminum and copper names, saw big gains. Defensive sectors lagged though still finished higher. Treasuries were weaker with a big chunk of the damage done on Friday as 10-year yields jumped back above 1.50%. The dollar index was down ~0.5%. Gold was up 0.5%, snapping a three-week losing streak. WTI crude gained nearly 4%.
There seemed to be a number of different factors behind this week’s bounce. These included thoughts last week’s pullback was overdone, particularly in terms of the extent of the damage done to value and cyclicals. The buy-the-dip mantra remained intact with retail investors reportedly buying a record amount last Friday and inflows continuing this week. In addition, Fed leadership seemed to help dampen some of the concerns about the hawkish takeaways from the June FOMC meeting. The central bank liquidity tailwind remained a big theme with the Fed balance sheet hitting another new record high and posting its biggest four-week expansion in over a year. An agreement between a bipartisan group of senators and the White House on infrastructure stimulus was another bright spot for sentiment despite the still very complicated path to passage. More discussion about peak inflation, some strategist pushback against peak growth/revisions signaling for stocks, and the vaccination-driven improvement in the virus situation despite the increased prevalence of the Delta variant were among some of the other positives. Next week’s focus will be on June ISM manufacturing and employment data.
Despite bipartisan agreement, infrastructure deal remains complicated: President Biden said on Thursday that the White House had reached a deal with a bipartisan group of senators on infrastructure stimulus. As largely previewed, the $1.2T framework (over eight years) includes $579B in new spending largely focused on “traditional infrastructure” such as roads and bridges. Funding will come from increased IRS enforcement, redirecting unspent Covid relief funds, targeted corporate user fees and public-private partnerships, but not tax increases or indexing the gasoline tax to inflation. While the agreement was a positive for risk sentiment, there was a healthy dose of skepticism about the prospects for passage. This was largely a function of the insistence on the part of progressives, Democratic leadership and the White House that the Senate also pass a separate package via reconciliation that includes Democratic priorities surrounding climate change and human infrastructure. From a market perspective, the prospect of a larger bill via reconciliation keeps tax increases in play, though strategists don’t expect the corporate tax rate to go above 25% and have downplayed the impact of the selling related to an increase in the capital gains tax rate.
June payrolls the focus for next week: The economic calendar will be in focus next with the June China PMIs on Wednesday, ISM manufacturing on Thursday and non-farm payrolls on Friday. In terms of the latter, the Street is looking for a ~690K increase following disappointing 559K and 278JK gains in May and April, respectively. The unemployment rate is expected to tick down 0.1pp to 5.7%, while average hourly earnings are seen up 0.3% m/m and 3.6%, with both measures down slightly from May. When it comes to the labor market, the two big themes continue to revolve around reopening momentum and supply constraints.
All-Time Highs – Friday’s all-time high on the S&P was this years’ 31st. Charlie Bilello over at Compound Advisors has done some great research on the matter and put this out over the weekend – https://twitter.com/charliebilello/status/1409224500047142913?s=20
All % calculations are done using the daily closing prices.
Table of Contents
Fixed Income
4/28/21 FOMC Statement FOMC Minutes Credit, Liquidity and Balance Sheet Federal Reserve Dot Plots US Corporate Debt Tops 7 Trillion Treasury.gov yields FOMC Policy Normalization Statement Longer Run Goals August 2020
Global Bond Yields
Daily US Treasury Yields
Foreign Exchange Market
Energy Complex
Metals Complex
Employment Picture
Weekly Unemployment Claims – Released Thursday 6/24/2021 – Initial jobless claims for the week ending June 19th decreased 7k to 411k. The 4-week moving average was 398k, an increase of 1.5k.
Job Openings & Labor Turnover Survey JOLTS – Released 6/8/2021 – The U.S. Bureau of Labor Statistics reported the number and rate of job openings increased to 9.3 million on the last business day of April. Over the month, hires were little changed at 6.1 million and separations increased to 5.8 million. Within separations, the quits rate increased to 2.7%. The layoffs and discharges rates decreased to 1.0%.
May Jobs Report – BLS Summary – Released 6/4/2021 – The US Economy added 559k nonfarm jobs in May and the Unemployment rate declined 0.3% to 5.8%. Average hourly earnings increased by 15 cents to $30.33. Hiring highlights include +292k Leisure and Hospitality, +87k Education and Health Services, and +67k Government.
Employment Cost Index – Released 4/30/2021 – Compensation costs for civilian workers increased 0.9% for the 3-month period ending in March 2021. The 12-month period ending in March 2021 saw compensation costs increase by 2.6%. The 12-month period ending March 2020 increased 2.8%. Wages and salaries increased 2.7 percent over the year and increased 3.1 percent for the 12-month period ending in March 2020. Benefit costs increased 2.5 percent over the year and increased 2.1 percent for the 12-month period ending in March 2020. This report is published quarterly.
This Week’s Economic Data
Links take you to the data source
Personal Income – Released 6/25/2021 – Personal income decreased $414.3 billion or 2.0 percent in May according to estimates released today by the Bureau of Economic Analysis. Disposable personal income (DPI) decreased $436.3 billion or 2.3 percent and personal consumption expenditures (PCE) increased $2.9 billion or 0.1 percent.
Third Estimate of 1st Quarter 2021 GDP – Released 6/24/2021 – Real gross domestic product (GDP) increased at an annual rate of 6.4 percent in the first quarter of 2021, according to the third estimate released by the Bureau of Economic Analysis. The fourth quarter of 2020 saw an increase of 4.3 percent in real GDP. The increase in real GDP in the first quarter reflected increases in personal consumption expenditures (PCE), nonresidential fixed investment, federal government spending, residential fixed investment, and state and local government spending that were partly offset by decreases in private inventory investment and exports. Imports, which are a subtraction in the calculation of GDP, increased. The second estimate is based on more complete source data than were available for the “advance” estimate issued last month. In the advance estimate, the increase in real GDP was also 6.4 percent. Upward revisions to consumer spending and nonresidential fixed investment were offset by downward revisions to exports and private inventory investment. Imports, which are a subtraction in the calculation of GDP, were revised up. The third estimate of GDP released today is based on more complete source data than were available for the second estimate issued last month. In the second estimate, the increase in real GDP was also 6.4 percent. Upward revisions to nonresidential fixed investment, private inventory investment, and exports were offset by an upward revision to imports, which are a subtraction in the calculation of GDP.
Durable Goods – Released 6/24/2021 – New orders for manufactured durable goods in May increased $5.7 billion or 2.3% to $253.3 billion. Transportation equipment led the increase rising $5.2 billion or 7.6% to $74.2 billion.
New Residential Sales – Released 6/23/2021 – Sales of new single-family homes decreased 5.9% to 817,000, seasonally adjusted, in May. The median sales price of new homes sold in May was $374,400 with an average sales price of $430,600. At the end of May, the seasonally adjusted estimate of new homes for sale was 330k. This represents a supply of 5.1 months at the current sales rate.
Existing Home Sales – Released 6/22/2021 – Existing home sales decreased in May marking four consecutive months of declines. Sales decreased 0.9% to a seasonally adjusted rate of 5.80 million in May. Sales are currently up 44.6% from one year ago. Housing inventory sits at 1.23 million units. Up 7.0% from April’s inventory. Down 20.6% over last year. Unsold inventory sits at a 2.5-month supply. The median existing home price for all housing types was $350,300.
Recent Economic Data
Links take you to the data source
Housing Starts – Released 6/16/2021 – New home starts in May were at a seasonally adjusted annual rate of 1.572 million; down 9.5% below March, but 67.3% above last April’s rate. Building Permits were at a seasonally adjusted annual rate of 1.760 million, up 0.3% compared to March and up 60.9% over last year.
Retail Sales – Released 6/15/2021 – U.S. retail sales for May declined 1.3% to $620.2 billion but retail sales are 28.1% above May 2020. U.S. retail sales are up 36.2% year/y.
Industrial Production and Capacity Utilization – Released 6/15/2021 – In May Industrial production increased 0.8%. Manufacturing increased 0.9%. Mining increased 1.2%. Utilities output increased 0.2%. Total industrial production was 16.3% higher in May than a year ago, but still 1.4% below its pre-pandemic level. Total capacity utilization increased 0.6% to 75.2% in May which is 4.4% below its long run average.
Producer Price Index – Released 6/15/2021 – The Producer Price Index for final demand increased 0.8% in May. PPI less food and energy increased 1.1% in May.
Consumer Price Index – Released 6/10/2021 – Headline consumer prices rose 0.64% m/m in May following a 0.8% gain in April, ahead of the 0.5% consensus. Core consumer prices increased 0.74% m/m in May following a 0.9% gain in April, ahead of the 0.5% consensus. Headline prices were up 5.0% y/y, the biggest increase since June 2008. Core prices were up 3.8% y/y, the biggest increase since June 1992. Similar to the April CPI report, economist takeaways flagged base effects, reopening momentum and supply chain pressures. Airfares, parking fees, apparel and hotel lodging were among the reopening categories that saw some upward pressure. The semi shortage led to a 7.3% increase in used car prices following a 10.0% surge in April that UBS said was the largest increase in at least 68 years. New car prices were up 1.6%. BofA noted that together, new and used cars contributed 37 bp to core CPI, accounting for half of the May increase. Economists noted these trends largely fit with the Fed’s messaging about how price pressures will be transitory. However, they also pointed out that reopening categories and car prices have more room to run and “transitory” may be longer than expected, a dynamic that could have adverse implications for inflation expectations. There were also thoughts that higher commodity and housing/rental prices, as well as higher wages, could play into concerns about stickier inflation.
U.S. Trade Balance – Released 6/8/2021 – According to the U.S. Census Bureau of Economic Analysis the goods and services deficit decreased in April by $6.1 billion to $68.9 billion. April exports were $205.0 billion, $2.3 billion more than March exports. April imports were $273.9 billion, $3.8 billion less than March imports. Year to date the goods and services deficit increased $94.5 billion or 50.5%, from the same period in 2020. Year to date exports and imports increased $42.0 billion or 5.6% and increased $136.4 billion or 14.6% respectively.
Consumer Credit – Released 6/7/2021 – Consumer credit increased at a seasonally adjusted annual rate of 5.3 percent in April. Revolving credit decreased at an annual rate of 2.4 percent, while non-revolving credit increased at an annual rate of 7.6 percent.
US Light Vehicle Sales –Released 6/4/2021 – U.S. light vehicle sales were at a seasonally adjusted annual rate (SAAR) of 16.988 million units in May.
PMI Non-Manufacturing Index – Released 6/3/2021 – Economic activity in the non-manufacturing sector grew in May for the 12th consecutive month. ISM Non-Manufacturing registered 64.0 percent, which is 1.3 percentage points above the adjusted April reading of 62.7 percent.
PMI Manufacturing Index – Released 6/1/2021 – May PMI increased 0.5% to 61.2% from April’s reading of 60.7%. The New Orders Index was up 2.7% from April’s reading of 64.3% to 67.0%. The Production Index registered 58.5%, down 4.0%.
U.S. Construction Spending – Released 6/1/2021 – Construction spending increased 0.2% in April measuring at a seasonally adjusted annual rate of $1,524.2 billion. The April figure is 9.8% above the April 2020 estimate. Private construction spending was 0.4% above the revised March estimate at $1,180.7 billion. Public construction spending was 0.6% below the revised March estimate at $345.6 billion.
Chicago PMI – Released 5/28/2021 – Chicago PMI increased to 75.2 points in May. This marks 11 consecutive months above the 50-mark following a full year under it. Among the main five indicators, New Orders and Order Backlogs saw the largest gains, while Employment recorded the only decline.
Consumer Confidence – Released 5/25/2021 – The Consumer confidence index increased 11.7% in April following a sharp increase in March. The Index now shows its highest reading in a year of 121.7, up from 109.0 in March.
Next week we get data on Consumer Confidence, Chicago PMI, U.S. Construction Spending, PMI Manufacturing, the U.S. Trade Balance, and the June Jobs Report.
Data Sources:
Bureau of Economic Analysis (BEA)
Congressional Budget Office (CBO)
U.S. Bureau of Labor Statistics (BLS)
Federal Reserve Economic Data (FRED Charts)
CME Fed Watch
U.S. Treasury – Yields
U.S. Census Bureau
Institute for Supply Management (ISM)
Weekly DOL Employment Data
BLS Monthly Jobs Report
JOLTS
US Energy Admin (EIA)
BLS Consumer Price Index CPI
BLS Producer Price Index PPI
Atlanta Fed GDPNOW
NY Fed Nowcast GDP
US Census Bureau Housing Starts
Consumer Credit
USCB Retail Sales
Construction Spending
Federal Reserve Dot Plots
NY Empire Index
Philadelphia Federal Reserve
P/E Ratio Data -Yardeni Research
Technical Analysis Info:
StockCharts.com – Financial Charts
Exponential vs Simple moving average
Other Links:
1973 Arab Oil Embargo
Hunt Brothers Silver
Long-Term Capital bailout
Categories:
Tags: