Good Life Advisors – Talking Points – Week 20
Growth Stock Beatings Will Continue Until Valuation Morale Improves
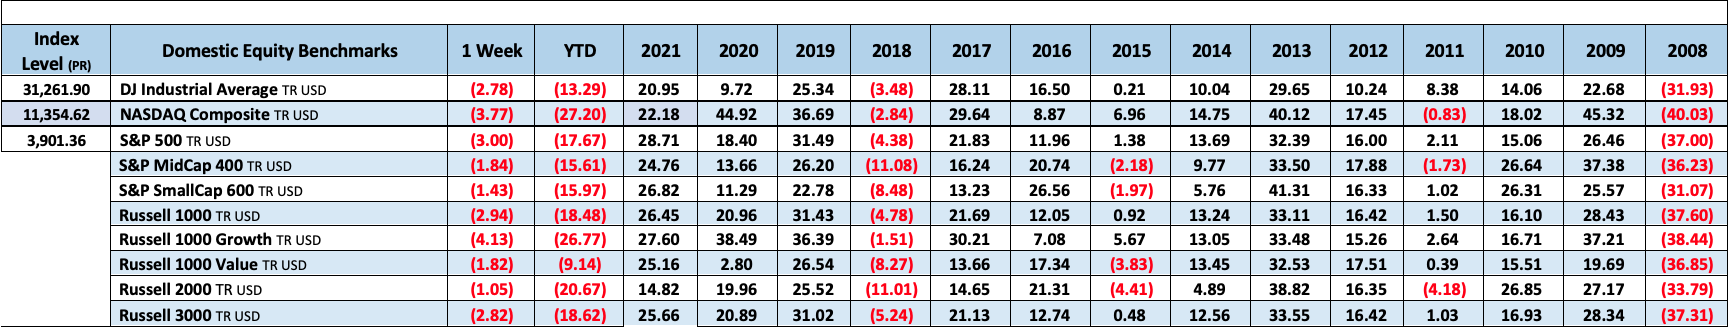
The S&P 500 closed Friday down 18.66% since its all-time closing high on January 3rd (4796). This marked its seventh straight weekly decline, its longest since 2001. The Dow capped an eight-week losing streak for the first time since 1923. Value continued to be a relative out performer beating growth by 2.3% (-1.81 vs -4.13) for the week. This brings the year-to-date Value/Growth outperformance to over 17% (-9.22 vs -26.82). While there was no defining catalyst for the week, multiple bearish themes remained very much in the discussion. There was keen focus on the Fed marching on the path to tighter monetary policy as it seeks to tamp down inflation, with many questions about its ability to engineer the hoped-for “softish” landing for the economy. Inflationary pressures remained front and center, with this week’s earnings results from retailers suggesting consumers are shifting their spending away from higher-ticket items as food and fuel prices rise. China’s Covid lockdowns look to continue, along with their impacts on the supply chain and Chinese consumers, as Beijing continues to follow its zero-Covid strategy. The war in Ukraine, while not a top-tier concern, still represents a large cloud of uncertainty. And there remain significant doubts whether the market has seen enough capitulation.
But amid the ramping recession calls and multiple analysts this week taking down 2022 GDP or S&P estimates, markets were still clinging to a few hopeful threads. While personal consumption may be shifting, the overall volume remains robust. April CPI data was underwhelming, but we may still be past peak inflation. Equity outflows have been picking up but remain minimal compared to the past 18 months of inflows. China has pledged support for its economy, and aid to date is running behind 2020’s pace. In the 12 recessions since WWII, the S&P has seen a median contraction of ~24%, suggesting much of the pain could already be priced in. There are also some contrarian buy signals in evidence, particularly a raft of indicators for depressed sentiment and positioning (BofA’s fund manager survey found portfolio cash levels at their highest since 9/11). However, all of these have been cited as possible factors behind every bounce attempt in recent weeks, none of which gained any traction.
Consumer staples trailed amid broadly weaker performance, with WMT’s (19.5%) disappointing Q1 report a key focus. Retailers were the weak spot in consumer discretionary, facing a lot of scrutiny following a big earnings miss at TGT (29.3%)/ The megacaps were down in tech, with the hardware and semis spaces largely lower. Road/rale makes lagged in industrials, though airlines had a good week. Communication services was largely in line, helped by entertainment and telecom but seeing GOOGL (6.2%) and FB (2.6%) lower. Financials beat the tape, helped by asset managers and a smattering of gainers in insurance and banks, Industrial metals (particularly copper/ aluminum firms), commodity chemicals, and select fertilizer names cushioned materials. Pharma was the strongest subgroup in healthcare, though managed care and hospitals were mostly lower. Energy led the market, with integrateds, E&Ps, and oil-services names all having a good week.
Retailers were a key focus this week, with some weak reports raising questions about consumer spending and margins. WMT (19.5%) flagged higher supply chain costs, larger general merchandise markdowns, and higher wage costs. TGT (29.3%) similarly pointed to high costs and inventory impairments. In both cases, management noted elevated inventory issues (leading to some markdowns), with TGT pointing to a consumer shift away from higher-margin discretionary items amid rising food and fuel costs.
China continued to garner its share of the headlines, with the Covid situation still unsettled. Friday was three new cases emerge outside Shanghai’s surveillance zones (breaking a six-day streak), denting hopes restrictions might start to be lifted soon. Meanwhile, cases continued to rise in Beijing and elsewhere, with the central government showing no sign of moving away from its strict zero-Covid approach. But in a positive move, there was more policy support announced, with the PBoC Friday making a larger-than-expected cut to the 5Y loan prime rate. Analysts calculated China has now pumped in ~$5.3T in stimulus this year, below the 2020 benchmark (which could signal the possibility of more to come).
There was no real change to the Fed narrative this week despite comments from Chair Powell on Tuesday. Powell largely stick to the narrative that has prevailed among Fed speakers lately, that the bank is committed to bringing inflation down and that it expects 50bp hikes at the next two meetings to be appropriate. Powell also reiterated his view that the economy (particularly the labor market) is strong enough to bear some tightening as the Fed looks for a pathway to a “softish” landing.
Economic data this week was mixed. Headline April retail sales were largely in line, though control-group sales surprised to the upside. However there were unexpectedly big drops in the May regional manufacturing surveys released by the NY and Philadelphia Fed. Housing starts and existing-home sales both logged their third-straight monthly decline as mortgage rates and prices each continued to climb. Homebuilder sentiment posted a sharp monthly drop as well.

Fixed Income
Balance Sheet Reduction Plan Credit, Liquidity and Balance Sheet Federal Reserve Dot Plots
US Corporate Debt Tops 7 Trillion. Treasury.gov yields FOMC Policy Normalization Statement Longer Run Goals August 2020
Foreign Exchange Market
Energy Complex
The Baker Hughes rig count gained 14 this week. There are 728 oil and gas rigs operating in the US – Up 273 over last year.
Metals Complex
Employment Picture
Weekly Unemployment Claims – Released Thursday 5/19/2022 – THe week ending May 14th observed an increase of 21k in initial claims increasing to 218k. The four-week moving average on initial jobless claims increased 8.25k to 199.5k.
April Jobs Report – BLS Summary Released 5/6/2022 – The US Economy added 428k nonfarm jobs in April and the Unemployment rate stayed unchanged at 3.6%. Average hourly earnings increased 10 to $31.85. Hiring highlights include +78k Leisure and Hospitality, +59k Education and Health Services, and +55k Manufacturing.
- Average hourly earnings increased 10 cents to $31.85.
- U3 unemployment rate remained unchanged at 3.6%. U6 unemployment rate slightly increased from 6.9% to 7%.
- The labor force participation rate was little changes at 62.25.
- Average work week was unchanged at 34.6 hours.
Job Openings & Labor Turnover Survey – JOLTS – Released 5/3/2022 – The US Bureau of Labor Statistics reported the number and rate of job openings increased to 11.5 million on the last business day of March. Over the month, hires were little changed at 6.7 million and separations increased to 6.3 million. Within separations, quits increased to 4.5 million. The layoffs and discharges rates were little changed at 1.4 million.
Employment Cost Index – Released 4/29/2022 – Compensation costs for civilian workers increased 1.4% for the 3-month period ending in March 2022. The 12-month period ending in March 2022 saw compensation costs increased by 4.5%. The 12-month period ending in March 2021 increased 2.6%. Wages and salaries increased 4.7% over the year and increased 2.7% for the 12-month period ending in March 2021. Benefit costs increased 4.1% over the year and increased 2.5% for the 12-month period ending in March 2021. This report is published quarterly.
This Week’s Economic Data
Links take you to the data source
Existing Home Sales – Released 5/19/2022 – Existing home sales decreased in April marking three consecutive months of declines. Sales declined 2.4% to a seasonally adjusted rate of 5.61 million in April. Sales decreased 5.9% year-over-year. Housing inventory sits at 1.03 million units, up 10.8% from March’s inventory and down 10.4% over last year. Unsold inventory sits at a 2.2 month supply. The median existing home price for all housing types was $391,200 which is up 14.8% from April 2021. This marks 1122 consecutive months of year-over-year increased, the longest-running streak on record.
Housing Starts – Released 5/18/2022 – New home starts in April were at a seasonally adjusted annual rate of 1.724 million; down 0.2% below March, but 14.6% above last April’s rate. Building permits were at a seasonally adjusted annual rate of 1.819 million, down 3.2% compared to March, but up 3.1% over last year.
Industrial Production and Capacity Utilization – Released 5/17/2022 – In April, Industrial production increased 1.1%. Manufacturing increased 0.8%. Utilities output increased 2.4%. Mining output increased 1.6%. Total industrial production was 6.4% higher in April than a year ago. Total capacity utilization increased 0.7% to 79% in April, which is 0.5% below its long run average.
Retail Sales – Released 5/17/2022 – US retail sales for April increased 0.9% to $677.7 billion and retail sales are 8.2% above April 2021. US retail sales for the February 2022 through April 2022 period were up 10.8% for the same period a year ago.
Recent Economic Data
Links take you to the data source
Producer Price Index – Released 5/12/2022– The Producer Price Index for final demand increased 0.5% in April. PPI less food and energy increased 1%. The change in PPI for final demand has increased 11% year/y.
Consumer Price Index – Released 5/11/2022– Consumer prices rose 0.3% m/m in April following a 1.25 increase in March. Consumer prices are up 8.3% for the 12-month period ending in April. Core consumer prices increased 0.6% m/m in April following a 0.3% gain in March.
Consumer Credit – Released 5/6/2022 – Consumer credit increased at a seasonally adjusted annual rate of 9.7% in the first quarter of 2022. Revolving credit increased at an annual rate of 21.4%, while nonrevolving credit increased at an annual rate of 6.1%.
U.S. Trade Balance – Released 5/4/2022 – According to the US Census Bureau of Economic Analysis, the goods and services deficit increased in March by $20 billion to $109.8 billion. March exports were $241.7 billion, $12.9 billion more than February exports. March imports were $351.5 billion, $32.9 billion more than February imports. Year to date, the goods and services deficit increased $84.8 billion, or 41.5%, from the same period in 2021. Exports increased $104.5 billion or 17.7%. Imports increased $189.3 billion or 23.8%.
PMI Non-Manufacturing Index – Released 5/4/2022 – Economic activity in the non-manufacturing sector grew in April for the 23rd consecutive month. ISM Non-Manufacturing registered 57.1%, which is 1.2 percentage points below the March reading of 58.3%.
PMI Manufacturing Index – Released 5/2/2022 – April PMI decreased 1.7% to 55.4% down from March’s reading of 57.1%. The New Orders Index was 53.5% down 0.3% from March’s reading of 53.8%. The Production Index registered 53.6%, down 0.9%.
U.S. Construction Spending – Released 5/2/2022 – Construction spending increased 0.1% in March measuring at a seasonally adjusted annual rate of $1,730.5 billion. The March figure is 11.7% above the March 2021 estimate. Private construction spending was 0.2% above the revised February estimate at $1,376.9 billion. Public construction spending was 0.2% below the revised February estimate at $350.8 billion.
US Light Vehicle Sales – Released 4/29/2022 – US light vehicle sales were at a seasonally adjusted annual rate (SAAR) of 13.365 million units in March.
Chicago PMI – Released 4/29/2022 – Chicago PMI decreased by 6.5 points in April to 56.4. All five of the main five indicators decreased.
Personal Income – Released 4/29/2022 – Personal income increased $107.2 billion or 0.5% on March according to estimates released today by the Bureau of Economic Analysis. Disposable Personal Income (DPI) increased $89.7 billion or 0.5% and Personal Consumption Expenditures (PCE) increased $185 billion or 1.1%.
Advance Estimate of 1st Quarter 2022 GDP – Released 4/28/2022 – Real Gross Domestic Product (GDP) decreased at an annual rate of 1.4% in the first quarter of 2022, according to the advance estimate released by the Bureau of Economic Analysis. GDP increased 6.9% in the fourth quarter of 2021. The GDP advance estimate is based on data that are incomplete or subject to further revision. The decrease in real GDP reflected decreases in private inventory investment, exports, federal government spending, and state and local government spending, while imports, which are a subtraction in the calculation of GDP, increased. Personal Consumption Expenditures (PCE), nonresidential fixed investment, and residential fixed investment increased.
Consumer Confidence – Released 4/26/2022 – The Consumer Confidence Index saw a slight decline in April following an increase in March. The Index now stands at 107.3, down from 107.6 in March.
Durable Goods – Released 4/26/2022 – New orders for manufactured durable goods in March increased $2.3 billion or 0.8% to $275 billion. Computer and electronic products led the increase rising $0.7 billion or 2.6% to $26.3 billion.
New Residential Sales – Released 4/26/2022 – Sales of new single-family homes decreased 8.6% to 763k, seasonally adjusted, in March. The median sales price of new homes sold in February was $436,700 with an average sales price of $523,900. At the end of March the seasonally adjusted estimate of new homes for sale was 407k. This represents a supply of 6.4 months at the current sales rate.
Next week we get data on New Residential Sales, Durable Goods, the 2nd Estimate of 1st Quarter GDP, and Personal Income.
Data Sources:
Bureau of Economic Analysis (BEA)
Congressional Budget Office (CBO)
U.S. Bureau of Labor Statistics (BLS)
Federal Reserve Economic Data (FRED Charts)
CME Fed Watch
U.S. Treasury – Yields
U.S. Census Bureau
Institute for Supply Management (ISM)
Weekly DOL Employment Data
BLS Monthly Jobs Report
JOLTS
US Energy Admin (EIA)
BLS Consumer Price Index CPI
BLS Producer Price Index PPI
Atlanta Fed GDPNOW
NY Fed Nowcast GDP
US Census Bureau Housing Starts
Consumer Credit
USCB Retail Sales
Construction Spending
Federal Reserve Dot Plots
NY Empire Index
Philadelphia Federal Reserve
P/E Ratio Data -Yardeni Research
Technical Analysis Info:
StockCharts.com – Financial Charts
Exponential vs Simple moving average
Other Links:
1973 Arab Oil Embargo
Hunt Brothers Silver
Long-Term Capital bailout


Week 20 Talking Points
Table of Contents
Good Life Advisors – Talking Points – Week 20
Growth Stock Beatings Will Continue Until Valuation Morale Improves
The S&P 500 closed Friday down 18.66% since its all-time closing high on January 3rd (4796). This marked its seventh straight weekly decline, its longest since 2001. The Dow capped an eight-week losing streak for the first time since 1923. Value continued to be a relative out performer beating growth by 2.3% (-1.81 vs -4.13) for the week. This brings the year-to-date Value/Growth outperformance to over 17% (-9.22 vs -26.82). While there was no defining catalyst for the week, multiple bearish themes remained very much in the discussion. There was keen focus on the Fed marching on the path to tighter monetary policy as it seeks to tamp down inflation, with many questions about its ability to engineer the hoped-for “softish” landing for the economy. Inflationary pressures remained front and center, with this week’s earnings results from retailers suggesting consumers are shifting their spending away from higher-ticket items as food and fuel prices rise. China’s Covid lockdowns look to continue, along with their impacts on the supply chain and Chinese consumers, as Beijing continues to follow its zero-Covid strategy. The war in Ukraine, while not a top-tier concern, still represents a large cloud of uncertainty. And there remain significant doubts whether the market has seen enough capitulation.
But amid the ramping recession calls and multiple analysts this week taking down 2022 GDP or S&P estimates, markets were still clinging to a few hopeful threads. While personal consumption may be shifting, the overall volume remains robust. April CPI data was underwhelming, but we may still be past peak inflation. Equity outflows have been picking up but remain minimal compared to the past 18 months of inflows. China has pledged support for its economy, and aid to date is running behind 2020’s pace. In the 12 recessions since WWII, the S&P has seen a median contraction of ~24%, suggesting much of the pain could already be priced in. There are also some contrarian buy signals in evidence, particularly a raft of indicators for depressed sentiment and positioning (BofA’s fund manager survey found portfolio cash levels at their highest since 9/11). However, all of these have been cited as possible factors behind every bounce attempt in recent weeks, none of which gained any traction.
Consumer staples trailed amid broadly weaker performance, with WMT’s (19.5%) disappointing Q1 report a key focus. Retailers were the weak spot in consumer discretionary, facing a lot of scrutiny following a big earnings miss at TGT (29.3%)/ The megacaps were down in tech, with the hardware and semis spaces largely lower. Road/rale makes lagged in industrials, though airlines had a good week. Communication services was largely in line, helped by entertainment and telecom but seeing GOOGL (6.2%) and FB (2.6%) lower. Financials beat the tape, helped by asset managers and a smattering of gainers in insurance and banks, Industrial metals (particularly copper/ aluminum firms), commodity chemicals, and select fertilizer names cushioned materials. Pharma was the strongest subgroup in healthcare, though managed care and hospitals were mostly lower. Energy led the market, with integrateds, E&Ps, and oil-services names all having a good week.
Retailers were a key focus this week, with some weak reports raising questions about consumer spending and margins. WMT (19.5%) flagged higher supply chain costs, larger general merchandise markdowns, and higher wage costs. TGT (29.3%) similarly pointed to high costs and inventory impairments. In both cases, management noted elevated inventory issues (leading to some markdowns), with TGT pointing to a consumer shift away from higher-margin discretionary items amid rising food and fuel costs.
China continued to garner its share of the headlines, with the Covid situation still unsettled. Friday was three new cases emerge outside Shanghai’s surveillance zones (breaking a six-day streak), denting hopes restrictions might start to be lifted soon. Meanwhile, cases continued to rise in Beijing and elsewhere, with the central government showing no sign of moving away from its strict zero-Covid approach. But in a positive move, there was more policy support announced, with the PBoC Friday making a larger-than-expected cut to the 5Y loan prime rate. Analysts calculated China has now pumped in ~$5.3T in stimulus this year, below the 2020 benchmark (which could signal the possibility of more to come).
There was no real change to the Fed narrative this week despite comments from Chair Powell on Tuesday. Powell largely stick to the narrative that has prevailed among Fed speakers lately, that the bank is committed to bringing inflation down and that it expects 50bp hikes at the next two meetings to be appropriate. Powell also reiterated his view that the economy (particularly the labor market) is strong enough to bear some tightening as the Fed looks for a pathway to a “softish” landing.
Economic data this week was mixed. Headline April retail sales were largely in line, though control-group sales surprised to the upside. However there were unexpectedly big drops in the May regional manufacturing surveys released by the NY and Philadelphia Fed. Housing starts and existing-home sales both logged their third-straight monthly decline as mortgage rates and prices each continued to climb. Homebuilder sentiment posted a sharp monthly drop as well.
Fixed Income
Balance Sheet Reduction Plan Credit, Liquidity and Balance Sheet Federal Reserve Dot Plots
US Corporate Debt Tops 7 Trillion. Treasury.gov yields FOMC Policy Normalization Statement Longer Run Goals August 2020
Foreign Exchange Market
Energy Complex
The Baker Hughes rig count gained 14 this week. There are 728 oil and gas rigs operating in the US – Up 273 over last year.
Metals Complex
Employment Picture
Weekly Unemployment Claims – Released Thursday 5/19/2022 – THe week ending May 14th observed an increase of 21k in initial claims increasing to 218k. The four-week moving average on initial jobless claims increased 8.25k to 199.5k.
April Jobs Report – BLS Summary Released 5/6/2022 – The US Economy added 428k nonfarm jobs in April and the Unemployment rate stayed unchanged at 3.6%. Average hourly earnings increased 10 to $31.85. Hiring highlights include +78k Leisure and Hospitality, +59k Education and Health Services, and +55k Manufacturing.
Job Openings & Labor Turnover Survey – JOLTS – Released 5/3/2022 – The US Bureau of Labor Statistics reported the number and rate of job openings increased to 11.5 million on the last business day of March. Over the month, hires were little changed at 6.7 million and separations increased to 6.3 million. Within separations, quits increased to 4.5 million. The layoffs and discharges rates were little changed at 1.4 million.
Employment Cost Index – Released 4/29/2022 – Compensation costs for civilian workers increased 1.4% for the 3-month period ending in March 2022. The 12-month period ending in March 2022 saw compensation costs increased by 4.5%. The 12-month period ending in March 2021 increased 2.6%. Wages and salaries increased 4.7% over the year and increased 2.7% for the 12-month period ending in March 2021. Benefit costs increased 4.1% over the year and increased 2.5% for the 12-month period ending in March 2021. This report is published quarterly.
This Week’s Economic Data
Links take you to the data source
Existing Home Sales – Released 5/19/2022 – Existing home sales decreased in April marking three consecutive months of declines. Sales declined 2.4% to a seasonally adjusted rate of 5.61 million in April. Sales decreased 5.9% year-over-year. Housing inventory sits at 1.03 million units, up 10.8% from March’s inventory and down 10.4% over last year. Unsold inventory sits at a 2.2 month supply. The median existing home price for all housing types was $391,200 which is up 14.8% from April 2021. This marks 1122 consecutive months of year-over-year increased, the longest-running streak on record.
Housing Starts – Released 5/18/2022 – New home starts in April were at a seasonally adjusted annual rate of 1.724 million; down 0.2% below March, but 14.6% above last April’s rate. Building permits were at a seasonally adjusted annual rate of 1.819 million, down 3.2% compared to March, but up 3.1% over last year.
Industrial Production and Capacity Utilization – Released 5/17/2022 – In April, Industrial production increased 1.1%. Manufacturing increased 0.8%. Utilities output increased 2.4%. Mining output increased 1.6%. Total industrial production was 6.4% higher in April than a year ago. Total capacity utilization increased 0.7% to 79% in April, which is 0.5% below its long run average.
Retail Sales – Released 5/17/2022 – US retail sales for April increased 0.9% to $677.7 billion and retail sales are 8.2% above April 2021. US retail sales for the February 2022 through April 2022 period were up 10.8% for the same period a year ago.
Recent Economic Data
Links take you to the data source
Producer Price Index – Released 5/12/2022– The Producer Price Index for final demand increased 0.5% in April. PPI less food and energy increased 1%. The change in PPI for final demand has increased 11% year/y.
Consumer Price Index – Released 5/11/2022– Consumer prices rose 0.3% m/m in April following a 1.25 increase in March. Consumer prices are up 8.3% for the 12-month period ending in April. Core consumer prices increased 0.6% m/m in April following a 0.3% gain in March.
Consumer Credit – Released 5/6/2022 – Consumer credit increased at a seasonally adjusted annual rate of 9.7% in the first quarter of 2022. Revolving credit increased at an annual rate of 21.4%, while nonrevolving credit increased at an annual rate of 6.1%.
U.S. Trade Balance – Released 5/4/2022 – According to the US Census Bureau of Economic Analysis, the goods and services deficit increased in March by $20 billion to $109.8 billion. March exports were $241.7 billion, $12.9 billion more than February exports. March imports were $351.5 billion, $32.9 billion more than February imports. Year to date, the goods and services deficit increased $84.8 billion, or 41.5%, from the same period in 2021. Exports increased $104.5 billion or 17.7%. Imports increased $189.3 billion or 23.8%.
PMI Non-Manufacturing Index – Released 5/4/2022 – Economic activity in the non-manufacturing sector grew in April for the 23rd consecutive month. ISM Non-Manufacturing registered 57.1%, which is 1.2 percentage points below the March reading of 58.3%.
PMI Manufacturing Index – Released 5/2/2022 – April PMI decreased 1.7% to 55.4% down from March’s reading of 57.1%. The New Orders Index was 53.5% down 0.3% from March’s reading of 53.8%. The Production Index registered 53.6%, down 0.9%.
U.S. Construction Spending – Released 5/2/2022 – Construction spending increased 0.1% in March measuring at a seasonally adjusted annual rate of $1,730.5 billion. The March figure is 11.7% above the March 2021 estimate. Private construction spending was 0.2% above the revised February estimate at $1,376.9 billion. Public construction spending was 0.2% below the revised February estimate at $350.8 billion.
US Light Vehicle Sales – Released 4/29/2022 – US light vehicle sales were at a seasonally adjusted annual rate (SAAR) of 13.365 million units in March.
Chicago PMI – Released 4/29/2022 – Chicago PMI decreased by 6.5 points in April to 56.4. All five of the main five indicators decreased.
Personal Income – Released 4/29/2022 – Personal income increased $107.2 billion or 0.5% on March according to estimates released today by the Bureau of Economic Analysis. Disposable Personal Income (DPI) increased $89.7 billion or 0.5% and Personal Consumption Expenditures (PCE) increased $185 billion or 1.1%.
Advance Estimate of 1st Quarter 2022 GDP – Released 4/28/2022 – Real Gross Domestic Product (GDP) decreased at an annual rate of 1.4% in the first quarter of 2022, according to the advance estimate released by the Bureau of Economic Analysis. GDP increased 6.9% in the fourth quarter of 2021. The GDP advance estimate is based on data that are incomplete or subject to further revision. The decrease in real GDP reflected decreases in private inventory investment, exports, federal government spending, and state and local government spending, while imports, which are a subtraction in the calculation of GDP, increased. Personal Consumption Expenditures (PCE), nonresidential fixed investment, and residential fixed investment increased.
Consumer Confidence – Released 4/26/2022 – The Consumer Confidence Index saw a slight decline in April following an increase in March. The Index now stands at 107.3, down from 107.6 in March.
Durable Goods – Released 4/26/2022 – New orders for manufactured durable goods in March increased $2.3 billion or 0.8% to $275 billion. Computer and electronic products led the increase rising $0.7 billion or 2.6% to $26.3 billion.
New Residential Sales – Released 4/26/2022 – Sales of new single-family homes decreased 8.6% to 763k, seasonally adjusted, in March. The median sales price of new homes sold in February was $436,700 with an average sales price of $523,900. At the end of March the seasonally adjusted estimate of new homes for sale was 407k. This represents a supply of 6.4 months at the current sales rate.
Next week we get data on New Residential Sales, Durable Goods, the 2nd Estimate of 1st Quarter GDP, and Personal Income.
Data Sources:
Bureau of Economic Analysis (BEA)
Congressional Budget Office (CBO)
U.S. Bureau of Labor Statistics (BLS)
Federal Reserve Economic Data (FRED Charts)
CME Fed Watch
U.S. Treasury – Yields
U.S. Census Bureau
Institute for Supply Management (ISM)
Weekly DOL Employment Data
BLS Monthly Jobs Report
JOLTS
US Energy Admin (EIA)
BLS Consumer Price Index CPI
BLS Producer Price Index PPI
Atlanta Fed GDPNOW
NY Fed Nowcast GDP
US Census Bureau Housing Starts
Consumer Credit
USCB Retail Sales
Construction Spending
Federal Reserve Dot Plots
NY Empire Index
Philadelphia Federal Reserve
P/E Ratio Data -Yardeni Research
Technical Analysis Info:
StockCharts.com – Financial Charts
Exponential vs Simple moving average
Other Links:
1973 Arab Oil Embargo
Hunt Brothers Silver
Long-Term Capital bailout
Categories:
Tags: