Good Life Advisors Talking Points – Week 19
Please Join us Thursday
The WAM team will be hosting an investment call this Thursday, May 19th at 1pm EST to discuss the macro factors leading up to this recent market shift, our expectations for the capital markets, the changes have been made in the models and client talking points.
You need not be a WAM user to join the call.
If you haven’t already, please register below.
https://www.eventbrite.com/e/339354507467
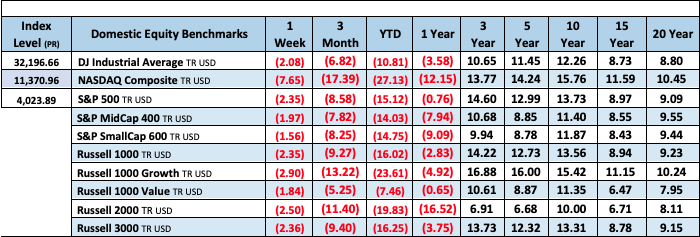
S&P 500 Closed Down for Sixth-Straight Week
US equities were lower this week. Consumer staples was the only sector higher while growth underperformed vs value for a sixth-straight week. Pressure from higher rates, recession fears, and a shift to quality have been among the factors to hit high-valuation and speculative groups. During the midweek selloff, the S&P 500 hit the lowest point since Mar-21. A Friday rebound pulled stocks off their mid-week lows, but weakening sentiment meant the S&P still finished down for a sixth-straight week, the first such streak since 2011.
This bearish case for equities was little changed this week, with a focus around Fed-led global monetary tightening, more-persistent inflation than expected, China Covid lockdowns, geopolitics, global growth slowdown and recession fears, and extended valuations. Some analysts also noted that there still hasn’t been enough capitulation for a meaningful bounce attempt. Bloomberg noted Bank of America’s latest Flow Show showed a weekly $6.9B outflow from global equities, though US equities saw inflows of $93M, the first in five weeks. The BofA team warned that stocks may still see bear market rallies and that there is still room to fall, arguing that the definition of true capitulation is investors selling what they love (the report called out Apple, which is still holding well above its 100- and 200- week moving averages). CNBC and WSJ also highlighted retail investors still buying the dip in the latest selloff. JPMorgan also noted that aggregate positioning is low, though there is still room to decline to match prior extremes in 2016, 2018, and 2020.
This week’s April core CPI print came in hotter than expected while Fed Chair Powell said that he supports 50 bp hikes over the next couple of meetings, though also said it will be quite challenging to pull off a soft landing. Futures are pricing in a fed funds rate of 2.63% by year-end, down from ~2.75% at the end of last week as a number of Fed officials played down 75 bp rate hikes. Despite the CPI report, there was more focus on the peak-inflation narrative this week, including factors such as peak-Fed and shrinking Fed balance sheet, growth in labor supply, shrinking federal deficits, and still-anchored inflation expectations. However, there were some concerns around upward inflationary pressure from factors including labor markets and strong household balance sheets.

Fixed Income
Balance Sheet Reduction Plan Credit, Liquidity and Balance Sheet Federal Reserve Dot Plots
US Corporate Debt Tops 7 Trillion. Treasury.gov yields FOMC Policy Normalization Statement Longer Run Goals August 2020
Foreign Exchange Market
Energy Complex
The Baker Hughes rig count gained 9 this week. These are 714 oil and gas rigs operating in the US – Up 261 over last year.
Metals Complex
Employment Picture
Weekly Unemployment Claims – Released Thursday 5/12/2022 – The week ending May 7th observed an increase of 1k in initial claims increasing to 203k. The four-week moving average of initial jobless claims increased 4.25k to 192.75k.
April Jobs Report – BLS Summary – Released 5/6/2022 – The US Economy added 428k nonfarm jobs in April and the Unemployment rate stayed unchanged at 3.6%. Average hourly earnings increased 10 to $31.85. Hiring highlights include +78k Leisure and Hospitality, +59k Education and Health Services, and +55k Manufacturing.
- Average hourly earnings increased 10 cents to $31.85.
- U3 unemployment rate remained unchanged at 3.6%. U6 unemployment rate slightly increased from 6.9% to 7%.
- The labor force participation rate was little changes at 62.2%.
- Average work week was unchanged at 34.6 hours.
Job Openings & Labor Turnover Survey – JOLTS – Released 5/3/2022 – The US Bureau of Labor Statistics reported the number and rate of job openings increased to 11.5 million on the last business day of March. Over the month, hires were little changed at 6.7 million and separations increased to 6.3 million. Within separations, quits increased to 4.5 million. The layoffs and discharges rates were little changed at 1.4 million.
Employment Cost Index – Released 4/29/2022 – Compensation costs for civilian workers increased 1.4% for the 3-month period ending in March 2022. The 12-month period ending in March 2022 saw compensation costs increase by 4.5%. The 12-month period ending in March 2021 increased 2.6%. Wages and salaries increased 4.7% over the year and increased 2.7% for the 12-month period ending in March 2021. This report is published quarterly.
This Week’s Economic Data
Links take you to the data source
Producer Price Index – Released 5/12/2022 – The Producer Price Index for final demand increased 0.5% in April. PPI less food and energy increased 1%. The change in PPI for final demand has increased 11% year/y.
Consumer Price Index – Released 5/11/2022– Consumer prices rose 0.3% m/m in April following a 1.2% increase in March. Consumer prices are up 8.3% for the 12-month period ending in April. Core consumer prices increased 0.6% m/m in April following a 0.3% gain in March.
Recent Economic Data
Links take you to the data source
Consumer Credit – Released 5/6/2022 – Consumer credit increased at a seasonally adjusted annual rate of 9.7% in the first quarter of 2022. Revolving credit increased at an annual rate of 21.4%, while nonrevolving credit increased at an annual rate of 6.1%.
U.S. Trade Balance – Released 5/4/2022 – According to the US Census Bureau of Economic Analysis, the goods and services deficit increased in March by $20 billion to $109.8 billion. March exports were $241.7 billion, $12.9 billion more than February exports. March imports were $351.5 billion, $32.9 billion more than February imports. Year to date, the goods and services deficit increased $84.8 billion, or 41.5%, from the same period in 2021. Exports increased $104.5 billion or 17.7$. Imports increased $189.3 billion or 23.8%.
PMI Non-Manufacturing Index – Released 5/4/2022 – Economic activity in the non-manufacturing sector grew in April for the 23rd consecutive month. ISM Non-Manufacturing registered 57.1%, which in 1.2 percentage points below the March reading of 58.3%.
PMI Manufacturing Index – Released 5/2/2022 – April PMI decreased 1.7% to 55.4% down from March’s reading of 57.1%. The New Orders Index was 53.5% down 0.3% from March’s reading of 53.8%. The Production Index registered 53.6% down 0.9%.
U.S. Construction Spending – Released 5/2/2022 – Construction spending increased 0.1% in March, measuring at a seasonally adjusted annual rate of $1,730.5 billion. The March figure is 11.7% above the March 2021 estimate. Private construction spending was 0.2% above the revised February estimate at $1,376.9 billion. Public construction spending was 0.2% below the revised February estimate at $350.8 billion.
US Light Vehicle Sales – Released 4/29/2022 – US light vehicle sales were at a Seasonally Adjusted Annual Rate (SAAR) of 13.365 million units in March.
Chicago PMI – Released 4/29/2022 – Chicago PMI decreased by 6.5 points in April to 56.4. All five of the main five indicators decreased.
Personal Income – Released 4/29/2022 – Personal income increased $107.2 billion or 0.5 percent in March according to estimates released today by the Bureau of Economic Analysis.Disposable Personal Income (DPI) increased $89.7 billion or 0.5% and Personal Consumption Expenditures (PCE) increased $185 billion or 1.1%.
Advance Estimate of 1st Quarter 2022 GDP – Released 4/28/2022 – Real Gross Domestic Product (GDP) decreased at an annual rate of 1.4% in the first quarter of 2022, according to the advance estimate released by the Bureau of Economic Analysis. GDP increased 6.9% in the fourth quarter of 2021. The GDP advance estimate is based on data that are incomplete or subject to further revision. The decrease in real GDP reflected decreases in private inventory investment, exports, federal government spending, and state and local government spending, while imports, which are a subtraction in the calculation of GDP, increased. Personal Consumption Expenditures (PCE), nonresidential fixed investment, and residential fixed investment increased.
Consumer Confidence – Released 4/26/2022– The Consumer Confidence Index saw a slight decline in April following an increase in March. The index now stands at 107.3, down from 107.6 in March.
Durable Goods – Released 4/26/2022 – New orders for manufactured durable goods in March increased $2.3 billion or 0.8% to $275 billion. COmputer and electronic products led the increase rising $0.7 billion or 2.6% to $26.3 billion.
New Residential Sales – Released 4/26/2022 – Sales of new single-family homes decreased 8.6% to 763k, seasonally adjusted, in March. The median sales price of new homes sold in February was $436,700, with an average sales price of $523,900. At the end of March, the seasonally adjusted estimate of new homes for sale was 407k. This represents a supply of 6.4 months at the current sales rate.
Existing Home Sales – Released 4/20/2022 – Existing homes sales decreased in March following a decrease in February. Sales declined 2.7% to a seasonally adjusted rate of 5.77 million in March. Sales decreased 4.5% year-over-year. Housing inventory sits at 950k units, up 11.8% from February’s inventory and down 9.5% over last year. Unsold inventory sits at a 1.7-month supply. The median existing home price for all housing types was $375,300, which is up 15% from March 2021. This marks 121 consecutive months of year-over-years increased, the longest running streak on record.
Housing Starts – Released 4/19/2022 – New home starts in March were at a seasonally adjusted annual rate of 1.793 million; up 0.3% above February, and 3.9% above last March’s rate. Building permits were at a seasonally adjusted annual rate of 1.865 million, up 0.4% compared to February, but up 6.7% over last year.
Industrial Production and Capacity Utilization – Released 4/15/2022 – In March, Industrial production increased 0.9%. Manufacturing increased 0.9%. Utilities output increased 0.4%. Mining output increased 1.7%. Total industrial production was 5.5% higher in March than a year ago. Total capacity utilization increased 0.7% to 78.3% in March which is 1.2% below its long run average.
Retail Sales – Released 4/14/2022 – US retail sales for March increased 0.5% to $665.7 billion and retail sales are 6.9% above March 2021. US retail sales for the January 2022 through March 2022 period were up 12.9% from the same period a year ago.
Next week we get data on Retail Sales, Industrial Production and Capacity Utilization, Housing Starts and Existing Home Sales.
Data Sources:
Bureau of Economic Analysis (BEA)
Congressional Budget Office (CBO)
U.S. Bureau of Labor Statistics (BLS)
Federal Reserve Economic Data (FRED Charts)
CME Fed Watch
U.S. Treasury – Yields
U.S. Census Bureau
Institute for Supply Management (ISM)
Weekly DOL Employment Data
BLS Monthly Jobs Report
JOLTS
US Energy Admin (EIA)
BLS Consumer Price Index CPI
BLS Producer Price Index PPI
Atlanta Fed GDPNOW
NY Fed Nowcast GDP
US Census Bureau Housing Starts
Consumer Credit
USCB Retail Sales
Construction Spending
Federal Reserve Dot Plots
NY Empire Index
Philadelphia Federal Reserve
P/E Ratio Data -Yardeni Research
Technical Analysis Info:
StockCharts.com – Financial Charts
Exponential vs Simple moving average
Other Links:
1973 Arab Oil Embargo
Hunt Brothers Silver
Long-Term Capital bailout


Week 19 Talking Points
Good Life Advisors Talking Points – Week 19
Please Join us Thursday
The WAM team will be hosting an investment call this Thursday, May 19th at 1pm EST to discuss the macro factors leading up to this recent market shift, our expectations for the capital markets, the changes have been made in the models and client talking points.
You need not be a WAM user to join the call.
If you haven’t already, please register below.
https://www.eventbrite.com/e/339354507467
S&P 500 Closed Down for Sixth-Straight Week
US equities were lower this week. Consumer staples was the only sector higher while growth underperformed vs value for a sixth-straight week. Pressure from higher rates, recession fears, and a shift to quality have been among the factors to hit high-valuation and speculative groups. During the midweek selloff, the S&P 500 hit the lowest point since Mar-21. A Friday rebound pulled stocks off their mid-week lows, but weakening sentiment meant the S&P still finished down for a sixth-straight week, the first such streak since 2011.
This bearish case for equities was little changed this week, with a focus around Fed-led global monetary tightening, more-persistent inflation than expected, China Covid lockdowns, geopolitics, global growth slowdown and recession fears, and extended valuations. Some analysts also noted that there still hasn’t been enough capitulation for a meaningful bounce attempt. Bloomberg noted Bank of America’s latest Flow Show showed a weekly $6.9B outflow from global equities, though US equities saw inflows of $93M, the first in five weeks. The BofA team warned that stocks may still see bear market rallies and that there is still room to fall, arguing that the definition of true capitulation is investors selling what they love (the report called out Apple, which is still holding well above its 100- and 200- week moving averages). CNBC and WSJ also highlighted retail investors still buying the dip in the latest selloff. JPMorgan also noted that aggregate positioning is low, though there is still room to decline to match prior extremes in 2016, 2018, and 2020.
This week’s April core CPI print came in hotter than expected while Fed Chair Powell said that he supports 50 bp hikes over the next couple of meetings, though also said it will be quite challenging to pull off a soft landing. Futures are pricing in a fed funds rate of 2.63% by year-end, down from ~2.75% at the end of last week as a number of Fed officials played down 75 bp rate hikes. Despite the CPI report, there was more focus on the peak-inflation narrative this week, including factors such as peak-Fed and shrinking Fed balance sheet, growth in labor supply, shrinking federal deficits, and still-anchored inflation expectations. However, there were some concerns around upward inflationary pressure from factors including labor markets and strong household balance sheets.
Table of Contents
Fixed Income
Balance Sheet Reduction Plan Credit, Liquidity and Balance Sheet Federal Reserve Dot Plots
US Corporate Debt Tops 7 Trillion. Treasury.gov yields FOMC Policy Normalization Statement Longer Run Goals August 2020
Foreign Exchange Market
Energy Complex
The Baker Hughes rig count gained 9 this week. These are 714 oil and gas rigs operating in the US – Up 261 over last year.
Metals Complex
Employment Picture
Weekly Unemployment Claims – Released Thursday 5/12/2022 – The week ending May 7th observed an increase of 1k in initial claims increasing to 203k. The four-week moving average of initial jobless claims increased 4.25k to 192.75k.
April Jobs Report – BLS Summary – Released 5/6/2022 – The US Economy added 428k nonfarm jobs in April and the Unemployment rate stayed unchanged at 3.6%. Average hourly earnings increased 10 to $31.85. Hiring highlights include +78k Leisure and Hospitality, +59k Education and Health Services, and +55k Manufacturing.
Job Openings & Labor Turnover Survey – JOLTS – Released 5/3/2022 – The US Bureau of Labor Statistics reported the number and rate of job openings increased to 11.5 million on the last business day of March. Over the month, hires were little changed at 6.7 million and separations increased to 6.3 million. Within separations, quits increased to 4.5 million. The layoffs and discharges rates were little changed at 1.4 million.
Employment Cost Index – Released 4/29/2022 – Compensation costs for civilian workers increased 1.4% for the 3-month period ending in March 2022. The 12-month period ending in March 2022 saw compensation costs increase by 4.5%. The 12-month period ending in March 2021 increased 2.6%. Wages and salaries increased 4.7% over the year and increased 2.7% for the 12-month period ending in March 2021. This report is published quarterly.
This Week’s Economic Data
Links take you to the data source
Producer Price Index – Released 5/12/2022 – The Producer Price Index for final demand increased 0.5% in April. PPI less food and energy increased 1%. The change in PPI for final demand has increased 11% year/y.
Consumer Price Index – Released 5/11/2022– Consumer prices rose 0.3% m/m in April following a 1.2% increase in March. Consumer prices are up 8.3% for the 12-month period ending in April. Core consumer prices increased 0.6% m/m in April following a 0.3% gain in March.
Recent Economic Data
Links take you to the data source
Consumer Credit – Released 5/6/2022 – Consumer credit increased at a seasonally adjusted annual rate of 9.7% in the first quarter of 2022. Revolving credit increased at an annual rate of 21.4%, while nonrevolving credit increased at an annual rate of 6.1%.
U.S. Trade Balance – Released 5/4/2022 – According to the US Census Bureau of Economic Analysis, the goods and services deficit increased in March by $20 billion to $109.8 billion. March exports were $241.7 billion, $12.9 billion more than February exports. March imports were $351.5 billion, $32.9 billion more than February imports. Year to date, the goods and services deficit increased $84.8 billion, or 41.5%, from the same period in 2021. Exports increased $104.5 billion or 17.7$. Imports increased $189.3 billion or 23.8%.
PMI Non-Manufacturing Index – Released 5/4/2022 – Economic activity in the non-manufacturing sector grew in April for the 23rd consecutive month. ISM Non-Manufacturing registered 57.1%, which in 1.2 percentage points below the March reading of 58.3%.
PMI Manufacturing Index – Released 5/2/2022 – April PMI decreased 1.7% to 55.4% down from March’s reading of 57.1%. The New Orders Index was 53.5% down 0.3% from March’s reading of 53.8%. The Production Index registered 53.6% down 0.9%.
U.S. Construction Spending – Released 5/2/2022 – Construction spending increased 0.1% in March, measuring at a seasonally adjusted annual rate of $1,730.5 billion. The March figure is 11.7% above the March 2021 estimate. Private construction spending was 0.2% above the revised February estimate at $1,376.9 billion. Public construction spending was 0.2% below the revised February estimate at $350.8 billion.
US Light Vehicle Sales – Released 4/29/2022 – US light vehicle sales were at a Seasonally Adjusted Annual Rate (SAAR) of 13.365 million units in March.
Chicago PMI – Released 4/29/2022 – Chicago PMI decreased by 6.5 points in April to 56.4. All five of the main five indicators decreased.
Personal Income – Released 4/29/2022 – Personal income increased $107.2 billion or 0.5 percent in March according to estimates released today by the Bureau of Economic Analysis.Disposable Personal Income (DPI) increased $89.7 billion or 0.5% and Personal Consumption Expenditures (PCE) increased $185 billion or 1.1%.
Advance Estimate of 1st Quarter 2022 GDP – Released 4/28/2022 – Real Gross Domestic Product (GDP) decreased at an annual rate of 1.4% in the first quarter of 2022, according to the advance estimate released by the Bureau of Economic Analysis. GDP increased 6.9% in the fourth quarter of 2021. The GDP advance estimate is based on data that are incomplete or subject to further revision. The decrease in real GDP reflected decreases in private inventory investment, exports, federal government spending, and state and local government spending, while imports, which are a subtraction in the calculation of GDP, increased. Personal Consumption Expenditures (PCE), nonresidential fixed investment, and residential fixed investment increased.
Consumer Confidence – Released 4/26/2022– The Consumer Confidence Index saw a slight decline in April following an increase in March. The index now stands at 107.3, down from 107.6 in March.
Durable Goods – Released 4/26/2022 – New orders for manufactured durable goods in March increased $2.3 billion or 0.8% to $275 billion. COmputer and electronic products led the increase rising $0.7 billion or 2.6% to $26.3 billion.
New Residential Sales – Released 4/26/2022 – Sales of new single-family homes decreased 8.6% to 763k, seasonally adjusted, in March. The median sales price of new homes sold in February was $436,700, with an average sales price of $523,900. At the end of March, the seasonally adjusted estimate of new homes for sale was 407k. This represents a supply of 6.4 months at the current sales rate.
Existing Home Sales – Released 4/20/2022 – Existing homes sales decreased in March following a decrease in February. Sales declined 2.7% to a seasonally adjusted rate of 5.77 million in March. Sales decreased 4.5% year-over-year. Housing inventory sits at 950k units, up 11.8% from February’s inventory and down 9.5% over last year. Unsold inventory sits at a 1.7-month supply. The median existing home price for all housing types was $375,300, which is up 15% from March 2021. This marks 121 consecutive months of year-over-years increased, the longest running streak on record.
Housing Starts – Released 4/19/2022 – New home starts in March were at a seasonally adjusted annual rate of 1.793 million; up 0.3% above February, and 3.9% above last March’s rate. Building permits were at a seasonally adjusted annual rate of 1.865 million, up 0.4% compared to February, but up 6.7% over last year.
Industrial Production and Capacity Utilization – Released 4/15/2022 – In March, Industrial production increased 0.9%. Manufacturing increased 0.9%. Utilities output increased 0.4%. Mining output increased 1.7%. Total industrial production was 5.5% higher in March than a year ago. Total capacity utilization increased 0.7% to 78.3% in March which is 1.2% below its long run average.
Retail Sales – Released 4/14/2022 – US retail sales for March increased 0.5% to $665.7 billion and retail sales are 6.9% above March 2021. US retail sales for the January 2022 through March 2022 period were up 12.9% from the same period a year ago.
Next week we get data on Retail Sales, Industrial Production and Capacity Utilization, Housing Starts and Existing Home Sales.
Data Sources:
Bureau of Economic Analysis (BEA)
Congressional Budget Office (CBO)
U.S. Bureau of Labor Statistics (BLS)
Federal Reserve Economic Data (FRED Charts)
CME Fed Watch
U.S. Treasury – Yields
U.S. Census Bureau
Institute for Supply Management (ISM)
Weekly DOL Employment Data
BLS Monthly Jobs Report
JOLTS
US Energy Admin (EIA)
BLS Consumer Price Index CPI
BLS Producer Price Index PPI
Atlanta Fed GDPNOW
NY Fed Nowcast GDP
US Census Bureau Housing Starts
Consumer Credit
USCB Retail Sales
Construction Spending
Federal Reserve Dot Plots
NY Empire Index
Philadelphia Federal Reserve
P/E Ratio Data -Yardeni Research
Technical Analysis Info:
StockCharts.com – Financial Charts
Exponential vs Simple moving average
Other Links:
1973 Arab Oil Embargo
Hunt Brothers Silver
Long-Term Capital bailout
Categories:
Tags: