Good Life Advisors – Talking Points – Week 21
Can the fed engineer a soft landing?
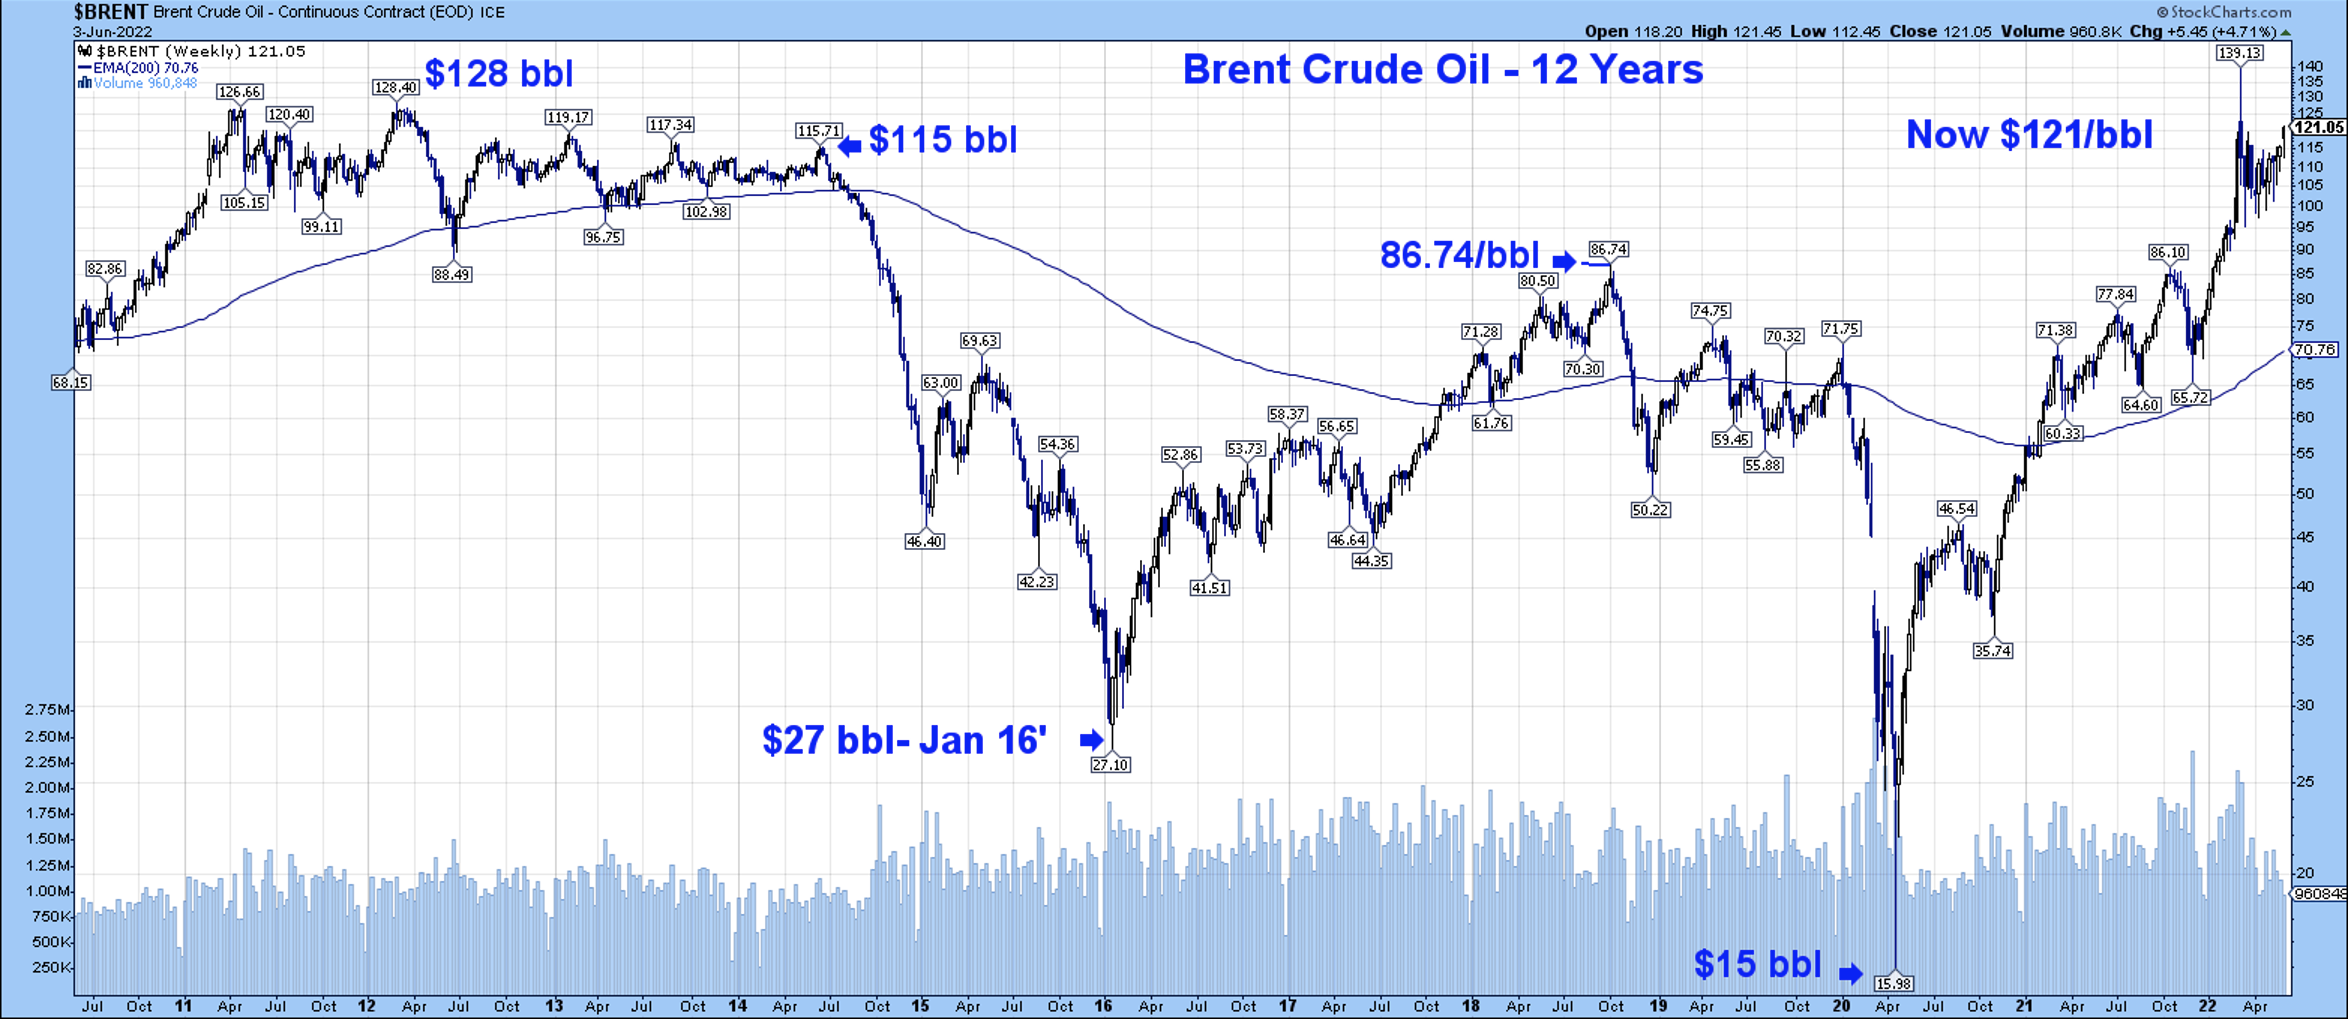
Uncertainty is gripping the markets, and no one is really sure what the fed is going to do or how the economy will react. We end this week with the unknowns. How far will the Fed need to go? Can they quell inflation without causing a deep recession? Oil is in play too- OPEC+ agreed to boost output by 648k bpd, however, the increase wasn’t enough to cover Russia’s shortfall and it settled higher for the week. Brent crude oil has found a home well over $100/bbl and looks content moving higher. Does this make a recession more likely?
Stocks were modestly lower for the week, reversing some of last week’s gains when the S&P 500 and Nasdaq both broke seven-straight weekly declines. Growth outperformed value, treasuries were weaker across the board with some curve flattening. The dollar was stronger, including a 3% gain on the Yen. Gold was down 0.1% for the week. WTI crude finished up 3.3% and at the highest level since 8-Mar.
This week saw a shift into “good news is bad news” mode, particularly after the better May payrolls and ISM manufacturing reports. The dynamic dented the “peak-Fed” narrative, and also came amid some pushback against the potential Fed rate hike pause in September this week. Inflation fears were somewhat reignited, particularly around oil prices and some hotter data this week. A couple of key corporate updates (Microsoft, Tesla, JPMorgan) also added to macro slowdown fears and consensus earnings risk. Morgan Stanley strategist Mike Wilson wrote this week that recent strength was another bear market rally, with the next leg of downside driven by a more hawkish Fed than expected and an expectation for lower Q2 preannouncements.
While the peak-Fed narrative has been a bit of a support for stocks recently, a number of Fed officials played down a potential September pause, including Fed Vice Chair Brainard, Cleveland President Mester, and Fed Governor Waller. Atlanta’s Bostic also said in a MarketWatch interview that his recent September “pause” comment shouldn’t be construed as a Fed put, though still said it may make sense for the Fed to take a breath and reassess its policy path at some point. Markets are now pricing in a 2.70% fed funds rate by December, up around 15 bp from a week ago.
This week’s Jobs report seemed to land in the sweet spot for the Fed, with an expanding labor supply easing upward pressure on wages. Friday’s payrolls report showed headlines payrolls up 390K, beating estimates for 323K, while average hourly earnings growth of 0.3% was in line with estimates, but down 0.1 pp m/m. Annualized earnings were down 0.3 pp to 5.2%, below 5.3% consensus.
Other data included ISM services which fell to the lowest since Feb-21, though prices dropped from last month’s record and the backlog of orders grew. ISM manufacturing beat with prices easing, though employment fell into contraction territory and lowest since Nov-20. May consumer confidence beat, though inflation was little changed from April and the labor market differential was the narrowest since May-21.

Fixed Income
Balance Sheet Reduction Plan Credit, Liquidity and Balance Sheet Federal Reserve Dot Plots
US Corporate Debt Tops 7 Trillion. Treasury.gov yields FOMC Policy Normalization Statement Longer Run Goals August 2020
Foreign Exchange Market
Energy Complex
The Baker Hughes rig count was flat this week. There are 727 oil and gas rigs operating in the US – Up 271 over last year.
Metals Complex
Employment Picture
May Jobs Report – BLS Summary – Released 6/3/2022 – The US Economy added 390k nonfarm jobs in May and the Unemployment rate stayed unchanged at 3.6%. Average hourly earnings increased 10 to $31.95. Hiring highlights include +84k Leisure and Hospitality, +74k Education and Health Services, and +75 Professional and Business Services.
- Average hourly earnings increased 10 cents to $31.95.
- U3 unemployment rate remained unchanged at 3.6%. U6 unemployment rate slightly increased from 7.0% to 7.1%.
- The labor force participation rate was little changed at 62.3%.
- Average work week was unchanged at 34.6 hours.
Weekly Unemployment Claims – Released Thursday 6/2/2022 – The week ending May 28th observed a decrease of 11k in initial claims decreasing to 200k. The four-week moving average of initial jobless claims decreased 500 to 206.5k.
Job Openings & Labor Turnover Survey – JOLTS – Released 6/1/2022 – The U.S. Bureau of Labor Statistics reported the number and rate of job openings decreased to 11.4 million on the last business day of April. Over the month, hires were little changed at 6.6 million and separations were little changed at 6.0 million. Within separations, quits were little changed at 4.4 million. The layoffs and discharges rates declined to 1.2 million.
Employment Cost Index – Released 4/29/2022 – Compensation costs for civilian workers increased 1.4% for the 3-month period ending in March 2022. The 12-month period ending in March 2022 saw compensation costs increase by 4.5%. The 12-month period ending March 2021 increased 2.6%. Wages and salaries increased 4.7 percent over the year and increased 2.7 percent for the 12-month period ending in March 2021. Benefit costs increased 4.1 percent over the year and increased 2.5 percent for the 12-month period ending in March 2021. This report is published quarterly.
This Week’s Economic Data
Links take you to the data source
PMI Non-Manufacturing Index – Released 6/3/2022 – Economic activity in the non-manufacturing sector grew in May for the 24th consecutive month. ISM Non-Manufacturing registered 55.9 percent, which is 1.2 percentage points below the April reading of 57.1 percent.
PMI Manufacturing Index – Released 6/1/2022 – May PMI increased 0.7% to 56.1% up from April’s reading of 55.4%. The New Orders Index was 55.1% up 1.6% from April’s reading of 53.5%. The Production Index registered 54.2%, up 0.6%.
U.S. Construction Spending – Released 6/1/2022 – Construction spending increased 0.2% in April measuring at a seasonally adjusted annual rate of $1,744.8 billion. The April figure is 12.3% above the April 2021 estimate. Private construction spending was 0.5% above the revised March estimate at $1,394.7 billion. Public construction spending was 0.7% below the revised March estimate at $350.1 billion.
Chicago PMI – Released 5/31/2022 – Chicago PMI increased by 3.9 points in May to 60.3. All five of the main five indicators increased except for supplier deliveries, which hit its lowest level since November 2020.
Consumer Confidence – Released 5/31/2022 – The Consumer confidence index saw a slight decrease in May following a slight increase in April. The Index now stands at 106.4, down from 108.6 in April.
Recent Economic Data
Links take you to the data source
US Light Vehicle Sales – Released 5/27/2022 – U.S. light vehicle sales were at a seasonally adjusted annual rate (SAAR) of 14.277 million units in April.
Personal Income – Released 5/27/2022 – Personal income increased $89.3 billion or 0.4 percent in April according to estimates released today by the Bureau of Economic Analysis. Disposable personal income (DPI) increased $48.3 billion or 0.3 percent and personal consumption expenditures (PCE) increased $152.3 billion or 0.9 percent.
Second Estimate of 1st Quarter 2022 GDP – Released 5/26/2022 – Real gross domestic product (GDP) decreased at an annual rate of 1.5 percent in the first quarter of 2022, according to the second estimate released by the Bureau of Economic Analysis. GDP increased 6.9 percent in the fourth quarter of 2021. The GDP second estimate is based on data that are more complete than the advance estimate which estimated that GDP declined 1.4 percent in the first quarter. The second estimate primarily reflects downward revisions to private inventory investment and residential investment that were partly offset by an upward revision to consumer spending. The decrease in real GDP reflected decreases in private inventory investment, exports, federal government spending, and state and local government spending, while imports, which are a subtraction in the calculation of GDP, increased. Personal consumption expenditures (PCE), nonresidential fixed investment, and residential fixed investment increased.
Durable Goods – Released 5/25/2022 – New orders for manufactured durable goods in April increased $1.2 billion or 0.4% to $265.3 billion. Transportation equipment led the increase up $0.6 billion or 0.6% to $86.7 billion.
New Residential Sales – Released 5/24/2022 – Sales of new single-family homes decreased 16.6% to 591k, seasonally adjusted, in April. The median sales price of new homes sold in April was $450,600 with an average sales price of $570,300. At the end of April, the seasonally adjusted estimate of new homes for sale was 444k. This represents a supply of 9.0 months at the current sales rate.
Existing Home Sales – Released 5/19/2022 – Existing home sales decreased in April marking three consecutive months of declines. Sales declined 2.4% to a seasonally adjusted rate of 5.61 million in April. Sales decreased 5.9% year-over-year. Housing inventory sits at 1.03 million units. Up 10.8% from March’s inventory. Down 10.4% over last year. Unsold inventory sits at a 2.2-month supply. The median existing home price for all housing types was $391,200 which is up 14.8% from April 2021. This marks 122 consecutive months of year-over-year increases, the longest-running streak on record.
Housing Starts – Released 5/18/2022 – New home starts in April were at a seasonally adjusted annual rate of 1.724 million; down 0.2% below March, but 14.6% above last April’s rate. Building Permits were at a seasonally adjusted annual rate of 1.819 million, down 3.2% compared to March, but up 3.1% over last year.
Industrial Production and Capacity Utilization – Released 5/17/2022 – In April Industrial production increased 1.1%. Manufacturing increased 0.8%. Utilities output increased 2.4%. Mining output increased 1.6%. Total industrial production was 6.4% higher in April than a year ago. Total capacity utilization increased 0.7% to 79.0% in April which is 0.5% below its long run average.
Retail Sales – Released 5/17/2022 – U.S. retail sales for April increased 0.9% to $677.7 billion and retail sales are 8.2% above April 2021. U.S. retail sales for the February 2022 through April 2022 period were up 10.8% from the same period a year ago.
Producer Price Index – Released 5/12/2022 – The Producer Price Index for final demand increased 0.5% in April. PPI less food and energy increased 1.0%. The change in PPI for final demand has increased 11.0% year/y.
Consumer Price Index – Released 5/11/2022 – Consumer prices rose 0.3% m/m in April following a 1.2% increase in March. Consumer prices are up 8.3% for the 12-month period ending in April. Core consumer prices increased 0.6% m/m in April following a 0.3% gain in March.
Consumer Credit – Released 5/6/2022 – Consumer credit increased at a seasonally adjusted annual rate of 9.7 percent in the first quarter of 2022. Revolving credit increased at an annual rate of 21.4 percent, while nonrevolving credit increased at an annual rate of 6.1 percent.
U.S. Trade Balance – Released 5/4/2022 – According to the U.S. Census Bureau of Economic Analysis the goods and services deficit increased in March by $20.0 billion to $109.8 billion. March exports were $241.7 billion, $12.9 billion more than February exports. March imports were $351.5 billion, $32.9 billion more than February imports. Year to date, the goods and services deficit increased $84.8 billion, or 41.5 percent, from the same period in 2021. Exports increased $104.5 billion or 17.7 percent. Imports increased $189.3 billion or 23.8 percent.
Next week we get data on the U.S. Trade Balance, Consumer Credit, and CPI.
Data Sources:
Bureau of Economic Analysis (BEA)
Congressional Budget Office (CBO)
U.S. Bureau of Labor Statistics (BLS)
Federal Reserve Economic Data (FRED Charts)
CME Fed Watch
U.S. Treasury – Yields
U.S. Census Bureau
Institute for Supply Management (ISM)
Weekly DOL Employment Data
BLS Monthly Jobs Report
JOLTS
US Energy Admin (EIA)
BLS Consumer Price Index CPI
BLS Producer Price Index PPI
Atlanta Fed GDPNOW
NY Fed Nowcast GDP
US Census Bureau Housing Starts
Consumer Credit
USCB Retail Sales
Construction Spending
Federal Reserve Dot Plots
NY Empire Index
Philadelphia Federal Reserve
P/E Ratio Data -Yardeni Research
Technical Analysis Info:
StockCharts.com – Financial Charts
Exponential vs Simple moving average
Other Links:
1973 Arab Oil Embargo
Hunt Brothers Silver
Long-Term Capital bailout


Week 21 Talking Points
Good Life Advisors – Talking Points – Week 21
Can the fed engineer a soft landing?
Uncertainty is gripping the markets, and no one is really sure what the fed is going to do or how the economy will react. We end this week with the unknowns. How far will the Fed need to go? Can they quell inflation without causing a deep recession? Oil is in play too- OPEC+ agreed to boost output by 648k bpd, however, the increase wasn’t enough to cover Russia’s shortfall and it settled higher for the week. Brent crude oil has found a home well over $100/bbl and looks content moving higher. Does this make a recession more likely?
Stocks were modestly lower for the week, reversing some of last week’s gains when the S&P 500 and Nasdaq both broke seven-straight weekly declines. Growth outperformed value, treasuries were weaker across the board with some curve flattening. The dollar was stronger, including a 3% gain on the Yen. Gold was down 0.1% for the week. WTI crude finished up 3.3% and at the highest level since 8-Mar.
This week saw a shift into “good news is bad news” mode, particularly after the better May payrolls and ISM manufacturing reports. The dynamic dented the “peak-Fed” narrative, and also came amid some pushback against the potential Fed rate hike pause in September this week. Inflation fears were somewhat reignited, particularly around oil prices and some hotter data this week. A couple of key corporate updates (Microsoft, Tesla, JPMorgan) also added to macro slowdown fears and consensus earnings risk. Morgan Stanley strategist Mike Wilson wrote this week that recent strength was another bear market rally, with the next leg of downside driven by a more hawkish Fed than expected and an expectation for lower Q2 preannouncements.
While the peak-Fed narrative has been a bit of a support for stocks recently, a number of Fed officials played down a potential September pause, including Fed Vice Chair Brainard, Cleveland President Mester, and Fed Governor Waller. Atlanta’s Bostic also said in a MarketWatch interview that his recent September “pause” comment shouldn’t be construed as a Fed put, though still said it may make sense for the Fed to take a breath and reassess its policy path at some point. Markets are now pricing in a 2.70% fed funds rate by December, up around 15 bp from a week ago.
This week’s Jobs report seemed to land in the sweet spot for the Fed, with an expanding labor supply easing upward pressure on wages. Friday’s payrolls report showed headlines payrolls up 390K, beating estimates for 323K, while average hourly earnings growth of 0.3% was in line with estimates, but down 0.1 pp m/m. Annualized earnings were down 0.3 pp to 5.2%, below 5.3% consensus.
Other data included ISM services which fell to the lowest since Feb-21, though prices dropped from last month’s record and the backlog of orders grew. ISM manufacturing beat with prices easing, though employment fell into contraction territory and lowest since Nov-20. May consumer confidence beat, though inflation was little changed from April and the labor market differential was the narrowest since May-21.
Table of Contents
Fixed Income
Balance Sheet Reduction Plan Credit, Liquidity and Balance Sheet Federal Reserve Dot Plots
US Corporate Debt Tops 7 Trillion. Treasury.gov yields FOMC Policy Normalization Statement Longer Run Goals August 2020
Foreign Exchange Market
Energy Complex
The Baker Hughes rig count was flat this week. There are 727 oil and gas rigs operating in the US – Up 271 over last year.
Metals Complex
Employment Picture
May Jobs Report – BLS Summary – Released 6/3/2022 – The US Economy added 390k nonfarm jobs in May and the Unemployment rate stayed unchanged at 3.6%. Average hourly earnings increased 10 to $31.95. Hiring highlights include +84k Leisure and Hospitality, +74k Education and Health Services, and +75 Professional and Business Services.
Weekly Unemployment Claims – Released Thursday 6/2/2022 – The week ending May 28th observed a decrease of 11k in initial claims decreasing to 200k. The four-week moving average of initial jobless claims decreased 500 to 206.5k.
Job Openings & Labor Turnover Survey – JOLTS – Released 6/1/2022 – The U.S. Bureau of Labor Statistics reported the number and rate of job openings decreased to 11.4 million on the last business day of April. Over the month, hires were little changed at 6.6 million and separations were little changed at 6.0 million. Within separations, quits were little changed at 4.4 million. The layoffs and discharges rates declined to 1.2 million.
Employment Cost Index – Released 4/29/2022 – Compensation costs for civilian workers increased 1.4% for the 3-month period ending in March 2022. The 12-month period ending in March 2022 saw compensation costs increase by 4.5%. The 12-month period ending March 2021 increased 2.6%. Wages and salaries increased 4.7 percent over the year and increased 2.7 percent for the 12-month period ending in March 2021. Benefit costs increased 4.1 percent over the year and increased 2.5 percent for the 12-month period ending in March 2021. This report is published quarterly.
This Week’s Economic Data
Links take you to the data source
PMI Non-Manufacturing Index – Released 6/3/2022 – Economic activity in the non-manufacturing sector grew in May for the 24th consecutive month. ISM Non-Manufacturing registered 55.9 percent, which is 1.2 percentage points below the April reading of 57.1 percent.
PMI Manufacturing Index – Released 6/1/2022 – May PMI increased 0.7% to 56.1% up from April’s reading of 55.4%. The New Orders Index was 55.1% up 1.6% from April’s reading of 53.5%. The Production Index registered 54.2%, up 0.6%.
U.S. Construction Spending – Released 6/1/2022 – Construction spending increased 0.2% in April measuring at a seasonally adjusted annual rate of $1,744.8 billion. The April figure is 12.3% above the April 2021 estimate. Private construction spending was 0.5% above the revised March estimate at $1,394.7 billion. Public construction spending was 0.7% below the revised March estimate at $350.1 billion.
Chicago PMI – Released 5/31/2022 – Chicago PMI increased by 3.9 points in May to 60.3. All five of the main five indicators increased except for supplier deliveries, which hit its lowest level since November 2020.
Consumer Confidence – Released 5/31/2022 – The Consumer confidence index saw a slight decrease in May following a slight increase in April. The Index now stands at 106.4, down from 108.6 in April.
Recent Economic Data
Links take you to the data source
US Light Vehicle Sales – Released 5/27/2022 – U.S. light vehicle sales were at a seasonally adjusted annual rate (SAAR) of 14.277 million units in April.
Personal Income – Released 5/27/2022 – Personal income increased $89.3 billion or 0.4 percent in April according to estimates released today by the Bureau of Economic Analysis. Disposable personal income (DPI) increased $48.3 billion or 0.3 percent and personal consumption expenditures (PCE) increased $152.3 billion or 0.9 percent.
Second Estimate of 1st Quarter 2022 GDP – Released 5/26/2022 – Real gross domestic product (GDP) decreased at an annual rate of 1.5 percent in the first quarter of 2022, according to the second estimate released by the Bureau of Economic Analysis. GDP increased 6.9 percent in the fourth quarter of 2021. The GDP second estimate is based on data that are more complete than the advance estimate which estimated that GDP declined 1.4 percent in the first quarter. The second estimate primarily reflects downward revisions to private inventory investment and residential investment that were partly offset by an upward revision to consumer spending. The decrease in real GDP reflected decreases in private inventory investment, exports, federal government spending, and state and local government spending, while imports, which are a subtraction in the calculation of GDP, increased. Personal consumption expenditures (PCE), nonresidential fixed investment, and residential fixed investment increased.
Durable Goods – Released 5/25/2022 – New orders for manufactured durable goods in April increased $1.2 billion or 0.4% to $265.3 billion. Transportation equipment led the increase up $0.6 billion or 0.6% to $86.7 billion.
New Residential Sales – Released 5/24/2022 – Sales of new single-family homes decreased 16.6% to 591k, seasonally adjusted, in April. The median sales price of new homes sold in April was $450,600 with an average sales price of $570,300. At the end of April, the seasonally adjusted estimate of new homes for sale was 444k. This represents a supply of 9.0 months at the current sales rate.
Existing Home Sales – Released 5/19/2022 – Existing home sales decreased in April marking three consecutive months of declines. Sales declined 2.4% to a seasonally adjusted rate of 5.61 million in April. Sales decreased 5.9% year-over-year. Housing inventory sits at 1.03 million units. Up 10.8% from March’s inventory. Down 10.4% over last year. Unsold inventory sits at a 2.2-month supply. The median existing home price for all housing types was $391,200 which is up 14.8% from April 2021. This marks 122 consecutive months of year-over-year increases, the longest-running streak on record.
Housing Starts – Released 5/18/2022 – New home starts in April were at a seasonally adjusted annual rate of 1.724 million; down 0.2% below March, but 14.6% above last April’s rate. Building Permits were at a seasonally adjusted annual rate of 1.819 million, down 3.2% compared to March, but up 3.1% over last year.
Industrial Production and Capacity Utilization – Released 5/17/2022 – In April Industrial production increased 1.1%. Manufacturing increased 0.8%. Utilities output increased 2.4%. Mining output increased 1.6%. Total industrial production was 6.4% higher in April than a year ago. Total capacity utilization increased 0.7% to 79.0% in April which is 0.5% below its long run average.
Retail Sales – Released 5/17/2022 – U.S. retail sales for April increased 0.9% to $677.7 billion and retail sales are 8.2% above April 2021. U.S. retail sales for the February 2022 through April 2022 period were up 10.8% from the same period a year ago.
Producer Price Index – Released 5/12/2022 – The Producer Price Index for final demand increased 0.5% in April. PPI less food and energy increased 1.0%. The change in PPI for final demand has increased 11.0% year/y.
Consumer Price Index – Released 5/11/2022 – Consumer prices rose 0.3% m/m in April following a 1.2% increase in March. Consumer prices are up 8.3% for the 12-month period ending in April. Core consumer prices increased 0.6% m/m in April following a 0.3% gain in March.
Consumer Credit – Released 5/6/2022 – Consumer credit increased at a seasonally adjusted annual rate of 9.7 percent in the first quarter of 2022. Revolving credit increased at an annual rate of 21.4 percent, while nonrevolving credit increased at an annual rate of 6.1 percent.
U.S. Trade Balance – Released 5/4/2022 – According to the U.S. Census Bureau of Economic Analysis the goods and services deficit increased in March by $20.0 billion to $109.8 billion. March exports were $241.7 billion, $12.9 billion more than February exports. March imports were $351.5 billion, $32.9 billion more than February imports. Year to date, the goods and services deficit increased $84.8 billion, or 41.5 percent, from the same period in 2021. Exports increased $104.5 billion or 17.7 percent. Imports increased $189.3 billion or 23.8 percent.
Next week we get data on the U.S. Trade Balance, Consumer Credit, and CPI.
Data Sources:
Bureau of Economic Analysis (BEA)
Congressional Budget Office (CBO)
U.S. Bureau of Labor Statistics (BLS)
Federal Reserve Economic Data (FRED Charts)
CME Fed Watch
U.S. Treasury – Yields
U.S. Census Bureau
Institute for Supply Management (ISM)
Weekly DOL Employment Data
BLS Monthly Jobs Report
JOLTS
US Energy Admin (EIA)
BLS Consumer Price Index CPI
BLS Producer Price Index PPI
Atlanta Fed GDPNOW
NY Fed Nowcast GDP
US Census Bureau Housing Starts
Consumer Credit
USCB Retail Sales
Construction Spending
Federal Reserve Dot Plots
NY Empire Index
Philadelphia Federal Reserve
P/E Ratio Data -Yardeni Research
Technical Analysis Info:
StockCharts.com – Financial Charts
Exponential vs Simple moving average
Other Links:
1973 Arab Oil Embargo
Hunt Brothers Silver
Long-Term Capital bailout
Categories:
Tags: