The Market Continues to Climb the Wall of Worry
The Dow, S&P500 and mid-caps made all made new highs on Friday. The S&P recorded its first four-week winning streak since late last August. Growth outperformed value by about 50bps. Tech was a slight laggard as semis underperformed while Utilities put in the best performance of the week as defensive sectors seemed to benefit from the lower rate backdrop. Materials outperformed on broad-based strength with industrial metals a particular standout. Healthcare did well with managed care, big pharma and biotech all driving the upside. Reopening names tended to lag with cruise lines under some pressure. Financials underperformed as the market would not reward credit-driven earnings beats from the banks and loan growth remained soft. Industrials trailed the tape with weakness in airlines though machinery, building materials and waste names saw good gains.
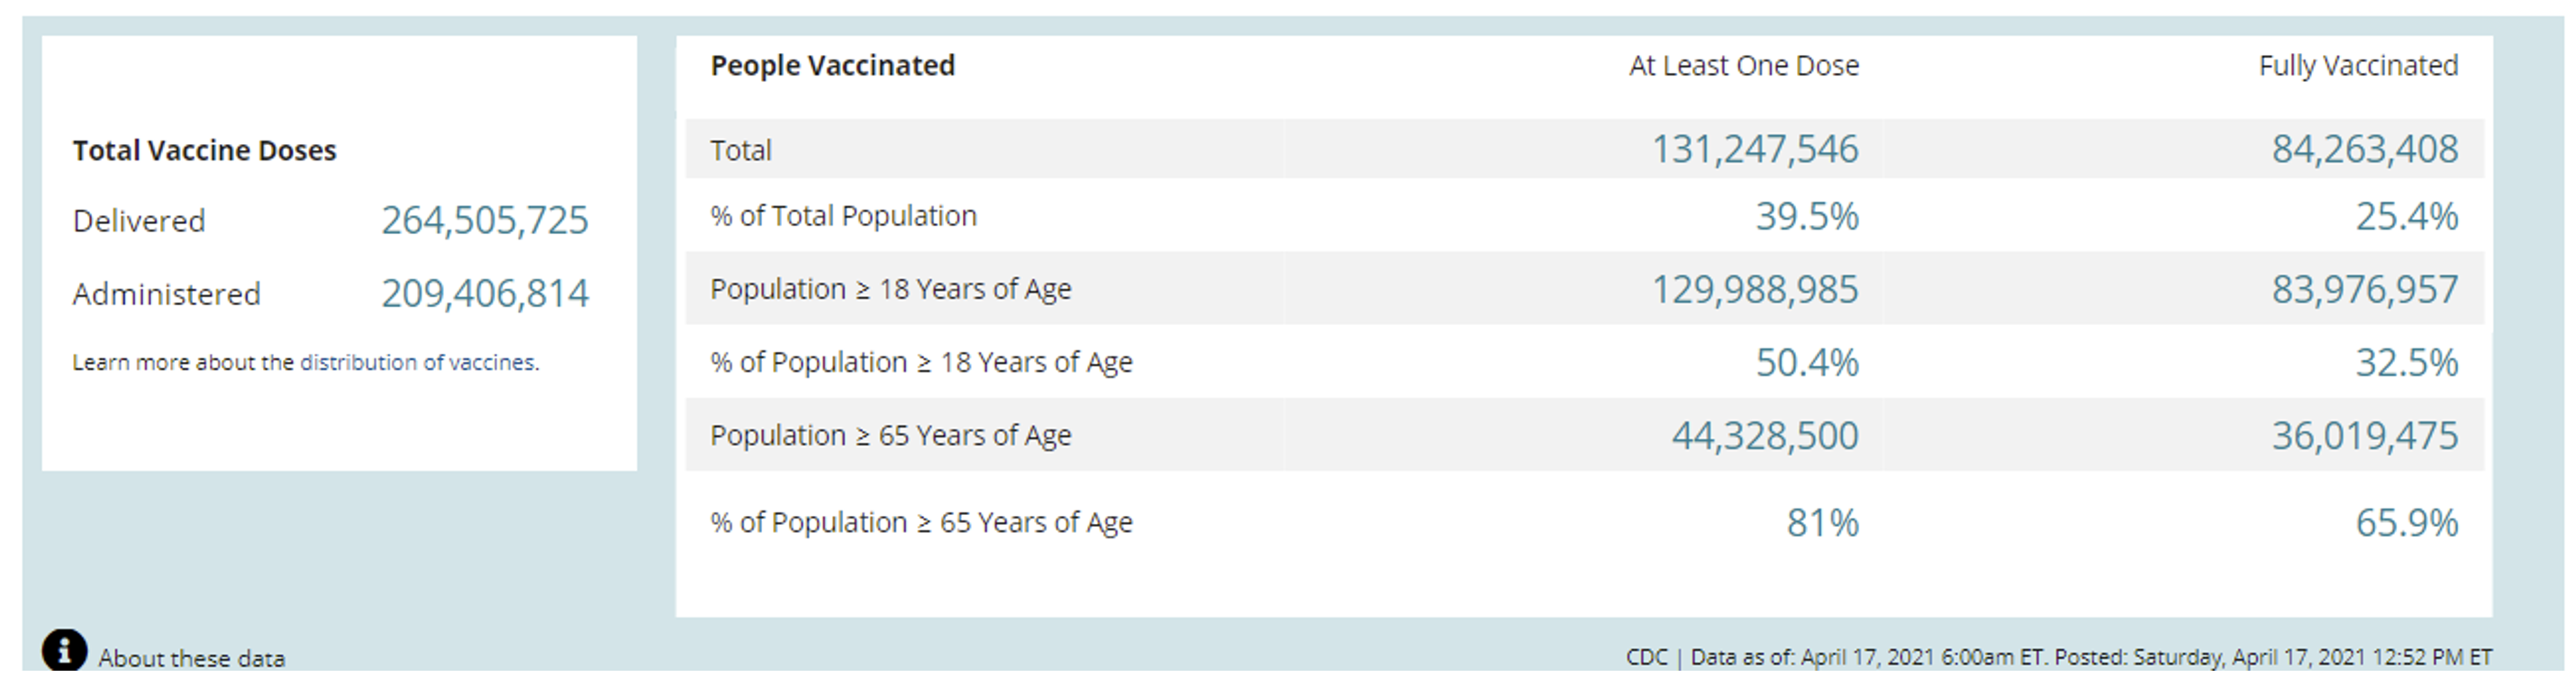
There is a lot of worrying going on right now, but for the market; the good news was good, and the bad news wasn’t bad enough to detract from the good news. To illustrate, the JNJ vaccine news was disappointing, but the alternatives are plentiful, and earnings are coming in better than expected. Heading into the unofficial start of earnings season this week, the street was looking for S&P earnings growth of 24.5% y/y, up from 15.8% at the start of the quarter. By the end of the week, the blended growth stood at 30.2%. There seems to be a better-than-expected macro backdrop starting to take hold. We suspect that the growth driver is the high rate of vaccinations taking place. The vaccine tracker is showing over 30% of the population is fully vaccinated.

Fixed Income
1/27/21 FOMC Statement FOMC Minutes Credit, Liquidity and Balance Sheet Federal Reserve Dot Plots
US Corporate Debt Tops 7 Trillion. Treasury.gov yields FOMC Policy Normalization Statement Longer Run Goals August 2020
Global Bond Yields
Daily US Treasury Yields
Foreign Exchange Market
Energy Complex
The Baker Hughes rig count gained 7 this week. There are 439 oil and gas rigs operating in the US – down 90 over last year.
- Brent Crude Oil gained 6.07% this week closing at $66.77/bbl
- WTI Crude Oil gained 6.52% this week to close at $63.19/bbl
- Heating Oil gained 4.97% this week closing at $1.90/gallon
- Natural Gas gained 6.10% this week closing at $2.68 per million BTUs
- Unleaded Gas gained 4.10% this week closing at $2.04/gallon
Metals Complex
- Gold gained 2.03% this week closing at $1780.20/oz
- Silver gained 3.08% on the week closing at $26.10/oz
- Palladium gained 5.21% this week closing at $2776.80/oz
- Platinum declined 0.05% this week closing at $1208.70/oz
- Copper gained 3.17% this week closing at $4.17/lb
Employment Picture
Weekly Unemployment Claims – Released Thursday 4/15/2021 – Initial jobless claims for the week ending April 10th decreased 193k to 576k. The 4-week moving average was 683k, a decrease of 47k. This is the lowest level for this average since March 14, 2020.
Job Openings & Labor Turnover Survey JOLTS – Released 4/6/2021 – The U.S. Bureau of Labor Statistics reported the number and rate of job openings increased to 7.4 million on the last business day of February. Over the month, hires increased to 5.7 million and separations were little changed at 5.5 million. Within separations, the quits rate was unchanged at 2.3%. The layoffs and discharges rates were unchanged at 1.2%.
March Jobs Report – BLS Summary – Released 4/2/2021 – The US Economy added 916k nonfarm jobs in March and the Unemployment rate declined 0.2% to 6.0%. Average hourly earnings declined by 4 cents to $29.96. Hiring highlights include +280k Leisure and Hospitality, +136k Government, +110k Construction, and +101k Education and Health Services.
- Average hourly earnings declined 4 cents to $29.96.
- U3 unemployment rate declined 0.2% to 6.0%. U6 unemployment rate declined to 10.7%.
- The labor force participation rate was little changed at 61.5%.
- Average workweek increased by 0.3 hour to 34.9 hours.
Employment Cost Index – Released 1/29/2021 – Compensation costs for civilian workers increased 0.7% for the 3-month period ending in December 2020. The 12 month period ending in December 2020 saw compensation costs increase by 2.5%. The 12 month period ending December 2019 increased 2.7%. Wages and salaries increased 2.6 percent over the year and increased 2.9 percent for the 12-month period ending in December 2019. Benefit costs increased 2.1 percent for the 12-month period ending in December 2020. In December 2019, benefit costs increased 1.9 percent. This report is published quarterly.
This Week’s Economic Data
Links take you to the data source
Housing Starts – Released 4/16/2021 – New home starts in March were at a seasonally adjusted annual rate of 1.739 million; up 19.4% above February and 37.0% above last March’s rate. Building Permits were at a seasonally adjusted annual rate of 1.766 million, up 2.7% compared to February and up 30.2% over last year.
Retail Sales – Released 4/15/2021 – U.S. retail sales for March increased 9.8% to $619.1 billion. U.S. retail sales are up 27.7% year/y.
Industrial Production and Capacity Utilization – Released 4/15/2021 – In March Industrial production increased 1.4%. Manufacturing increased 2.7%. Mining increased 5.7%. Utilities output decreased 11.4%. Total industrial production was up 2.5% at an annual rate for the first quarter of 2021. Total industrial production was 105.6% of its 2012 average which is 1.0% higher in March than a year ago, but still 3.4% below its pre-pandemic level. Total capacity utilization increased 1.0% to 74.4% in March which is 5.2% below its long-run average.
Consumer Price Index – Released 4/13/2021 – The Consumer Price Index increased 0.6% in March. Core CPI, which excludes food and energy was up 0.3%. The monthly changes left total CPI up 2.6% year-over-year and core CPI up 1.6%.
Recent Economic Data
Links take you to the data source
Producer Price Index – Released 4/9/2021 – The Producer Price Index for final demand increased 1.0% in March. PPI less food and energy increased 0.9% in March.
Consumer Credit – Released 4/7/2021 – In February, consumer credit increased at a seasonally adjusted rate of 7.9%. Revolving credit increased at an annual rate of 10.1%, while nonrevolving credit increased at an annual rate of 7.3%. Total Outstanding consumer credit is currently at $4.2058 trillion.
U.S. Trade Balance – Released 4/7/2021 – According to the U.S. Census Bureau of Economic Analysis, the goods and services deficit increased in February by $3.3 billion to $71.1 billion. February exports were $187.3 billion, $5.0 billion less than January exports. February imports were $258.3 billion, $1.7 billion less than January imports. Year over year the goods and services deficit increased $56.5 billion or 68.6%. Year–over–year exports and imports decreased $36.2 billion or 8.7% and increased $20.3 billion or 4.1% respectively.
PMI Non-Manufacturing Index – Released 4/5/2021 – Economic activity in the non-manufacturing sector grew in March for the tenth consecutive month. ISM Non-Manufacturing registered 63.7 percent, which is 8.4 percentage points above the adjusted February reading of 55.3 percent.
US Light Vehicle Sales – Released 4/2/2021 – U.S. light vehicle sales were at a seasonally adjusted annual rate (SAAR) of 17.747 million units in March.
PMI Manufacturing Index – Released 4/1/2021 – March PMI increased 3.9% to 64.7% from February’s reading of 60.8%. The New Orders Index was up 3.2% from February’s reading of 64.8% to 68.0%. The Production Index registered 68.1%, up 4.9%.
U.S. Construction Spending – Released 4/1/2021 – Construction spending declined 0.8% in February measuring at a seasonally adjusted annual rate of $1,516.9 billion. The February figure is 5.3% above the February 2019 estimate. Private construction spending was 0.5% below the revised January estimate at $1,171.6 billion. Public construction spending was 1.7% below the revised January estimate at $357.4 billion.
Chicago PMI – Released 3/31/2021 – Chicago PMI increased to 66.3 points in March. This marks nine consecutive months above the 50-mark following a full year under it. Among the main five indicators, Production saw the largest gain, while Order Backlogs saw the biggest drop.
Consumer Confidence – Released 3/30/2021 – The Consumer confidence index increased 21.3% in March following an increase in February. The Index now shows its highest reading in a year of 109.7, up from 90.4 in February.
Personal Income – Released 3/26/2021 – Personal income decreased $1,516.6 billion or 7.1 percent in February according to estimates released today by the Bureau of Economic Analysis. Disposable personal income (DPI) decreased $1,532.3 billion or 8.0 percent and personal consumption expenditures (PCE) decreased $149.0 billion or 1.0 percent.
Third Estimate of 4th Quarter 2020 GDP – Released 3/25/2021 – Real gross domestic product (GDP) increased at an annual rate of 4.3 percent in the fourth quarter of 2020, according to the third estimate released by the Bureau of Economic Analysis. The third quarter of 2020 saw an increase of 33.4 percent in real GDP. The third GDP estimate is based on more complete source data than that of the second and advance estimates. The second estimate saw GDP increase 4.1 percent while the advance estimate saw GDP increase 4.0 percent. The increase in real GDP reflected increases in exports, nonresidential fixed investment, personal consumption expenditures (PCE), residential fixed investment, and private inventory investment that were partly offset by decreases in state and local government spending and federal government spending. Imports, which are a subtraction in the calculation of GDP, increased. With the second estimate, upward revisions to residential fixed investment, private inventory investment, and state and local government spending were partly offset by a downward revision to personal consumption expenditures (PCE). In the third estimate, the upward revision primarily reflected an upward revision to private inventory investment that was partly offset by a downward revision to nonresidential fixed investment
Durable Goods – Released 3/24/2021 – New orders for manufactured durable goods in February decreased $2.9 billion or 1.1% to $254.0 billion. Transportation equipment led the decrease declining $1.3 billion or 1.6% to $83.6 billion.
New Residential Sales – Released 3/23/2021 – Sales of new single-family homes declined 18.2% to 775k, seasonally adjusted, in February. The median sales price of new homes sold in February was $349,400 with an average sales price of $416,000. At the end of February, the seasonally adjusted estimate of new homes for sale was 312k. This represents a supply of 4.8 months at the current sales rate.
Existing Home Sales – Released 3/22/2021 – Existing home sales decreased in February following an increase in January. Sales decreased 6.6% to a seasonally adjusted rate of 6.22 million in February. Sales are currently up 9.1% from one year ago. Housing inventory sits at 1.03 million units. Flat over last month. Down 29.5% over last year. Unsold inventory sits at a two-month supply. The median existing home price for all housing types was $313,000.
Next week we get data on Existing Home Sales and New Residential Sales.
Data Sources:
Bureau of Economic Analysis (BEA)
Congressional Budget Office (CBO)
U.S. Bureau of Labor Statistics (BLS)
Federal Reserve Economic Data (FRED Charts)
CME Fed Watch
U.S. Treasury – Yields
U.S. Census Bureau
Institute for Supply Management (ISM)
Weekly DOL Employment Data
BLS Monthly Jobs Report
JOLTS
US Energy Admin (EIA)
BLS Consumer Price Index CPI
BLS Producer Price Index PPI
Atlanta Fed GDPNOW
NY Fed Nowcast GDP
US Census Bureau Housing Starts
Consumer Credit
USCB Retail Sales
Construction Spending
Federal Reserve Dot Plots
NY Empire Index
Philadelphia Federal Reserve
P/E Ratio Data -Yardeni Research
Technical Analysis Info:
StockCharts.com – Financial Charts
Exponential vs Simple moving average
Other Links:
1973 Arab Oil Embargo
Hunt Brothers Silver
Long-Term Capital bailout


Week 15 Talking Points
The Market Continues to Climb the Wall of Worry
The Dow, S&P500 and mid-caps made all made new highs on Friday. The S&P recorded its first four-week winning streak since late last August. Growth outperformed value by about 50bps. Tech was a slight laggard as semis underperformed while Utilities put in the best performance of the week as defensive sectors seemed to benefit from the lower rate backdrop. Materials outperformed on broad-based strength with industrial metals a particular standout. Healthcare did well with managed care, big pharma and biotech all driving the upside. Reopening names tended to lag with cruise lines under some pressure. Financials underperformed as the market would not reward credit-driven earnings beats from the banks and loan growth remained soft. Industrials trailed the tape with weakness in airlines though machinery, building materials and waste names saw good gains.
There is a lot of worrying going on right now, but for the market; the good news was good, and the bad news wasn’t bad enough to detract from the good news. To illustrate, the JNJ vaccine news was disappointing, but the alternatives are plentiful, and earnings are coming in better than expected. Heading into the unofficial start of earnings season this week, the street was looking for S&P earnings growth of 24.5% y/y, up from 15.8% at the start of the quarter. By the end of the week, the blended growth stood at 30.2%. There seems to be a better-than-expected macro backdrop starting to take hold. We suspect that the growth driver is the high rate of vaccinations taking place. The vaccine tracker is showing over 30% of the population is fully vaccinated.
Table of Contents
Fixed Income
1/27/21 FOMC Statement FOMC Minutes Credit, Liquidity and Balance Sheet Federal Reserve Dot Plots
US Corporate Debt Tops 7 Trillion. Treasury.gov yields FOMC Policy Normalization Statement Longer Run Goals August 2020
Global Bond Yields
Daily US Treasury Yields
Foreign Exchange Market
Energy Complex
The Baker Hughes rig count gained 7 this week. There are 439 oil and gas rigs operating in the US – down 90 over last year.
Metals Complex
Employment Picture
Weekly Unemployment Claims – Released Thursday 4/15/2021 – Initial jobless claims for the week ending April 10th decreased 193k to 576k. The 4-week moving average was 683k, a decrease of 47k. This is the lowest level for this average since March 14, 2020.
Job Openings & Labor Turnover Survey JOLTS – Released 4/6/2021 – The U.S. Bureau of Labor Statistics reported the number and rate of job openings increased to 7.4 million on the last business day of February. Over the month, hires increased to 5.7 million and separations were little changed at 5.5 million. Within separations, the quits rate was unchanged at 2.3%. The layoffs and discharges rates were unchanged at 1.2%.
March Jobs Report – BLS Summary – Released 4/2/2021 – The US Economy added 916k nonfarm jobs in March and the Unemployment rate declined 0.2% to 6.0%. Average hourly earnings declined by 4 cents to $29.96. Hiring highlights include +280k Leisure and Hospitality, +136k Government, +110k Construction, and +101k Education and Health Services.
Employment Cost Index – Released 1/29/2021 – Compensation costs for civilian workers increased 0.7% for the 3-month period ending in December 2020. The 12 month period ending in December 2020 saw compensation costs increase by 2.5%. The 12 month period ending December 2019 increased 2.7%. Wages and salaries increased 2.6 percent over the year and increased 2.9 percent for the 12-month period ending in December 2019. Benefit costs increased 2.1 percent for the 12-month period ending in December 2020. In December 2019, benefit costs increased 1.9 percent. This report is published quarterly.
This Week’s Economic Data
Links take you to the data source
Housing Starts – Released 4/16/2021 – New home starts in March were at a seasonally adjusted annual rate of 1.739 million; up 19.4% above February and 37.0% above last March’s rate. Building Permits were at a seasonally adjusted annual rate of 1.766 million, up 2.7% compared to February and up 30.2% over last year.
Retail Sales – Released 4/15/2021 – U.S. retail sales for March increased 9.8% to $619.1 billion. U.S. retail sales are up 27.7% year/y.
Industrial Production and Capacity Utilization – Released 4/15/2021 – In March Industrial production increased 1.4%. Manufacturing increased 2.7%. Mining increased 5.7%. Utilities output decreased 11.4%. Total industrial production was up 2.5% at an annual rate for the first quarter of 2021. Total industrial production was 105.6% of its 2012 average which is 1.0% higher in March than a year ago, but still 3.4% below its pre-pandemic level. Total capacity utilization increased 1.0% to 74.4% in March which is 5.2% below its long-run average.
Consumer Price Index – Released 4/13/2021 – The Consumer Price Index increased 0.6% in March. Core CPI, which excludes food and energy was up 0.3%. The monthly changes left total CPI up 2.6% year-over-year and core CPI up 1.6%.
Recent Economic Data
Links take you to the data source
Producer Price Index – Released 4/9/2021 – The Producer Price Index for final demand increased 1.0% in March. PPI less food and energy increased 0.9% in March.
Consumer Credit – Released 4/7/2021 – In February, consumer credit increased at a seasonally adjusted rate of 7.9%. Revolving credit increased at an annual rate of 10.1%, while nonrevolving credit increased at an annual rate of 7.3%. Total Outstanding consumer credit is currently at $4.2058 trillion.
U.S. Trade Balance – Released 4/7/2021 – According to the U.S. Census Bureau of Economic Analysis, the goods and services deficit increased in February by $3.3 billion to $71.1 billion. February exports were $187.3 billion, $5.0 billion less than January exports. February imports were $258.3 billion, $1.7 billion less than January imports. Year over year the goods and services deficit increased $56.5 billion or 68.6%. Year–over–year exports and imports decreased $36.2 billion or 8.7% and increased $20.3 billion or 4.1% respectively.
PMI Non-Manufacturing Index – Released 4/5/2021 – Economic activity in the non-manufacturing sector grew in March for the tenth consecutive month. ISM Non-Manufacturing registered 63.7 percent, which is 8.4 percentage points above the adjusted February reading of 55.3 percent.
US Light Vehicle Sales – Released 4/2/2021 – U.S. light vehicle sales were at a seasonally adjusted annual rate (SAAR) of 17.747 million units in March.
PMI Manufacturing Index – Released 4/1/2021 – March PMI increased 3.9% to 64.7% from February’s reading of 60.8%. The New Orders Index was up 3.2% from February’s reading of 64.8% to 68.0%. The Production Index registered 68.1%, up 4.9%.
U.S. Construction Spending – Released 4/1/2021 – Construction spending declined 0.8% in February measuring at a seasonally adjusted annual rate of $1,516.9 billion. The February figure is 5.3% above the February 2019 estimate. Private construction spending was 0.5% below the revised January estimate at $1,171.6 billion. Public construction spending was 1.7% below the revised January estimate at $357.4 billion.
Chicago PMI – Released 3/31/2021 – Chicago PMI increased to 66.3 points in March. This marks nine consecutive months above the 50-mark following a full year under it. Among the main five indicators, Production saw the largest gain, while Order Backlogs saw the biggest drop.
Consumer Confidence – Released 3/30/2021 – The Consumer confidence index increased 21.3% in March following an increase in February. The Index now shows its highest reading in a year of 109.7, up from 90.4 in February.
Personal Income – Released 3/26/2021 – Personal income decreased $1,516.6 billion or 7.1 percent in February according to estimates released today by the Bureau of Economic Analysis. Disposable personal income (DPI) decreased $1,532.3 billion or 8.0 percent and personal consumption expenditures (PCE) decreased $149.0 billion or 1.0 percent.
Third Estimate of 4th Quarter 2020 GDP – Released 3/25/2021 – Real gross domestic product (GDP) increased at an annual rate of 4.3 percent in the fourth quarter of 2020, according to the third estimate released by the Bureau of Economic Analysis. The third quarter of 2020 saw an increase of 33.4 percent in real GDP. The third GDP estimate is based on more complete source data than that of the second and advance estimates. The second estimate saw GDP increase 4.1 percent while the advance estimate saw GDP increase 4.0 percent. The increase in real GDP reflected increases in exports, nonresidential fixed investment, personal consumption expenditures (PCE), residential fixed investment, and private inventory investment that were partly offset by decreases in state and local government spending and federal government spending. Imports, which are a subtraction in the calculation of GDP, increased. With the second estimate, upward revisions to residential fixed investment, private inventory investment, and state and local government spending were partly offset by a downward revision to personal consumption expenditures (PCE). In the third estimate, the upward revision primarily reflected an upward revision to private inventory investment that was partly offset by a downward revision to nonresidential fixed investment
Durable Goods – Released 3/24/2021 – New orders for manufactured durable goods in February decreased $2.9 billion or 1.1% to $254.0 billion. Transportation equipment led the decrease declining $1.3 billion or 1.6% to $83.6 billion.
New Residential Sales – Released 3/23/2021 – Sales of new single-family homes declined 18.2% to 775k, seasonally adjusted, in February. The median sales price of new homes sold in February was $349,400 with an average sales price of $416,000. At the end of February, the seasonally adjusted estimate of new homes for sale was 312k. This represents a supply of 4.8 months at the current sales rate.
Existing Home Sales – Released 3/22/2021 – Existing home sales decreased in February following an increase in January. Sales decreased 6.6% to a seasonally adjusted rate of 6.22 million in February. Sales are currently up 9.1% from one year ago. Housing inventory sits at 1.03 million units. Flat over last month. Down 29.5% over last year. Unsold inventory sits at a two-month supply. The median existing home price for all housing types was $313,000.
Next week we get data on Existing Home Sales and New Residential Sales.
Data Sources:
Bureau of Economic Analysis (BEA)
Congressional Budget Office (CBO)
U.S. Bureau of Labor Statistics (BLS)
Federal Reserve Economic Data (FRED Charts)
CME Fed Watch
U.S. Treasury – Yields
U.S. Census Bureau
Institute for Supply Management (ISM)
Weekly DOL Employment Data
BLS Monthly Jobs Report
JOLTS
US Energy Admin (EIA)
BLS Consumer Price Index CPI
BLS Producer Price Index PPI
Atlanta Fed GDPNOW
NY Fed Nowcast GDP
US Census Bureau Housing Starts
Consumer Credit
USCB Retail Sales
Construction Spending
Federal Reserve Dot Plots
NY Empire Index
Philadelphia Federal Reserve
P/E Ratio Data -Yardeni Research
Technical Analysis Info:
StockCharts.com – Financial Charts
Exponential vs Simple moving average
Other Links:
1973 Arab Oil Embargo
Hunt Brothers Silver
Long-Term Capital bailout
Categories:
Tags: