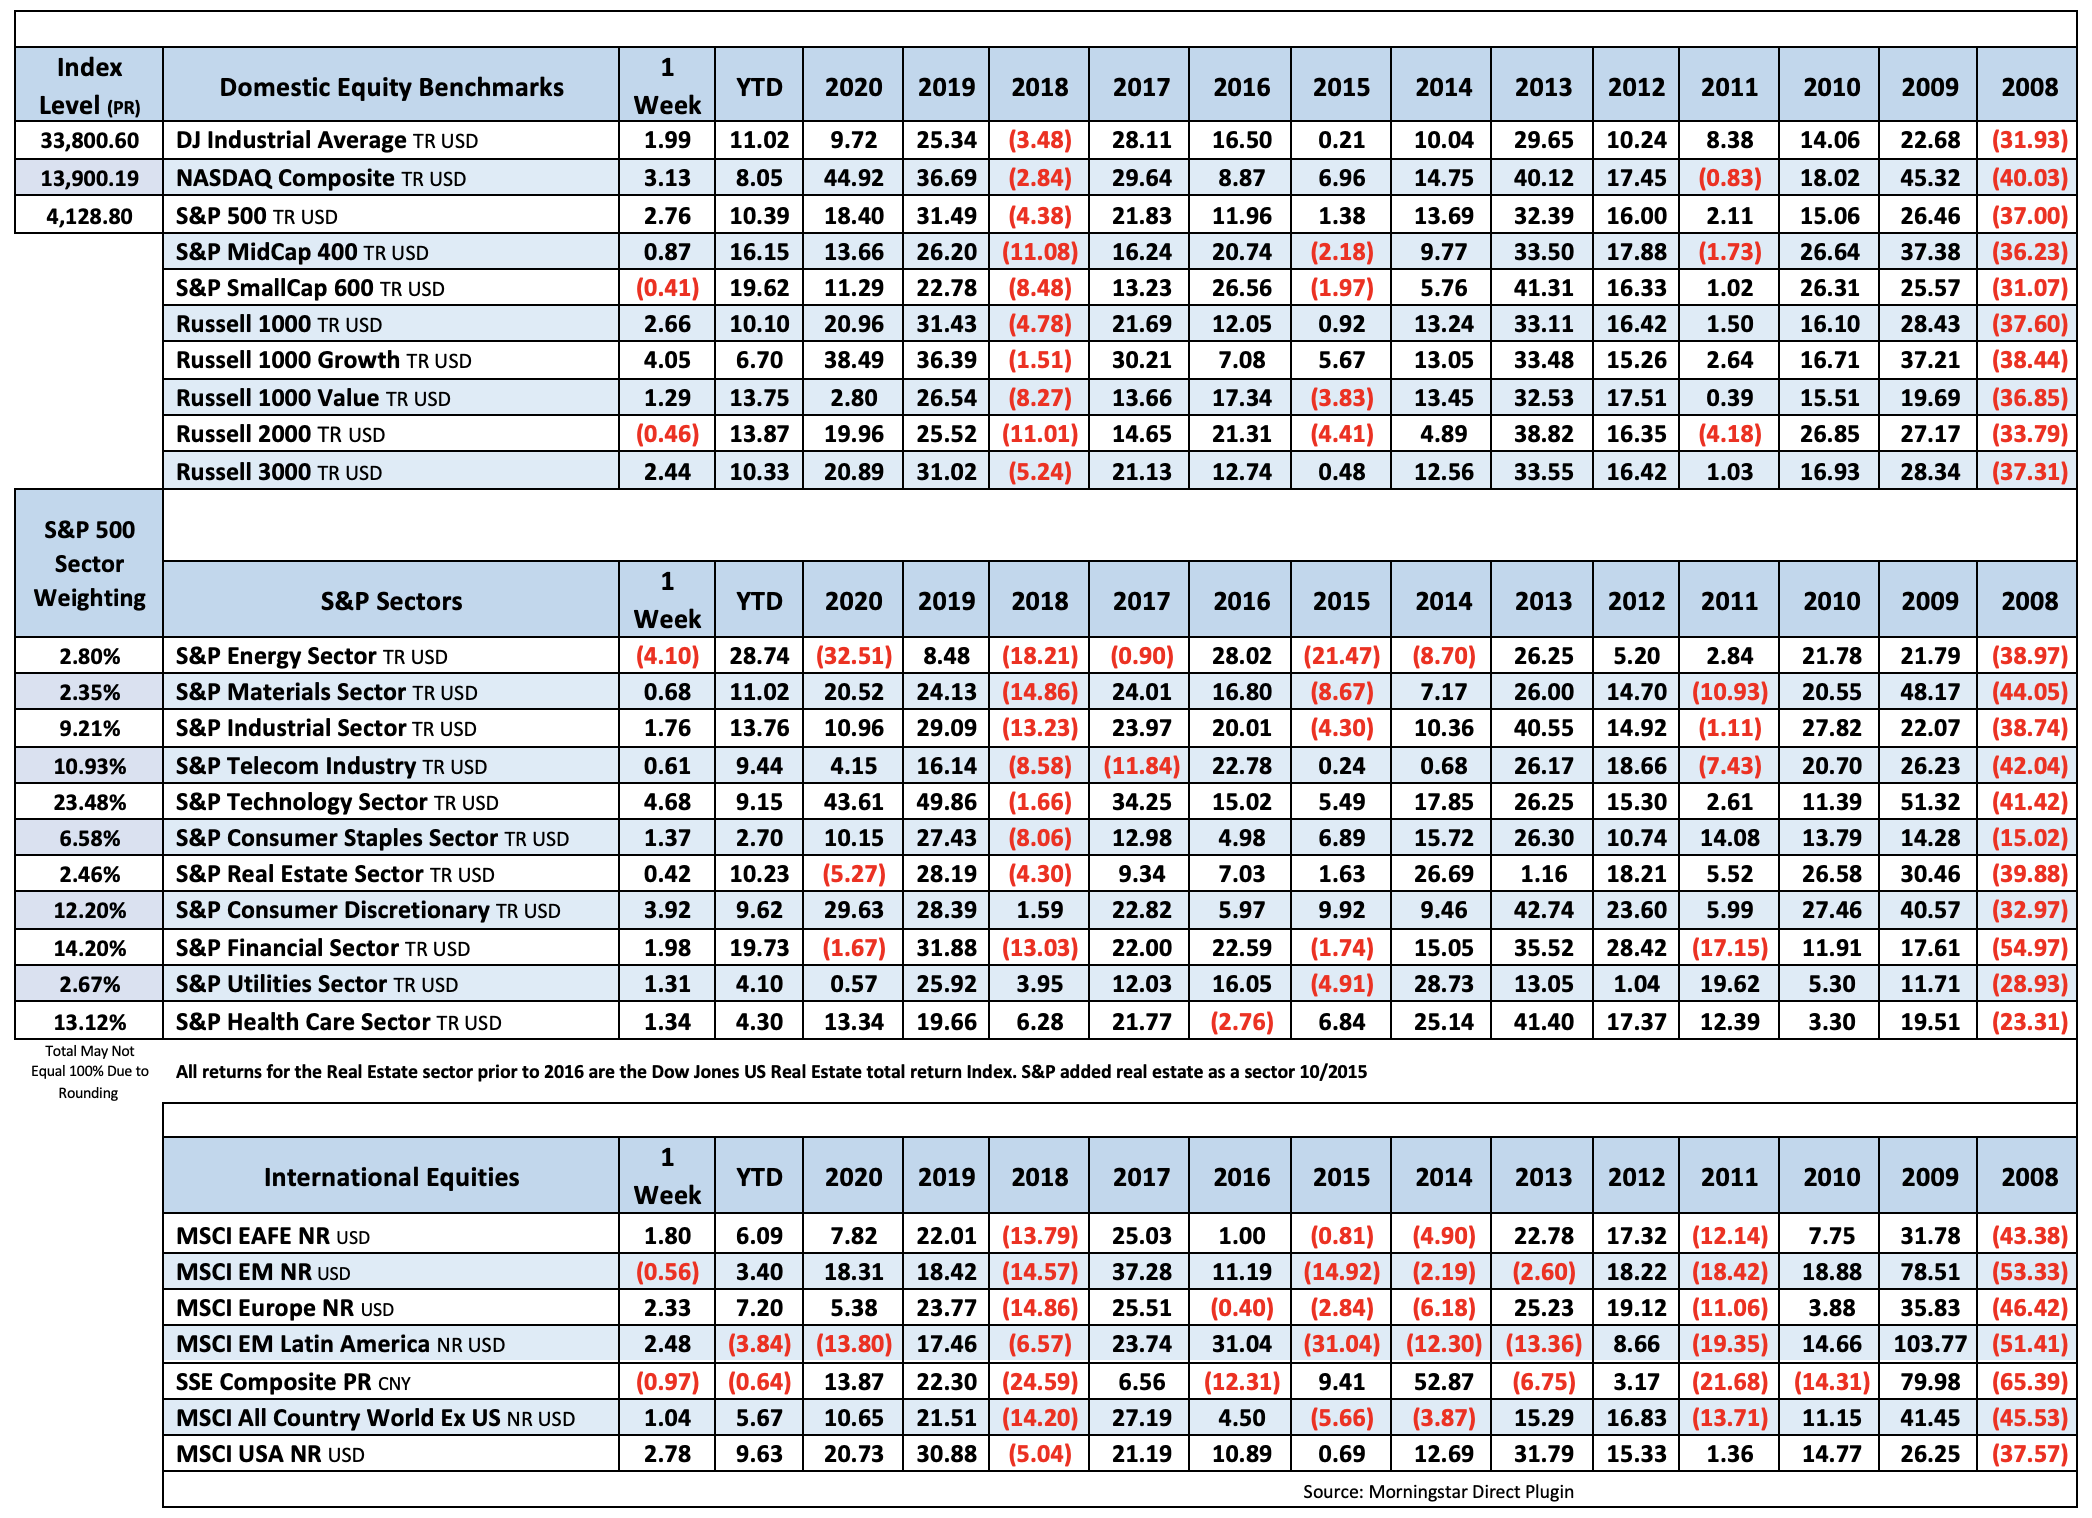
US equities finished mostly higher this week. Growth once again took the lead, outperforming value by almost 300 bps. Mega caps and technology were back in the driver’s seat with upside leadership from names like Apple +8.1%, Microsoft +6.0%, Amazon +6.7% and Google +6.6%. Energy fared the worst with a smallish pullback in oil (WTI -3.5). Treasuries were firmer with the 10-year yield at 1.66% after hitting 1.75% early in the week. The dollar index was down 0.8%. Gold gained nearly 1%. WTI crude lost 3.5%.
Mixed messages this week as nonfarm payrolls surged 916K in March, the biggest gain since last August- But initial jobless claims remain elevated and even have started to rise. The 4-week moving average was 724k, an increase of 2.5k.
1st Q earnings season unofficially kicks off this coming week with the big banks in focus. According to FactSet, Street looking for a 24.5% increase in S&P 500 earnings, which would mark the highest y/y growth since the 26.1% seen in Q3 2018.

Fixed Income
1/27/21 FOMC Statement FOMC Minutes Credit, Liquidity and Balance Sheet Federal Reserve Dot Plots
US Corporate Debt Tops 7 Trillion. Treasury.gov yields FOMC Policy Normalization Statement Longer Run Goals August 2020
Global Bond Yields
Daily US Treasury Yields
Foreign Exchange Market
Energy Complex
The Baker Hughes rig count gained 2 this week. There are 432 oil and gas rigs operating in the US – down 170 over last year.
- Brent Crude Oil declined 2.61% this week closing at $62.95/bbl
- WTI Crude Oil declined 3.47% this week to close at $59.32/bbl
- Heating Oil declined 1.31% this week closing at $1.81/gallon
- Natural Gas declined 4.28% this week closing at $2.53 per million BTUs
- Unleaded Gas declined 2.98% this week closing at $1.96/gallon
Metals Complex
- Gold gained 0.95% this week closing at $1744.80/oz
- Silver gained 1.51% on the week closing at $25.33/oz
- Palladium lost 0.56% this week closing at $2639.30/oz
- Platinum gained 0.06% this week closing at $1209.30/oz
- Copper gained 1.24% this week closing at $4.04/lb
Employment Picture
Weekly Unemployment Claims – Released Thursday 4/8/2021 – Initial jobless claims for the week ending April 3rd increased 16k to 744k. The 4-week moving average was 724k, an increased of 2.5k.
Job Openings & Labor Turnover Survey JOLTS – Released 4/6/2021 – The U.S. Bureau of Labor Statistics reported the number and rate of job openings increased to 7.4 million on the last business day of February. Over the month, hires increased to 5.7 million and separations was little changed at 5.5 million. Within separations, the quits rate was unchanged at 2.3%. The layoffs and discharges rates was unchanged at 1.2%.
March Jobs Report – BLS Summary – Released 4/2/2021 – The US Economy added 916k nonfarm jobs in March and the Unemployment rate declined 0.2% to 6.0%. Average hourly earnings declined by 4 cents to $29.96. Hiring highlights include+280k Leisure and Hospitality, +136k Government, +110k Construction, and +101k Education and Health Services.
- Average hourly earnings declined 4 cents to $29.96.
- U3 unemployment rate declined 0.2% to 6.0%. U6 unemployment rate declined to 10.7%.
- The labor force participation rate was little changed at 61.5%.
- Average work week increased by 0.3 hour to 34.9 hours.
Employment Cost Index – Released 1/29/2021 – Compensation costs for civilian workers increased 0.7% for the 3-month period ending in December 2020. The 12 month period ending on December 2020 saw compensation costs increase by 2.5%. The 12 month period ending December 2019 increased 2.7%. Wages and salaries increased 2.6 percent over the year and increased 2.9 percent for the 12-month period ending in December 2019. Benefit costs increased 2.1 percent for the 12-month period ending in December 2020. In December 2019, benefit costs increased 1.9 percent. This report is published quarterly.
This Week’s Economic Data
Links take you to the data source
Producer Price Index – Released 4/9/2021 – The Producer Price Index for final demand increased 1.0% in March. PPI less food and energy increased 0.9% in March.
Consumer Credit – Released 4/7/2021 – In February, consumer credit increased at a seasonally adjusted rate of 7.9%. Revolving credit increased at an annual rate of 10.1%, while nonrevolving credit increased at an annual rate of 7.3%. Total Outstanding consumer credit is currently at $4.2058 trillion.
U.S. Trade Balance – Released 4/7/2021 – According to the U.S. Census Bureau of Economic Analysis, the goods and services deficit increased in February by $3.3 billion to $71.1 billion. February exports were $187.3 billion, $5.0 billion less than January exports. February imports were $258.3 billion, $1.7 billion less than January imports. Year over year the goods and services deficit increased $56.5 billion or 68.6%. Year–over–year exports and imports decreased $36.2 billion or 8.7% and increased $20.3 billion or 4.1% respectively.
PMI Non-Manufacturing Index – Released 4/5/2021 – Economic activity in the non-manufacturing sector grew in March for the tenth consecutive month. ISM Non-Manufacturing registered 63.7 percent, which is 8.4 percentage points above the adjusted February reading of 55.3 percent.
Recent Economic Data
Links take you to the data source
US Light Vehicle Sales – Released 4/2/2021 – U.S. light vehicle sales were at a seasonally adjusted annual rate (SAAR) of 17.747 million units in March.
PMI Manufacturing Index – Released 4/1/2021 – March PMI increased 3.9% to 64.7% from February’s reading of 60.8%. The New Orders Index was up 3.2% from February’s reading of 64.8% to 68.0%. The Production Index registered 68.1%, up 4.9%.
U.S. Construction Spending – Released 4/1/2021 – Construction spending declined 0.8% in February measuring at a seasonally adjusted annual rate of $1,516.9 billion. The February figure is 5.3% above the February 2019 estimate. Private construction spending was 0.5% below the revised January estimate at $1,171.6 billion. Public construction spending was 1.7% below the revised January estimate at $357.4 billion.
Chicago PMI – Released 3/31/2021 – Chicago PMI increased to 66.3 points in March. This marks nine consecutive months above the 50-mark following a full year under it. Among the main five indicators, Production saw the largest gain, while Order Backlogs saw the biggest drop.
Consumer Confidence – Released 3/30/2021 – The Consumer confidence index increased 21.3% in March following an increase in February. The Index now shows its highest reading in a year of 109.7, up from 90.4 in February.
Personal Income – Released 3/26/2021 – Personal income decreased $1,516.6 billion or 7.1 percent in February according to estimates released today by the Bureau of Economic Analysis. Disposable personal income (DPI) decreased $1,532.3 billion or 8.0 percent and personal consumption expenditures (PCE) decreased $149.0 billion or 1.0 percent.
Third Estimate of 4th Quarter 2020 GDP – Released 3/25/2021 – Real gross domestic product (GDP) increased at an annual rate of 4.3 percent in the fourth quarter of 2020, according to the third estimate released by the Bureau of Economic Analysis. The third quarter of 2020 saw an increase of 33.4 percent in real GDP. The third GDP estimate is based on more complete source data than that of the second and advance estimates. The second estimate saw GDP increase 4.1 percent while the advance estimate saw GDP increase 4.0 percent. The increase in real GDP reflected increases in exports, nonresidential fixed investment, personal consumption expenditures (PCE), residential fixed investment, and private inventory investment that were partly offset by decreases in state and local government spending and federal government spending. Imports, which are a subtraction in the calculation of GDP, increased. With the second estimate, upward revisions to residential fixed investment, private inventory investment, and state and local government spending were partly offset by a downward revision to personal consumption expenditures (PCE). In the third estimate the upward revision primarily reflected an upward revision to private inventory investment that was partly offset by a downward revision to nonresidential fixed investment
Durable Goods – Released 3/24/2021 – New orders for manufactured durable goods in February decreased $2.9 billion or 1.1% to $254.0 billion. Transportation equipment led the decrease declining $1.3 billion or 1.6% to $83.6 billion.
New Residential Sales – Released 3/23/2021 – Sales of new single-family homes declined 18.2% to 775k, seasonally adjusted, in February. The median sales price of new homes sold in February was $349,400 with an average sales price of $416,000. At the end of February the seasonally adjusted estimate of new homes for sale was 312k. This represents a supply of 4.8 months at the current sales rate.
Existing Home Sales – Released 3/22/2021 – Existing home sales decreased in February following an increase in January. Sales decreased 6.6% to a seasonally adjusted rate of 6.22 million in February. Sales are currently up 9.1% from one year ago. Housing inventory sits at 1.03 million units. Flat over last month. Down 29.5% over last year. Unsold inventory sits at a two-month supply. The median existing-home price for all housing types was $313,000.
Housing Starts – Released 3/17/2021 – New home starts in February were at a seasonally adjusted annual rate of 1.421 million; down 10.3% below January and 9.3% below last February’s rate. Building Permits were at a seasonally adjusted annual rate of 1.682 million, down 10.8% compared to January and up 17.0% over last year.
Retail Sales – Released 3/16/2021 – U.S. retail sales for February decreased 3.0% to $561.7 billion. U.S. retail sales are up 6.3% year/y.
Industrial Production and Capacity Utilization – Released 3/16/2021 – In February Industrial production decreased 2.2%. Manufacturing decreased 3.1%. Mining decreased 5.4%. Utilities output increased 7.4%. Total industrial production was 104.7% of its 2012 average which is 4.2% lower in February than a year ago. Total capacity utilization decreased 1.7% to 73.8% in February which is 5.8% below its long-run average.
Consumer Price Index – Released 3/10/2021 – The Consumer Price Index increased 0.4% in February. Core CPI, which excludes food and energy was up 0.1%. The monthly changes left total CPI up 1.7% year-over-year and core CPI up 1.3%.
Next week we get data on CPI, Industrial Production and Capacity Utilization, Retail Sales, and Housing Starts.
Data Sources:
Bureau of Economic Analysis (BEA)
Congressional Budget Office (CBO)
U.S. Bureau of Labor Statistics (BLS)
Federal Reserve Economic Data (FRED Charts)
CME Fed Watch
U.S. Treasury – Yields
U.S. Census Bureau
Institute for Supply Management (ISM)
Weekly DOL Employment Data
BLS Monthly Jobs Report
JOLTS
US Energy Admin (EIA)
BLS Consumer Price Index CPI
BLS Producer Price Index PPI
Atlanta Fed GDPNOW
NY Fed Nowcast GDP
US Census Bureau Housing Starts
Consumer Credit
USCB Retail Sales
Construction Spending
Federal Reserve Dot Plots
NY Empire Index
Philadelphia Federal Reserve
P/E Ratio Data -Yardeni Research
Technical Analysis Info:
StockCharts.com – Financial Charts
Exponential vs Simple moving average
Other Links:
1973 Arab Oil Embargo
Hunt Brothers Silver
Long-Term Capital bailout


Week 14 Talking Points
US equities finished mostly higher this week. Growth once again took the lead, outperforming value by almost 300 bps. Mega caps and technology were back in the driver’s seat with upside leadership from names like Apple +8.1%, Microsoft +6.0%, Amazon +6.7% and Google +6.6%. Energy fared the worst with a smallish pullback in oil (WTI -3.5). Treasuries were firmer with the 10-year yield at 1.66% after hitting 1.75% early in the week. The dollar index was down 0.8%. Gold gained nearly 1%. WTI crude lost 3.5%.
Mixed messages this week as nonfarm payrolls surged 916K in March, the biggest gain since last August- But initial jobless claims remain elevated and even have started to rise. The 4-week moving average was 724k, an increase of 2.5k.
1st Q earnings season unofficially kicks off this coming week with the big banks in focus. According to FactSet, Street looking for a 24.5% increase in S&P 500 earnings, which would mark the highest y/y growth since the 26.1% seen in Q3 2018.
Table of Contents
Fixed Income
1/27/21 FOMC Statement FOMC Minutes Credit, Liquidity and Balance Sheet Federal Reserve Dot Plots
US Corporate Debt Tops 7 Trillion. Treasury.gov yields FOMC Policy Normalization Statement Longer Run Goals August 2020
Global Bond Yields
Daily US Treasury Yields
Foreign Exchange Market
Energy Complex
The Baker Hughes rig count gained 2 this week. There are 432 oil and gas rigs operating in the US – down 170 over last year.
Metals Complex
Employment Picture
Weekly Unemployment Claims – Released Thursday 4/8/2021 – Initial jobless claims for the week ending April 3rd increased 16k to 744k. The 4-week moving average was 724k, an increased of 2.5k.
Job Openings & Labor Turnover Survey JOLTS – Released 4/6/2021 – The U.S. Bureau of Labor Statistics reported the number and rate of job openings increased to 7.4 million on the last business day of February. Over the month, hires increased to 5.7 million and separations was little changed at 5.5 million. Within separations, the quits rate was unchanged at 2.3%. The layoffs and discharges rates was unchanged at 1.2%.
March Jobs Report – BLS Summary – Released 4/2/2021 – The US Economy added 916k nonfarm jobs in March and the Unemployment rate declined 0.2% to 6.0%. Average hourly earnings declined by 4 cents to $29.96. Hiring highlights include+280k Leisure and Hospitality, +136k Government, +110k Construction, and +101k Education and Health Services.
Employment Cost Index – Released 1/29/2021 – Compensation costs for civilian workers increased 0.7% for the 3-month period ending in December 2020. The 12 month period ending on December 2020 saw compensation costs increase by 2.5%. The 12 month period ending December 2019 increased 2.7%. Wages and salaries increased 2.6 percent over the year and increased 2.9 percent for the 12-month period ending in December 2019. Benefit costs increased 2.1 percent for the 12-month period ending in December 2020. In December 2019, benefit costs increased 1.9 percent. This report is published quarterly.
This Week’s Economic Data
Links take you to the data source
Producer Price Index – Released 4/9/2021 – The Producer Price Index for final demand increased 1.0% in March. PPI less food and energy increased 0.9% in March.
Consumer Credit – Released 4/7/2021 – In February, consumer credit increased at a seasonally adjusted rate of 7.9%. Revolving credit increased at an annual rate of 10.1%, while nonrevolving credit increased at an annual rate of 7.3%. Total Outstanding consumer credit is currently at $4.2058 trillion.
U.S. Trade Balance – Released 4/7/2021 – According to the U.S. Census Bureau of Economic Analysis, the goods and services deficit increased in February by $3.3 billion to $71.1 billion. February exports were $187.3 billion, $5.0 billion less than January exports. February imports were $258.3 billion, $1.7 billion less than January imports. Year over year the goods and services deficit increased $56.5 billion or 68.6%. Year–over–year exports and imports decreased $36.2 billion or 8.7% and increased $20.3 billion or 4.1% respectively.
PMI Non-Manufacturing Index – Released 4/5/2021 – Economic activity in the non-manufacturing sector grew in March for the tenth consecutive month. ISM Non-Manufacturing registered 63.7 percent, which is 8.4 percentage points above the adjusted February reading of 55.3 percent.
Recent Economic Data
Links take you to the data source
US Light Vehicle Sales – Released 4/2/2021 – U.S. light vehicle sales were at a seasonally adjusted annual rate (SAAR) of 17.747 million units in March.
PMI Manufacturing Index – Released 4/1/2021 – March PMI increased 3.9% to 64.7% from February’s reading of 60.8%. The New Orders Index was up 3.2% from February’s reading of 64.8% to 68.0%. The Production Index registered 68.1%, up 4.9%.
U.S. Construction Spending – Released 4/1/2021 – Construction spending declined 0.8% in February measuring at a seasonally adjusted annual rate of $1,516.9 billion. The February figure is 5.3% above the February 2019 estimate. Private construction spending was 0.5% below the revised January estimate at $1,171.6 billion. Public construction spending was 1.7% below the revised January estimate at $357.4 billion.
Chicago PMI – Released 3/31/2021 – Chicago PMI increased to 66.3 points in March. This marks nine consecutive months above the 50-mark following a full year under it. Among the main five indicators, Production saw the largest gain, while Order Backlogs saw the biggest drop.
Consumer Confidence – Released 3/30/2021 – The Consumer confidence index increased 21.3% in March following an increase in February. The Index now shows its highest reading in a year of 109.7, up from 90.4 in February.
Personal Income – Released 3/26/2021 – Personal income decreased $1,516.6 billion or 7.1 percent in February according to estimates released today by the Bureau of Economic Analysis. Disposable personal income (DPI) decreased $1,532.3 billion or 8.0 percent and personal consumption expenditures (PCE) decreased $149.0 billion or 1.0 percent.
Third Estimate of 4th Quarter 2020 GDP – Released 3/25/2021 – Real gross domestic product (GDP) increased at an annual rate of 4.3 percent in the fourth quarter of 2020, according to the third estimate released by the Bureau of Economic Analysis. The third quarter of 2020 saw an increase of 33.4 percent in real GDP. The third GDP estimate is based on more complete source data than that of the second and advance estimates. The second estimate saw GDP increase 4.1 percent while the advance estimate saw GDP increase 4.0 percent. The increase in real GDP reflected increases in exports, nonresidential fixed investment, personal consumption expenditures (PCE), residential fixed investment, and private inventory investment that were partly offset by decreases in state and local government spending and federal government spending. Imports, which are a subtraction in the calculation of GDP, increased. With the second estimate, upward revisions to residential fixed investment, private inventory investment, and state and local government spending were partly offset by a downward revision to personal consumption expenditures (PCE). In the third estimate the upward revision primarily reflected an upward revision to private inventory investment that was partly offset by a downward revision to nonresidential fixed investment
Durable Goods – Released 3/24/2021 – New orders for manufactured durable goods in February decreased $2.9 billion or 1.1% to $254.0 billion. Transportation equipment led the decrease declining $1.3 billion or 1.6% to $83.6 billion.
New Residential Sales – Released 3/23/2021 – Sales of new single-family homes declined 18.2% to 775k, seasonally adjusted, in February. The median sales price of new homes sold in February was $349,400 with an average sales price of $416,000. At the end of February the seasonally adjusted estimate of new homes for sale was 312k. This represents a supply of 4.8 months at the current sales rate.
Existing Home Sales – Released 3/22/2021 – Existing home sales decreased in February following an increase in January. Sales decreased 6.6% to a seasonally adjusted rate of 6.22 million in February. Sales are currently up 9.1% from one year ago. Housing inventory sits at 1.03 million units. Flat over last month. Down 29.5% over last year. Unsold inventory sits at a two-month supply. The median existing-home price for all housing types was $313,000.
Housing Starts – Released 3/17/2021 – New home starts in February were at a seasonally adjusted annual rate of 1.421 million; down 10.3% below January and 9.3% below last February’s rate. Building Permits were at a seasonally adjusted annual rate of 1.682 million, down 10.8% compared to January and up 17.0% over last year.
Retail Sales – Released 3/16/2021 – U.S. retail sales for February decreased 3.0% to $561.7 billion. U.S. retail sales are up 6.3% year/y.
Industrial Production and Capacity Utilization – Released 3/16/2021 – In February Industrial production decreased 2.2%. Manufacturing decreased 3.1%. Mining decreased 5.4%. Utilities output increased 7.4%. Total industrial production was 104.7% of its 2012 average which is 4.2% lower in February than a year ago. Total capacity utilization decreased 1.7% to 73.8% in February which is 5.8% below its long-run average.
Consumer Price Index – Released 3/10/2021 – The Consumer Price Index increased 0.4% in February. Core CPI, which excludes food and energy was up 0.1%. The monthly changes left total CPI up 1.7% year-over-year and core CPI up 1.3%.
Next week we get data on CPI, Industrial Production and Capacity Utilization, Retail Sales, and Housing Starts.
Data Sources:
Bureau of Economic Analysis (BEA)
Congressional Budget Office (CBO)
U.S. Bureau of Labor Statistics (BLS)
Federal Reserve Economic Data (FRED Charts)
CME Fed Watch
U.S. Treasury – Yields
U.S. Census Bureau
Institute for Supply Management (ISM)
Weekly DOL Employment Data
BLS Monthly Jobs Report
JOLTS
US Energy Admin (EIA)
BLS Consumer Price Index CPI
BLS Producer Price Index PPI
Atlanta Fed GDPNOW
NY Fed Nowcast GDP
US Census Bureau Housing Starts
Consumer Credit
USCB Retail Sales
Construction Spending
Federal Reserve Dot Plots
NY Empire Index
Philadelphia Federal Reserve
P/E Ratio Data -Yardeni Research
Technical Analysis Info:
StockCharts.com – Financial Charts
Exponential vs Simple moving average
Other Links:
1973 Arab Oil Embargo
Hunt Brothers Silver
Long-Term Capital bailout
Categories:
Tags: