Good Life Advisors – Talking Points – Week 15
Major US equity indices were lower this week, with the S&P 500 and Nasdaq Composite pulling back after three consecutive weekly gains. Growth was a notable underperformer to value; Treasuries were weaker with the curve seeing a big steepening move after the prior week’s flattening. The 2/10 spread returned back to positive territory and the 5/30 moved back toward zero. The dollar was stronger, with the DXY logging its best weekly performance of the past month. Gold was slightly higher, gaining 1.1%. Oil was weaker, with WTI settling down 1.0% for the week, now back below $100 bbl.
There was a lot of focus on the human toll in Ukraine this week, with the international community coming to grips with evidence of atrocities in areas recently evacuated by Russian troops, as well as continued bloodshed (such as Friday’s Russian missile strike on a railway station). And while fighting in some regions has wound down, Western analysts expect Russia is regrouping for a focused campaign in eastern Ukraine to come soon. While there were continued rumblings about ceasefire negotiations this week, peace seems a long way off (indeed, Russia’s Lavrov this week accused Ukraine of stalling the peace process). Meanwhile, the US and its allies continued to apply pressure through sanctions. The US Treasury moved to halt dollar-denominated payments on from US-based Russian accounts, which may push Russia closer to a default. Multiple EU countries expelled Russian diplomats, and the group approved a new round of sanctions banning the import of Russian coal-though members are not yet prepared to cut themselves off from Russian oil and gas.
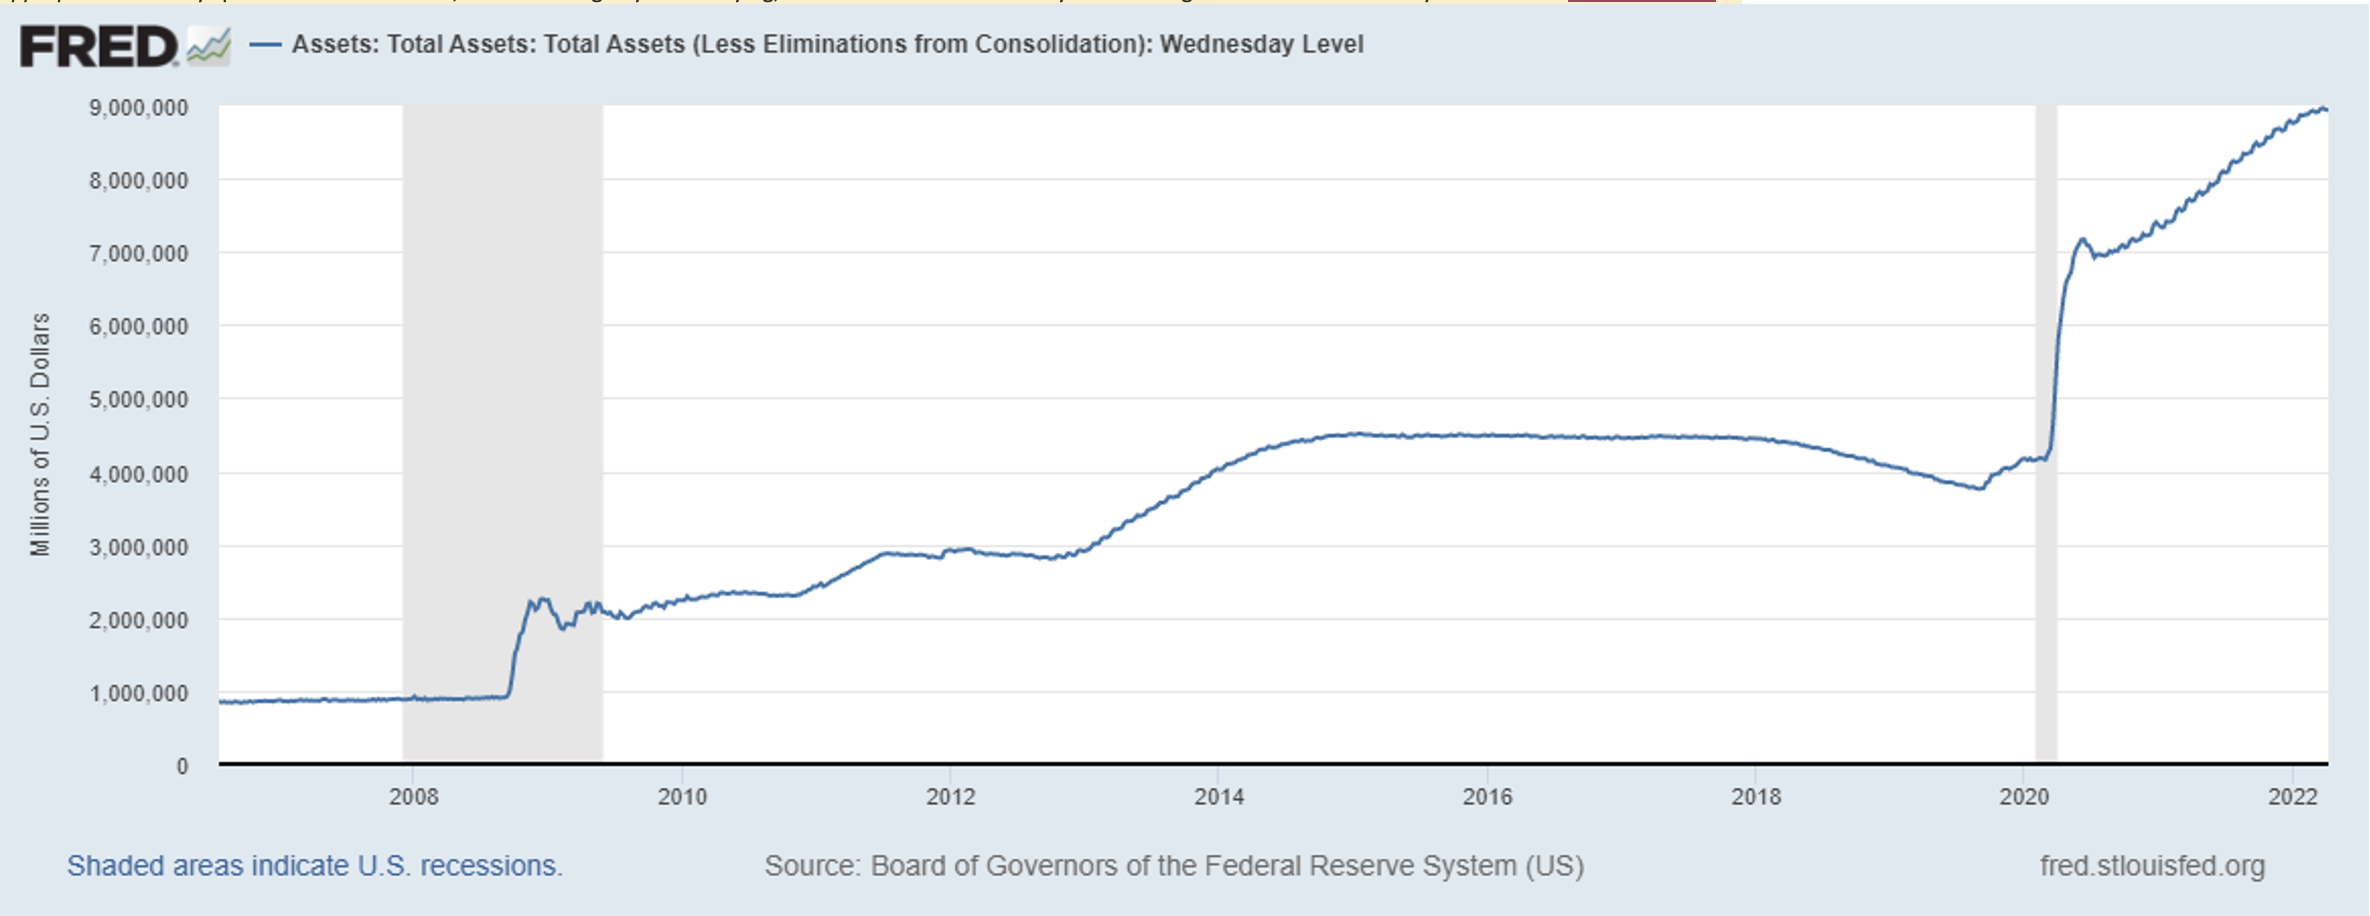
The Fed minutes came out Wednesday. The important part is what they discussed regarding the reduction of the holdings. The total Fed balance sheet ballooned by nearly five trillion dollars since covid. Current total is 8.93 trillion. The minutes show a plan to reduced holdings possibly starting in May and being phased in over three months. The minutes read; “Participants agreed that monthly caps of about $60 billion for Treasury securities and about $35 billion for agency MBS would likely be appropriate.” If they spent 95 billion a month, without doing any more buying, it would still take over four years to bring the balance to February 2020 levels.
FOMC minutes
The minutes also showed a willingness among some members for one or more 50bp rate hikes. Note that the minutes also suggested March could have been a 50bp hike, but members were more cautious given the uncertain geopolitical environment. After the meeting, market-based odds for a 50 bp May hike rose to 80%, up only slightly from the 77% just prior to the release. However, the odds the Fed moving up to 150-175 bp by the June meeting rose from 18% to 32% over the past week.
Overseas, there continued to be attention on the Covid outbreak in Shanghai, as well as on the economic impacts of China’s stringent zero-Covid policies. It seems possible that continued Chinse lockdowns could damage the damage supply chain recover that’s happening. New-case counts continue to rise and at the same time, there has been an outpouring of public dissatisfaction that could become one of President Xi’s biggest challenges.
Healthcare led the market with some help from the week’s defensive rotation. Managed care, large-cap pharma, and biotech all saw broad strength. Energy outperformed despite weaker oil performance. Integrators and refiners had a good week; E&Ps and oil-services names saw solid performance as well. Consumer staples was helped by grocers/staples retailers, food, and select food names. Materials were down overall but beat the tape, helped by another bout of strength from fertilizer names against the unsettled macro backdrop. Industrial metals and diversified/commodity chemicals were largely down. Financials was a relative outperformer. Select insurers and credit cards offered some cushion. Banks were mostly down, with regionals particularly weak. Industrials underperformed, with transports a drag. Machinery and multis were generally weaker as well, though there was a bit of strength in some defense and waste-related names. Communication services lagged, with media and entertainment broadly down. The megacap internets were down as well but TWTR +17.6% was a big gainer after Elon Musk announced a stake and was added to the board. Autos and suppliers weighed on consumer discretionary. Homebuilders, casual diners, hotels, casinos, and cruise lines were weaker as well. Specialty retailers had a better week. Tech trailed the market this week, with the megacap down and semiconductors broadly weaker.

Fixed Income
FOMC Minutes Credit, Liquidity and Balance Sheet Federal Reserve Dot Plots
US Corporate Debt Tops 7 Trillion. Treasury.gov yields FOMC Policy Normalization Statement Longer Run Goals August 2020
Foreign Exchange Market
Energy Complex
The Baker Hughes rig count gained 16 this week. There are 689 oil and gas rigs operating in the US – Up 257 over last year.
Metals Complex
Employment Picture
Weekly Unemployment Claims – Released Thursday 4/7/2022 – The week ending April 2nd observed a decrease of 5k in initial claims decreasing to 166k. The four-week moving average of initial jobless claims decreased 8k to 170k.
March Jobs Report – BLS Summary Released 4/1/2022 – The US Economy added 431k nonfarm jobs in March and the Unemployment rate declined to 3.6%. Average hourly earnings increased 13 to $31.73. Hiring highlights include+112k Leisure and Hospitality, +102k Professional and Business Services, +53k Education and Health Services, and +49k Retail Trade.
- Average hourly earnings increased 13 cents to $31.73.
- U3 unemployment rate declined 0.2% to 3.6%. U6 unemployment rate declined to 6.9%.
- The labor force participation rate was little changed at 62.4%.
- Average work week fell 0.1 hour to 34.6 hours.
Job Openings & Labor Turnover Survey JOLTS – Released 3/29/2022 – The U.S. Bureau of Labor Statistics reported the number and rate of job openings was little changed at 11.3 million on the last business day of February. Over the month, hires increased 6.7 million and separations were little changed at 6.1 million. Within separations, the quits rate was little changed at 2.9%. The layoffs and discharges rates were unchanged at 0.9%.
Employment Cost Index – Released 1/28/2022 – Compensation costs for civilian workers increased 1.0% for the 3-month period ending in December 2021. The 12-month period ending in December 2021 saw compensation costs increase by 4.0%. The 12-month period ending December 2020 increased 2.5%. Wages and salaries increased 4.5 percent over the year and increased 2.6 percent for the 12-month period ending in December 2020. Benefit costs increased 2.8 percent over the year and increased 2.3 percent for the 12-month period ending in December 2020. This report is published quarterly.
This Week’s Economic Data
Links take you to the data source
Consumer Credit – Released 4/7/2022 – Consumer credit increased at a seasonally adjusted annual rate of 11.3 percent in February. Revolving credit increased at an annual rate of 20.7 percent, while nonrevolving credit increased at an annual rate of 8.4 percent.
U.S. Trade Balance – Released 4/5/2022 – According to the U.S. Census Bureau of Economic Analysis the goods and services deficit decreased in February by $0.1 billion to $89.2 billion. February exports were $228.6 billion, $4.1 billion more than January exports. February imports were $317.8 billion, $4.1 billion more than January imports. Year-over-year, the goods and services deficit increased $45.7 billion, or 34.5 percent, from the same period in 2021. Exports increased $68.0 billion or 17.6 percent. Imports increased $113.7 billion or 22.0 percent.
PMI Non-Manufacturing Index – Released 4/5/2022 – Economic activity in the non-manufacturing sector grew in March for the 22nd consecutive month. ISM Non-Manufacturing registered 58.3 percent, which is 1.8 percentage points above the February reading of 56.5 percent.
Recent Economic Data
Links take you to the data source
PMI Manufacturing Index – Released 4/1/2022 – March PMI decreased 1.5% to 57.1% down from February’s reading of 58.6%. The New Orders Index was 53.8% down 7.9% from February’s reading of 61.7%. The Production Index registered 54.5%, down 4.0%.
U.S. Construction Spending – Released 4/1/2022 – Construction spending increased 0.5% in February measuring at a seasonally adjusted annual rate of $1,704.4 billion. The February figure is 11.2% above the February 2021 estimate. Private construction spending was 0.8% above the revised January estimate at $1,343.4 billion. Public construction spending was 0.4% below the revised January estimate at $350.7 billion.
Chicago PMI – Released 3/31/2022 – Chicago PMI increased by 6.6 points in March to 62.9. All five of the main five indicators increased.
US Light Vehicle Sales – Released 3/31/2022 – U.S. light vehicle sales were at a seasonally adjusted annual rate (SAAR) of 14.030 million units in February.
Personal Income – Released 3/31/2022 – Personal income increased $101.5 billion or 0.5 percent in February according to estimates released today by the Bureau of Economic Analysis. Disposable personal income (DPI) increased $76.1 billion or 0.4 percent and personal consumption expenditures (PCE) increased $34.9 billion or 0.2 percent.
Third Estimate of 4th Quarter 2021 GDP – Released 3/30/2022 – Real gross domestic product (GDP) increased at an annual rate of 6.9 percent in the fourth quarter of 2021, according to the third estimate released by the Bureau of Economic Analysis. GDP increased 2.3 percent in the third quarter of 2021. The third estimate is based on source data that are more complete than that of the second and advance estimates. The increase in real GDP primarily reflected increases in private inventory investment, exports, personal consumption expenditures (PCE), and nonresidential fixed investment that were partly offset by decreases in both federal and state and local government spending. Imports, which are a subtraction in the calculation of GDP, increased. The updated estimates primarily reflected upward revisions to nonresidential fixed investment, state and local government spending, and residential fixed investment that were partly offset by downward revisions to personal consumption expenditures (PCE) and exports. The downward revision in the third estimate primarily reflected downward revisions to personal consumption expenditures (PCE) and exports that were partly offset by an upward revision to private inventory investment.
Consumer Confidence – Released 3/29/2022 – The Consumer confidence index increased in March following a decrease in February. The Index now stands at 107.2, up from 105.7 in February.
Durable Goods – Released 3/24/2022 – New orders for manufactured durable goods in February decreased $6.0 billion or 2.2% to $271.5 billion. Transportation equipment led the decrease falling $4.9 billion or 5.6% to $82.6 billion.
New Residential Sales – Released 3/23/2022 – Sales of new single-family homes decreased 2.0% to 772k, seasonally adjusted, in February. The median sales price of new homes sold in February was $400,600 with an average sales price of $511,000. At the end of February, the seasonally adjusted estimate of new homes for sale was 407k. This represents a supply of 6.3 months at the current sales rate.
Existing Home Sales – Released 3/18/2022 – Existing home sales decreased in February following an increase in January. Sales declined 7.2% to a seasonally adjusted rate of 6.02 million in February. Sales decreased 2.4% year-over-year. Housing inventory sits at 870k units. Up 2.4% from January’s inventory. Down 15.5% over last year. Unsold inventory sits at a 1.7-month supply. The median existing home price for all housing types was $357,300 which is up 15.0% from February 2021. This marks 120 consecutive months of year-over-year increases, the longest-running streak on record.
Housing Starts – Released 3/17/2022 – New home starts in February were at a seasonally adjusted annual rate of 1.769 million; up 6.8% above January, and 22.3% above last January’s rate. Building Permits were at a seasonally adjusted annual rate of 1.859 million, down 1.9% compared to January, but up 7.7% over last year.
Industrial Production and Capacity Utilization – Released 3/17/2022 – In February Industrial production increased 0.5%. Manufacturing increased 1.2%. Utilities output declined 2.7%. Mining output increased 0.1%. Total industrial production was 7.5% higher in February than a year ago. Total capacity utilization increased 0.3% to 77.6% in February which is 1.9% below its long run average.
Retail Sales – Released 3/16/2022 – U.S. retail sales for February increased 0.3% to $658.1 billion and retail sales are 17.6% above February 2021. U.S. retail sales for the December 2021 through February 2022 period were up 16.0% from the same period a year ago.
Producer Price Index – Released 3/15/2022 – The Producer Price Index for final demand increased 0.8% in February. PPI less food and energy increased 0.7%. The change in PPI for final demand has increased 10.0% year/y.
Consumer Price Index – Released 3/10/2022 – Consumer prices rose 0.8% m/m in February following a 0.6% gain in January. Consumer prices are up 7.9% for the 12-month period ending in February. Core consumer prices increased 0.5% m/m in February following a 0.6% gain in January.
Next week we get data on CPI, PPI, Retail Sales, Industrial Production and Capacity Utilization.
Data Sources:
Bureau of Economic Analysis (BEA)
Congressional Budget Office (CBO)
U.S. Bureau of Labor Statistics (BLS)
Federal Reserve Economic Data (FRED Charts)
CME Fed Watch
U.S. Treasury – Yields
U.S. Census Bureau
Institute for Supply Management (ISM)
Weekly DOL Employment Data
BLS Monthly Jobs Report
JOLTS
US Energy Admin (EIA)
BLS Consumer Price Index CPI
BLS Producer Price Index PPI
Atlanta Fed GDPNOW
NY Fed Nowcast GDP
US Census Bureau Housing Starts
Consumer Credit
USCB Retail Sales
Construction Spending
Federal Reserve Dot Plots
NY Empire Index
Philadelphia Federal Reserve
P/E Ratio Data -Yardeni Research
Technical Analysis Info:
StockCharts.com – Financial Charts
Exponential vs Simple moving average
Other Links:
1973 Arab Oil Embargo
Hunt Brothers Silver
Long-Term Capital bailout


Week 15 Talking Points
Good Life Advisors – Talking Points – Week 15
Major US equity indices were lower this week, with the S&P 500 and Nasdaq Composite pulling back after three consecutive weekly gains. Growth was a notable underperformer to value; Treasuries were weaker with the curve seeing a big steepening move after the prior week’s flattening. The 2/10 spread returned back to positive territory and the 5/30 moved back toward zero. The dollar was stronger, with the DXY logging its best weekly performance of the past month. Gold was slightly higher, gaining 1.1%. Oil was weaker, with WTI settling down 1.0% for the week, now back below $100 bbl.
There was a lot of focus on the human toll in Ukraine this week, with the international community coming to grips with evidence of atrocities in areas recently evacuated by Russian troops, as well as continued bloodshed (such as Friday’s Russian missile strike on a railway station). And while fighting in some regions has wound down, Western analysts expect Russia is regrouping for a focused campaign in eastern Ukraine to come soon. While there were continued rumblings about ceasefire negotiations this week, peace seems a long way off (indeed, Russia’s Lavrov this week accused Ukraine of stalling the peace process). Meanwhile, the US and its allies continued to apply pressure through sanctions. The US Treasury moved to halt dollar-denominated payments on from US-based Russian accounts, which may push Russia closer to a default. Multiple EU countries expelled Russian diplomats, and the group approved a new round of sanctions banning the import of Russian coal-though members are not yet prepared to cut themselves off from Russian oil and gas.
The Fed minutes came out Wednesday. The important part is what they discussed regarding the reduction of the holdings. The total Fed balance sheet ballooned by nearly five trillion dollars since covid. Current total is 8.93 trillion. The minutes show a plan to reduced holdings possibly starting in May and being phased in over three months. The minutes read; “Participants agreed that monthly caps of about $60 billion for Treasury securities and about $35 billion for agency MBS would likely be appropriate.” If they spent 95 billion a month, without doing any more buying, it would still take over four years to bring the balance to February 2020 levels.
FOMC minutes
The minutes also showed a willingness among some members for one or more 50bp rate hikes. Note that the minutes also suggested March could have been a 50bp hike, but members were more cautious given the uncertain geopolitical environment. After the meeting, market-based odds for a 50 bp May hike rose to 80%, up only slightly from the 77% just prior to the release. However, the odds the Fed moving up to 150-175 bp by the June meeting rose from 18% to 32% over the past week.
Overseas, there continued to be attention on the Covid outbreak in Shanghai, as well as on the economic impacts of China’s stringent zero-Covid policies. It seems possible that continued Chinse lockdowns could damage the damage supply chain recover that’s happening. New-case counts continue to rise and at the same time, there has been an outpouring of public dissatisfaction that could become one of President Xi’s biggest challenges.
Healthcare led the market with some help from the week’s defensive rotation. Managed care, large-cap pharma, and biotech all saw broad strength. Energy outperformed despite weaker oil performance. Integrators and refiners had a good week; E&Ps and oil-services names saw solid performance as well. Consumer staples was helped by grocers/staples retailers, food, and select food names. Materials were down overall but beat the tape, helped by another bout of strength from fertilizer names against the unsettled macro backdrop. Industrial metals and diversified/commodity chemicals were largely down. Financials was a relative outperformer. Select insurers and credit cards offered some cushion. Banks were mostly down, with regionals particularly weak. Industrials underperformed, with transports a drag. Machinery and multis were generally weaker as well, though there was a bit of strength in some defense and waste-related names. Communication services lagged, with media and entertainment broadly down. The megacap internets were down as well but TWTR +17.6% was a big gainer after Elon Musk announced a stake and was added to the board. Autos and suppliers weighed on consumer discretionary. Homebuilders, casual diners, hotels, casinos, and cruise lines were weaker as well. Specialty retailers had a better week. Tech trailed the market this week, with the megacap down and semiconductors broadly weaker.
Table of Contents
Fixed Income
FOMC Minutes Credit, Liquidity and Balance Sheet Federal Reserve Dot Plots
US Corporate Debt Tops 7 Trillion. Treasury.gov yields FOMC Policy Normalization Statement Longer Run Goals August 2020
Foreign Exchange Market
Energy Complex
The Baker Hughes rig count gained 16 this week. There are 689 oil and gas rigs operating in the US – Up 257 over last year.
Metals Complex
Employment Picture
Weekly Unemployment Claims – Released Thursday 4/7/2022 – The week ending April 2nd observed a decrease of 5k in initial claims decreasing to 166k. The four-week moving average of initial jobless claims decreased 8k to 170k.
March Jobs Report – BLS Summary Released 4/1/2022 – The US Economy added 431k nonfarm jobs in March and the Unemployment rate declined to 3.6%. Average hourly earnings increased 13 to $31.73. Hiring highlights include+112k Leisure and Hospitality, +102k Professional and Business Services, +53k Education and Health Services, and +49k Retail Trade.
Job Openings & Labor Turnover Survey JOLTS – Released 3/29/2022 – The U.S. Bureau of Labor Statistics reported the number and rate of job openings was little changed at 11.3 million on the last business day of February. Over the month, hires increased 6.7 million and separations were little changed at 6.1 million. Within separations, the quits rate was little changed at 2.9%. The layoffs and discharges rates were unchanged at 0.9%.
Employment Cost Index – Released 1/28/2022 – Compensation costs for civilian workers increased 1.0% for the 3-month period ending in December 2021. The 12-month period ending in December 2021 saw compensation costs increase by 4.0%. The 12-month period ending December 2020 increased 2.5%. Wages and salaries increased 4.5 percent over the year and increased 2.6 percent for the 12-month period ending in December 2020. Benefit costs increased 2.8 percent over the year and increased 2.3 percent for the 12-month period ending in December 2020. This report is published quarterly.
This Week’s Economic Data
Links take you to the data source
Consumer Credit – Released 4/7/2022 – Consumer credit increased at a seasonally adjusted annual rate of 11.3 percent in February. Revolving credit increased at an annual rate of 20.7 percent, while nonrevolving credit increased at an annual rate of 8.4 percent.
U.S. Trade Balance – Released 4/5/2022 – According to the U.S. Census Bureau of Economic Analysis the goods and services deficit decreased in February by $0.1 billion to $89.2 billion. February exports were $228.6 billion, $4.1 billion more than January exports. February imports were $317.8 billion, $4.1 billion more than January imports. Year-over-year, the goods and services deficit increased $45.7 billion, or 34.5 percent, from the same period in 2021. Exports increased $68.0 billion or 17.6 percent. Imports increased $113.7 billion or 22.0 percent.
PMI Non-Manufacturing Index – Released 4/5/2022 – Economic activity in the non-manufacturing sector grew in March for the 22nd consecutive month. ISM Non-Manufacturing registered 58.3 percent, which is 1.8 percentage points above the February reading of 56.5 percent.
Recent Economic Data
Links take you to the data source
PMI Manufacturing Index – Released 4/1/2022 – March PMI decreased 1.5% to 57.1% down from February’s reading of 58.6%. The New Orders Index was 53.8% down 7.9% from February’s reading of 61.7%. The Production Index registered 54.5%, down 4.0%.
U.S. Construction Spending – Released 4/1/2022 – Construction spending increased 0.5% in February measuring at a seasonally adjusted annual rate of $1,704.4 billion. The February figure is 11.2% above the February 2021 estimate. Private construction spending was 0.8% above the revised January estimate at $1,343.4 billion. Public construction spending was 0.4% below the revised January estimate at $350.7 billion.
Chicago PMI – Released 3/31/2022 – Chicago PMI increased by 6.6 points in March to 62.9. All five of the main five indicators increased.
US Light Vehicle Sales – Released 3/31/2022 – U.S. light vehicle sales were at a seasonally adjusted annual rate (SAAR) of 14.030 million units in February.
Personal Income – Released 3/31/2022 – Personal income increased $101.5 billion or 0.5 percent in February according to estimates released today by the Bureau of Economic Analysis. Disposable personal income (DPI) increased $76.1 billion or 0.4 percent and personal consumption expenditures (PCE) increased $34.9 billion or 0.2 percent.
Third Estimate of 4th Quarter 2021 GDP – Released 3/30/2022 – Real gross domestic product (GDP) increased at an annual rate of 6.9 percent in the fourth quarter of 2021, according to the third estimate released by the Bureau of Economic Analysis. GDP increased 2.3 percent in the third quarter of 2021. The third estimate is based on source data that are more complete than that of the second and advance estimates. The increase in real GDP primarily reflected increases in private inventory investment, exports, personal consumption expenditures (PCE), and nonresidential fixed investment that were partly offset by decreases in both federal and state and local government spending. Imports, which are a subtraction in the calculation of GDP, increased. The updated estimates primarily reflected upward revisions to nonresidential fixed investment, state and local government spending, and residential fixed investment that were partly offset by downward revisions to personal consumption expenditures (PCE) and exports. The downward revision in the third estimate primarily reflected downward revisions to personal consumption expenditures (PCE) and exports that were partly offset by an upward revision to private inventory investment.
Consumer Confidence – Released 3/29/2022 – The Consumer confidence index increased in March following a decrease in February. The Index now stands at 107.2, up from 105.7 in February.
Durable Goods – Released 3/24/2022 – New orders for manufactured durable goods in February decreased $6.0 billion or 2.2% to $271.5 billion. Transportation equipment led the decrease falling $4.9 billion or 5.6% to $82.6 billion.
New Residential Sales – Released 3/23/2022 – Sales of new single-family homes decreased 2.0% to 772k, seasonally adjusted, in February. The median sales price of new homes sold in February was $400,600 with an average sales price of $511,000. At the end of February, the seasonally adjusted estimate of new homes for sale was 407k. This represents a supply of 6.3 months at the current sales rate.
Existing Home Sales – Released 3/18/2022 – Existing home sales decreased in February following an increase in January. Sales declined 7.2% to a seasonally adjusted rate of 6.02 million in February. Sales decreased 2.4% year-over-year. Housing inventory sits at 870k units. Up 2.4% from January’s inventory. Down 15.5% over last year. Unsold inventory sits at a 1.7-month supply. The median existing home price for all housing types was $357,300 which is up 15.0% from February 2021. This marks 120 consecutive months of year-over-year increases, the longest-running streak on record.
Housing Starts – Released 3/17/2022 – New home starts in February were at a seasonally adjusted annual rate of 1.769 million; up 6.8% above January, and 22.3% above last January’s rate. Building Permits were at a seasonally adjusted annual rate of 1.859 million, down 1.9% compared to January, but up 7.7% over last year.
Industrial Production and Capacity Utilization – Released 3/17/2022 – In February Industrial production increased 0.5%. Manufacturing increased 1.2%. Utilities output declined 2.7%. Mining output increased 0.1%. Total industrial production was 7.5% higher in February than a year ago. Total capacity utilization increased 0.3% to 77.6% in February which is 1.9% below its long run average.
Retail Sales – Released 3/16/2022 – U.S. retail sales for February increased 0.3% to $658.1 billion and retail sales are 17.6% above February 2021. U.S. retail sales for the December 2021 through February 2022 period were up 16.0% from the same period a year ago.
Producer Price Index – Released 3/15/2022 – The Producer Price Index for final demand increased 0.8% in February. PPI less food and energy increased 0.7%. The change in PPI for final demand has increased 10.0% year/y.
Consumer Price Index – Released 3/10/2022 – Consumer prices rose 0.8% m/m in February following a 0.6% gain in January. Consumer prices are up 7.9% for the 12-month period ending in February. Core consumer prices increased 0.5% m/m in February following a 0.6% gain in January.
Next week we get data on CPI, PPI, Retail Sales, Industrial Production and Capacity Utilization.
Data Sources:
Bureau of Economic Analysis (BEA)
Congressional Budget Office (CBO)
U.S. Bureau of Labor Statistics (BLS)
Federal Reserve Economic Data (FRED Charts)
CME Fed Watch
U.S. Treasury – Yields
U.S. Census Bureau
Institute for Supply Management (ISM)
Weekly DOL Employment Data
BLS Monthly Jobs Report
JOLTS
US Energy Admin (EIA)
BLS Consumer Price Index CPI
BLS Producer Price Index PPI
Atlanta Fed GDPNOW
NY Fed Nowcast GDP
US Census Bureau Housing Starts
Consumer Credit
USCB Retail Sales
Construction Spending
Federal Reserve Dot Plots
NY Empire Index
Philadelphia Federal Reserve
P/E Ratio Data -Yardeni Research
Technical Analysis Info:
StockCharts.com – Financial Charts
Exponential vs Simple moving average
Other Links:
1973 Arab Oil Embargo
Hunt Brothers Silver
Long-Term Capital bailout
Categories:
Tags: