Good Life Advisors – Talking Points – Week 17
“You’re Not Paranoid If They Really Are After You”
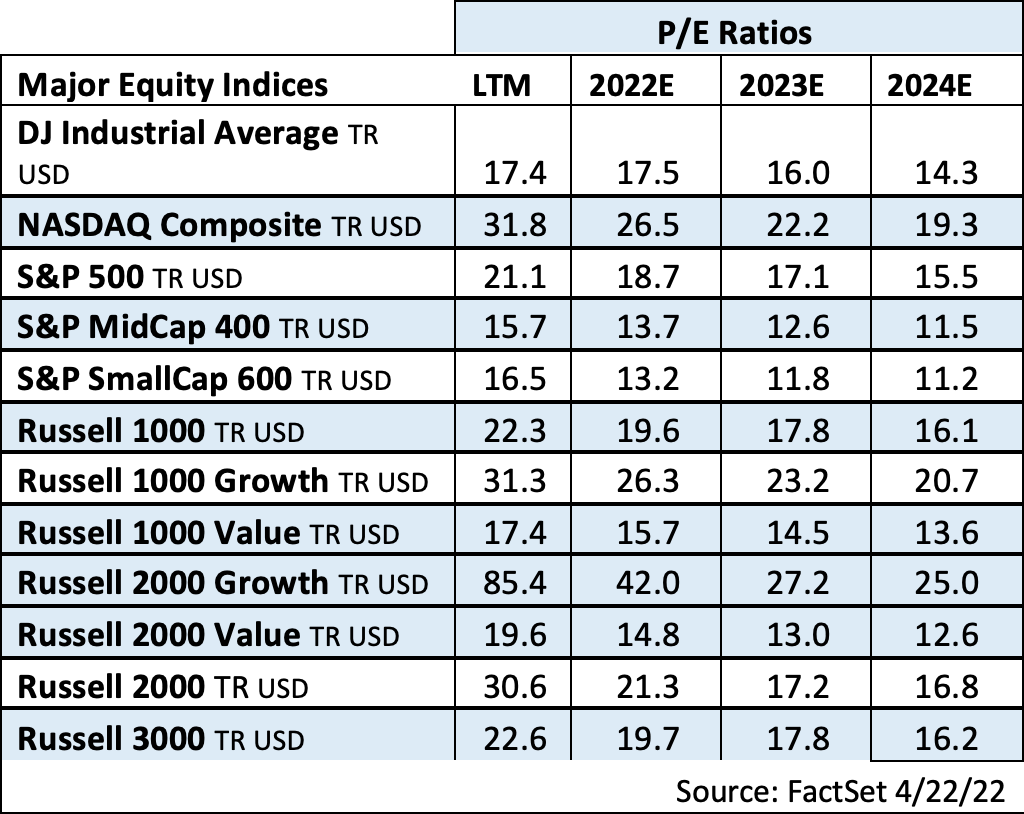
Selling is gaining strength and that Catch 22 quote feels right this week. We’re approaching the two-month mark of the Russian invasion of Ukraine. At the same time the Federal Reserve is about to reverse unprecedented quantitative easing to combat inflation. China’s zero covid policy is snuffing out production and supply chain snags are everywhere. Fundamentally, P/E ratios are still elevated (even after this drawdown) and we go into this earnings season with lowered expectations after the prior four quarters of 30%+ eps growth. Technically, all the major indexes are trading below their 20-, 50- and 200-day moving averages (except R1k value). The hits keep coming and in the short term, the markets path of least resistance feels lower.
The week’s slide was broadly attributed to increasingly hawkish central-bank commentary by the Fed and the ECB that provided the impetus for another bout of higher Treasury yields and pushed the real yield on the 10Y TIPS back into positive territory for the first time in two years (and served to weaken the TINA mantra). There was some characterization of Powell “blessing” a 50bp rate hike in May (already the consensus), and analysts noted an uptick in chatter about a possible 75bp hike at a future meeting–which would be the largest single-meeting hike since 1994. The heightened concern comes as the market continues to factor in weak bullish sentiment, another week of big equity outflows, and ongoing strength in the dollar. But on the flip side, Q1 earnings are thus far outpacing expectations, though the bar is also somewhat lower. While earnings calls remain replete with references to cost pressures and supply chain challenges, demand commentary has been positive on the whole, with airlines in particular benefiting from the economic normalization theme.
Bond yields continued to rise this week with the UST 2 year gaining 27bp to close at 2.72%. TIPS were the only fixed income gainer this week while the US agg fell another 1%. The dollar had another strong week with the DXY gaining 0.9% and remaining on track for its best month since November 2016. The dollar was particularly strong vs the yen and sterling. Gold was weaker, declining by 2.1%. WTI crude was down 4.6%, with continued worries about Covid-depressed China demand playing into the narrative.
Equities indexes were down across the board, only two sectors, staples and real estate were positive for the week. Mids, smalls and value were all relative outperformers while energy fared the worst.

Fixed Income
FOMC Minutes Credit, Liquidity and Balance Sheet Federal Reserve Dot Plots
US Corporate Debt Tops 7 Trillion. Treasury.gov yields FOMC Policy Normalization Statement Longer Run Goals August 2020
Foreign Exchange Market
Energy Complex
The Baker Hughes rig count gained 2 this week. There are 695 oil and gas rigs operating in the US – Up 257 over last year.
Metals Complex
Employment Picture
Weekly Unemployment Claims – Released Thursday 4/21/2022 – The week ending April 16th observed a decrease of 2k in initial claims decreasing to 184k. The four-week moving average of initial jobless claims increased 4.5k to 177.25k.
March Jobs Report – BLS Summary Released 4/1/2022 – The US Economy added 431k nonfarm jobs in March and the Unemployment rate declined to 3.6%. Average hourly earnings increased 13 to $31.73. Hiring highlights include +112k Leisure and Hospitality, +102k Professional and Business Services, +53k Education and Health Services, and +49k Retail Trade.
- Average hourly earnings increased 13 cents to $31.73.
- U3 unemployment rate declined 0.2% to 3.6%. U6 unemployment rate declined to 6.9%.
- The labor force participation rate was little changed at 62.4%.
- Average work week fell 0.1 hour to 34.6 hours.
Job Openings & Labor Turnover Survey JOLTS – Released 3/29/2022 – The U.S. Bureau of Labor Statistics reported the number and rate of job openings was little changed at 11.3 million on the last business day of February. Over the month, hires increased 6.7 million and separations were little changed at 6.1 million. Within separations, the quits rate was little changed at 2.9%. The layoffs and discharges rates were unchanged at 0.9%.
Employment Cost Index – Released 1/28/2022 – Compensation costs for civilian workers increased 1.0% for the 3-month period ending in December 2021. The 12-month period ending in December 2021 saw compensation costs increase by 4.0%. The 12-month period ending December 2020 increased 2.5%. Wages and salaries increased 4.5 percent over the year and increased 2.6 percent for the 12-month period ending in December 2020. Benefit costs increased 2.8 percent over the year and increased 2.3 percent for the 12-month period ending in December 2020. This report is published quarterly.
This Week’s Economic Data
Links take you to the data source
Existing Home Sales – Released 4/20/2022 – Existing home sales decreased in March following a decrease in February. Sales declined 2.7% to a seasonally adjusted rate of 5.77 million in March. Sales decreased 4.5% year-over-year. Housing inventory sits at 950k units. Up 11.8% from February’s inventory. Down 9.5% over last year. Unsold inventory sits at a 1.7-month supply. The median existing home price for all housing types was $375,300 which is up 15.0% from March 2021. This marks 121 consecutive months of year-over-year increases, the longest-running streak on record.
Housing Starts – Released 4/19/2022 – New home starts in March were at a seasonally adjusted annual rate of 1.793 million; up 0.3% above February, and 3.9% above last March’s rate. Building Permits were at a seasonally adjusted annual rate of 1.865 million, up 0.4% compared to February, but up 6.7% over last year.
Recent Economic Data
Links take you to the data source
Industrial Production and Capacity Utilization – Released 4/15/2022 – In March Industrial production increased 0.9%. Manufacturing increased 0.9%. Utilities output increased 0.4%. Mining output increased 1.7%. Total industrial production was 5.5% higher in March than a year ago. Total capacity utilization increased 0.7% to 78.3% in March which is 1.2% below its long run average.
Retail Sales – Released 4/14/2022 – U.S. retail sales for March increased 0.5% to $665.7 billion and retail sales are 6.9% above March 2021. U.S. retail sales for the January 2022 through March 2022 period were up 12.9% from the same period a year ago.
Producer Price Index – Released 4/13/2022 – The Producer Price Index for final demand increased 1.4% in March. PPI less food and energy increased 1.1%. The change in PPI for final demand has increased 11.2% year/y.
Consumer Price Index – Released 4/12/2022 – Consumer prices rose 1.2% m/m in March following a 0.8% gain in February. Consumer prices are up 8.5% for the 12-month period ending in March. Core consumer prices increased 0.3% m/m in March following a 0.5% gain in February.
Consumer Credit – Released 4/7/2022 – Consumer credit increased at a seasonally adjusted annual rate of 11.3 percent in February. Revolving credit increased at an annual rate of 20.7 percent, while nonrevolving credit increased at an annual rate of 8.4 percent.
U.S. Trade Balance – Released 4/5/2022 – According to the U.S. Census Bureau of Economic Analysis the goods and services deficit decreased in February by $0.1 billion to $89.2 billion. February exports were $228.6 billion, $4.1 billion more than January exports. February imports were $317.8 billion, $4.1 billion more than January imports. Year-over-year, the goods and services deficit increased $45.7 billion, or 34.5 percent, from the same period in 2021. Exports increased $68.0 billion or 17.6 percent. Imports increased $113.7 billion or 22.0 percent.
PMI Non-Manufacturing Index – Released 4/5/2022 – Economic activity in the non-manufacturing sector grew in March for the 22nd consecutive month. ISM Non-Manufacturing registered 58.3 percent, which is 1.8 percentage points above the February reading of 56.5 percent.
PMI Manufacturing Index – Released 4/1/2022 – March PMI decreased 1.5% to 57.1% down from February’s reading of 58.6%. The New Orders Index was 53.8% down 7.9% from February’s reading of 61.7%. The Production Index registered 54.5%, down 4.0%.
U.S. Construction Spending – Released 4/1/2022 – Construction spending increased 0.5% in February measuring at a seasonally adjusted annual rate of $1,704.4 billion. The February figure is 11.2% above the February 2021 estimate. Private construction spending was 0.8% above the revised January estimate at $1,343.4 billion. Public construction spending was 0.4% below the revised January estimate at $350.7 billion.
Chicago PMI – Released 3/31/2022 – Chicago PMI increased by 6.6 points in March to 62.9. All five of the main five indicators increased.
US Light Vehicle Sales – Released 3/31/2022 – U.S. light vehicle sales were at a seasonally adjusted annual rate (SAAR) of 14.030 million units in February.
Personal Income – Released 3/31/2022 – Personal income increased $101.5 billion or 0.5 percent in February according to estimates released today by the Bureau of Economic Analysis. Disposable personal income (DPI) increased $76.1 billion or 0.4 percent and personal consumption expenditures (PCE) increased $34.9 billion or 0.2 percent.
Third Estimate of 4th Quarter 2021 GDP – Released 3/30/2022 – Real gross domestic product (GDP) increased at an annual rate of 6.9 percent in the fourth quarter of 2021, according to the third estimate released by the Bureau of Economic Analysis. GDP increased 2.3 percent in the third quarter of 2021. The third estimate is based on source data that are more complete than that of the second and advance estimates. The increase in real GDP primarily reflected increases in private inventory investment, exports, personal consumption expenditures (PCE), and nonresidential fixed investment that were partly offset by decreases in both federal and state and local government spending. Imports, which are a subtraction in the calculation of GDP, increased. The updated estimates primarily reflected upward revisions to nonresidential fixed investment, state and local government spending, and residential fixed investment that were partly offset by downward revisions to personal consumption expenditures (PCE) and exports. The downward revision in the third estimate primarily reflected downward revisions to personal consumption expenditures (PCE) and exports that were partly offset by an upward revision to private inventory investment.
Consumer Confidence – Released 3/29/2022 – The Consumer confidence index increased in March following a decrease in February. The Index now stands at 107.2, up from 105.7 in February.
Durable Goods – Released 3/24/2022 – New orders for manufactured durable goods in February decreased $6.0 billion or 2.2% to $271.5 billion. Transportation equipment led the decrease falling $4.9 billion or 5.6% to $82.6 billion.
New Residential Sales – Released 3/23/2022 – Sales of new single-family homes decreased 2.0% to 772k, seasonally adjusted, in February. The median sales price of new homes sold in February was $400,600 with an average sales price of $511,000. At the end of February, the seasonally adjusted estimate of new homes for sale was 407k. This represents a supply of 6.3 months at the current sales rate.
Next week we get data on New Residential Sales, Durable Goods, Consumer Confidence, the Advance Estimate of 1st Quarter 2022 GDP, Personal Income, Chicago PMI, and the Employment Cost Index.
Data Sources:
Bureau of Economic Analysis (BEA)
Congressional Budget Office (CBO)
U.S. Bureau of Labor Statistics (BLS)
Federal Reserve Economic Data (FRED Charts)
CME Fed Watch
U.S. Treasury – Yields
U.S. Census Bureau
Institute for Supply Management (ISM)
Weekly DOL Employment Data
BLS Monthly Jobs Report
JOLTS
US Energy Admin (EIA)
BLS Consumer Price Index CPI
BLS Producer Price Index PPI
Atlanta Fed GDPNOW
NY Fed Nowcast GDP
US Census Bureau Housing Starts
Consumer Credit
USCB Retail Sales
Construction Spending
Federal Reserve Dot Plots
NY Empire Index
Philadelphia Federal Reserve
P/E Ratio Data -Yardeni Research
Technical Analysis Info:
StockCharts.com – Financial Charts
Exponential vs Simple moving average
Other Links:
1973 Arab Oil Embargo
Hunt Brothers Silver
Long-Term Capital bailout


Week 16 Talking Points
Good Life Advisors – Talking Points – Week 17
“You’re Not Paranoid If They Really Are After You”
Selling is gaining strength and that Catch 22 quote feels right this week. We’re approaching the two-month mark of the Russian invasion of Ukraine. At the same time the Federal Reserve is about to reverse unprecedented quantitative easing to combat inflation. China’s zero covid policy is snuffing out production and supply chain snags are everywhere. Fundamentally, P/E ratios are still elevated (even after this drawdown) and we go into this earnings season with lowered expectations after the prior four quarters of 30%+ eps growth. Technically, all the major indexes are trading below their 20-, 50- and 200-day moving averages (except R1k value). The hits keep coming and in the short term, the markets path of least resistance feels lower.
The week’s slide was broadly attributed to increasingly hawkish central-bank commentary by the Fed and the ECB that provided the impetus for another bout of higher Treasury yields and pushed the real yield on the 10Y TIPS back into positive territory for the first time in two years (and served to weaken the TINA mantra). There was some characterization of Powell “blessing” a 50bp rate hike in May (already the consensus), and analysts noted an uptick in chatter about a possible 75bp hike at a future meeting–which would be the largest single-meeting hike since 1994. The heightened concern comes as the market continues to factor in weak bullish sentiment, another week of big equity outflows, and ongoing strength in the dollar. But on the flip side, Q1 earnings are thus far outpacing expectations, though the bar is also somewhat lower. While earnings calls remain replete with references to cost pressures and supply chain challenges, demand commentary has been positive on the whole, with airlines in particular benefiting from the economic normalization theme.
Bond yields continued to rise this week with the UST 2 year gaining 27bp to close at 2.72%. TIPS were the only fixed income gainer this week while the US agg fell another 1%. The dollar had another strong week with the DXY gaining 0.9% and remaining on track for its best month since November 2016. The dollar was particularly strong vs the yen and sterling. Gold was weaker, declining by 2.1%. WTI crude was down 4.6%, with continued worries about Covid-depressed China demand playing into the narrative.
Equities indexes were down across the board, only two sectors, staples and real estate were positive for the week. Mids, smalls and value were all relative outperformers while energy fared the worst.
Table of Contents
Fixed Income
FOMC Minutes Credit, Liquidity and Balance Sheet Federal Reserve Dot Plots
US Corporate Debt Tops 7 Trillion. Treasury.gov yields FOMC Policy Normalization Statement Longer Run Goals August 2020
Foreign Exchange Market
Energy Complex
The Baker Hughes rig count gained 2 this week. There are 695 oil and gas rigs operating in the US – Up 257 over last year.
Metals Complex
Employment Picture
Weekly Unemployment Claims – Released Thursday 4/21/2022 – The week ending April 16th observed a decrease of 2k in initial claims decreasing to 184k. The four-week moving average of initial jobless claims increased 4.5k to 177.25k.
March Jobs Report – BLS Summary Released 4/1/2022 – The US Economy added 431k nonfarm jobs in March and the Unemployment rate declined to 3.6%. Average hourly earnings increased 13 to $31.73. Hiring highlights include +112k Leisure and Hospitality, +102k Professional and Business Services, +53k Education and Health Services, and +49k Retail Trade.
Job Openings & Labor Turnover Survey JOLTS – Released 3/29/2022 – The U.S. Bureau of Labor Statistics reported the number and rate of job openings was little changed at 11.3 million on the last business day of February. Over the month, hires increased 6.7 million and separations were little changed at 6.1 million. Within separations, the quits rate was little changed at 2.9%. The layoffs and discharges rates were unchanged at 0.9%.
Employment Cost Index – Released 1/28/2022 – Compensation costs for civilian workers increased 1.0% for the 3-month period ending in December 2021. The 12-month period ending in December 2021 saw compensation costs increase by 4.0%. The 12-month period ending December 2020 increased 2.5%. Wages and salaries increased 4.5 percent over the year and increased 2.6 percent for the 12-month period ending in December 2020. Benefit costs increased 2.8 percent over the year and increased 2.3 percent for the 12-month period ending in December 2020. This report is published quarterly.
This Week’s Economic Data
Links take you to the data source
Existing Home Sales – Released 4/20/2022 – Existing home sales decreased in March following a decrease in February. Sales declined 2.7% to a seasonally adjusted rate of 5.77 million in March. Sales decreased 4.5% year-over-year. Housing inventory sits at 950k units. Up 11.8% from February’s inventory. Down 9.5% over last year. Unsold inventory sits at a 1.7-month supply. The median existing home price for all housing types was $375,300 which is up 15.0% from March 2021. This marks 121 consecutive months of year-over-year increases, the longest-running streak on record.
Housing Starts – Released 4/19/2022 – New home starts in March were at a seasonally adjusted annual rate of 1.793 million; up 0.3% above February, and 3.9% above last March’s rate. Building Permits were at a seasonally adjusted annual rate of 1.865 million, up 0.4% compared to February, but up 6.7% over last year.
Recent Economic Data
Links take you to the data source
Industrial Production and Capacity Utilization – Released 4/15/2022 – In March Industrial production increased 0.9%. Manufacturing increased 0.9%. Utilities output increased 0.4%. Mining output increased 1.7%. Total industrial production was 5.5% higher in March than a year ago. Total capacity utilization increased 0.7% to 78.3% in March which is 1.2% below its long run average.
Retail Sales – Released 4/14/2022 – U.S. retail sales for March increased 0.5% to $665.7 billion and retail sales are 6.9% above March 2021. U.S. retail sales for the January 2022 through March 2022 period were up 12.9% from the same period a year ago.
Producer Price Index – Released 4/13/2022 – The Producer Price Index for final demand increased 1.4% in March. PPI less food and energy increased 1.1%. The change in PPI for final demand has increased 11.2% year/y.
Consumer Price Index – Released 4/12/2022 – Consumer prices rose 1.2% m/m in March following a 0.8% gain in February. Consumer prices are up 8.5% for the 12-month period ending in March. Core consumer prices increased 0.3% m/m in March following a 0.5% gain in February.
Consumer Credit – Released 4/7/2022 – Consumer credit increased at a seasonally adjusted annual rate of 11.3 percent in February. Revolving credit increased at an annual rate of 20.7 percent, while nonrevolving credit increased at an annual rate of 8.4 percent.
U.S. Trade Balance – Released 4/5/2022 – According to the U.S. Census Bureau of Economic Analysis the goods and services deficit decreased in February by $0.1 billion to $89.2 billion. February exports were $228.6 billion, $4.1 billion more than January exports. February imports were $317.8 billion, $4.1 billion more than January imports. Year-over-year, the goods and services deficit increased $45.7 billion, or 34.5 percent, from the same period in 2021. Exports increased $68.0 billion or 17.6 percent. Imports increased $113.7 billion or 22.0 percent.
PMI Non-Manufacturing Index – Released 4/5/2022 – Economic activity in the non-manufacturing sector grew in March for the 22nd consecutive month. ISM Non-Manufacturing registered 58.3 percent, which is 1.8 percentage points above the February reading of 56.5 percent.
PMI Manufacturing Index – Released 4/1/2022 – March PMI decreased 1.5% to 57.1% down from February’s reading of 58.6%. The New Orders Index was 53.8% down 7.9% from February’s reading of 61.7%. The Production Index registered 54.5%, down 4.0%.
U.S. Construction Spending – Released 4/1/2022 – Construction spending increased 0.5% in February measuring at a seasonally adjusted annual rate of $1,704.4 billion. The February figure is 11.2% above the February 2021 estimate. Private construction spending was 0.8% above the revised January estimate at $1,343.4 billion. Public construction spending was 0.4% below the revised January estimate at $350.7 billion.
Chicago PMI – Released 3/31/2022 – Chicago PMI increased by 6.6 points in March to 62.9. All five of the main five indicators increased.
US Light Vehicle Sales – Released 3/31/2022 – U.S. light vehicle sales were at a seasonally adjusted annual rate (SAAR) of 14.030 million units in February.
Personal Income – Released 3/31/2022 – Personal income increased $101.5 billion or 0.5 percent in February according to estimates released today by the Bureau of Economic Analysis. Disposable personal income (DPI) increased $76.1 billion or 0.4 percent and personal consumption expenditures (PCE) increased $34.9 billion or 0.2 percent.
Third Estimate of 4th Quarter 2021 GDP – Released 3/30/2022 – Real gross domestic product (GDP) increased at an annual rate of 6.9 percent in the fourth quarter of 2021, according to the third estimate released by the Bureau of Economic Analysis. GDP increased 2.3 percent in the third quarter of 2021. The third estimate is based on source data that are more complete than that of the second and advance estimates. The increase in real GDP primarily reflected increases in private inventory investment, exports, personal consumption expenditures (PCE), and nonresidential fixed investment that were partly offset by decreases in both federal and state and local government spending. Imports, which are a subtraction in the calculation of GDP, increased. The updated estimates primarily reflected upward revisions to nonresidential fixed investment, state and local government spending, and residential fixed investment that were partly offset by downward revisions to personal consumption expenditures (PCE) and exports. The downward revision in the third estimate primarily reflected downward revisions to personal consumption expenditures (PCE) and exports that were partly offset by an upward revision to private inventory investment.
Consumer Confidence – Released 3/29/2022 – The Consumer confidence index increased in March following a decrease in February. The Index now stands at 107.2, up from 105.7 in February.
Durable Goods – Released 3/24/2022 – New orders for manufactured durable goods in February decreased $6.0 billion or 2.2% to $271.5 billion. Transportation equipment led the decrease falling $4.9 billion or 5.6% to $82.6 billion.
New Residential Sales – Released 3/23/2022 – Sales of new single-family homes decreased 2.0% to 772k, seasonally adjusted, in February. The median sales price of new homes sold in February was $400,600 with an average sales price of $511,000. At the end of February, the seasonally adjusted estimate of new homes for sale was 407k. This represents a supply of 6.3 months at the current sales rate.
Next week we get data on New Residential Sales, Durable Goods, Consumer Confidence, the Advance Estimate of 1st Quarter 2022 GDP, Personal Income, Chicago PMI, and the Employment Cost Index.
Data Sources:
Bureau of Economic Analysis (BEA)
Congressional Budget Office (CBO)
U.S. Bureau of Labor Statistics (BLS)
Federal Reserve Economic Data (FRED Charts)
CME Fed Watch
U.S. Treasury – Yields
U.S. Census Bureau
Institute for Supply Management (ISM)
Weekly DOL Employment Data
BLS Monthly Jobs Report
JOLTS
US Energy Admin (EIA)
BLS Consumer Price Index CPI
BLS Producer Price Index PPI
Atlanta Fed GDPNOW
NY Fed Nowcast GDP
US Census Bureau Housing Starts
Consumer Credit
USCB Retail Sales
Construction Spending
Federal Reserve Dot Plots
NY Empire Index
Philadelphia Federal Reserve
P/E Ratio Data -Yardeni Research
Technical Analysis Info:
StockCharts.com – Financial Charts
Exponential vs Simple moving average
Other Links:
1973 Arab Oil Embargo
Hunt Brothers Silver
Long-Term Capital bailout
Categories:
Tags: