Good Life Advisors – Talking Points – Week 10
Reasons for Negative Sentiment Just Keep Coming
So obviously the big story that’ll be plastered in the headlines this week is the FDIC takeover of Silicon Valley Bank and the possible contagion that could follow. An hour into Sunday night futures trading and it doesn’t appear that bad, (right this moment). In fact, at the time of this writing futures are actually up around a percent. This is primarily due to the Federal Reserve and the Treasury Departments announcement Sunday night the creation of a new facility to backstop bank deposits. Regulators announced the moves in a joint statement from Treasury Secretary Janet Yellen, Fed Chair Jerome Powell and FDIC. The group said that depositors at SVB and another closed bank (Signature) would have access to all of their money on Monday. This is just icing on the worry cake. We have inflation, debt ceiling limits, high valuations, falling earnings, a proxy war with Russia and a growing treat from China, now add bank failures to the list. It’s completely possible that the SVB/ Signature failures were caused by reckless risk controls and will be contained to a handful of names. It is also possible that the fall out grows. At the moment it looks like the Fed backstop will provide market participant enough trust in the system to prevent a true run on the banks.
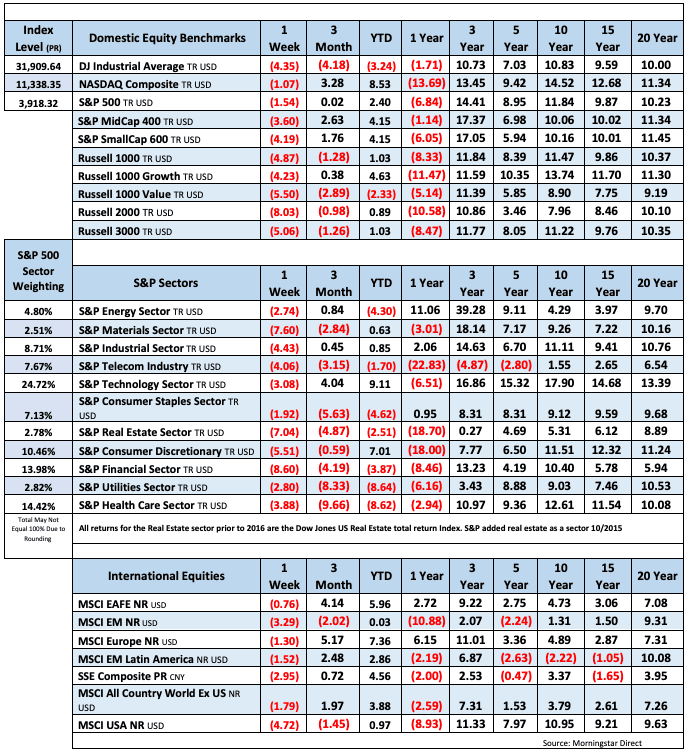
US equities were lower this week, with the S&P positing the worst weekly performance since September and Nasdaq since November, while the small-cap Russell 2000 posted the worst week since Jan-22. All sectors were down with banks the big decliner for the week amid the SVB Financial failure. The KBW Bank Index BKX -15.7% posted the worst weekly performance since Mar-20 (-18.8%), with some acute weakness across other names deemed risky. Insurance, fund and asset managers were also among the worst performance in financials. Discretionary groups broadly weaker including retail (XRT -6.1%), autos, and travel and leisure. Homebuilders (XHB -4.9%) were a slight underperformer despite the rate tailwind. Cyclicals were broadly weaker including transports, building materials, and construction and engineering, though semis (SOX -3.5%) were a relative outperformer. Commodity-linked groups were broadly weaker including industrial metals and agricultural chemicals. Energy was a laggard as crude sold off on recession fears, with E&Ps and oilfield services among the worst groups. FANMAG complex was broadly in line, though cloud, cybersecurity, and payments underperformed. Some of the relative outperformers included defensives and flight-to-safety groups like grocers, convenience stores, beverages, precious metals miners, and large cap pharma. Treasuries rallied across the curve with some curve steepening, with Friday’s strength counting for the bulk of the gains. The dollar index was little changed for the week, with some weakness on the yen cross but slight gains on the euro and sterling crosses. Gold finished the week up 0.7%. WTI crude was down 3.8% for the week
The biggest story of the week before SVB was the volatility around Fed rate path expectations. Into Friday, 2Y yields made the biggest downward two-day move since 9/11 and Black Monday in 1987. The market pricing for peak fed funds rate was nearly 5.80% after Fed Chair Powell’s appearance in front of the Senate Banking Committee on Tuesday, though fell to around 5.25% by Friday afternoon. At his Tuesday appearance, Powell said that if data indicate that faster tightening is warranted, the Fed is prepared to increase the pace of rate hikes (FT). Powell’s comments pushed pricing for a 50 bp hike in the March FOMC meeting (22-Mar) to around 80%. However, the odds fell to under 40% by Friday amid a batch of labor market data, as well as recession and financial system concerns. Thursday’s initial jobless claims report came in higher than expected, while continuing claims tied for the highest print since Jan-22 (Bloomberg). Friday’s February nonfarm payrolls report showed a headline print of 311K, higher than consensus for 215K. However, average hourly earnings growth cooler than expected, up 0.2% m/m, down from January 0.3% and below consensus for 0.4%, trends which economists said lessened fears of labor market overheating (FT). A number of Street economists reiterated calls for a 25 bp hike in March, though noted risk remains to the upside pending Tuesday’s CPI report and other key data ahead of the meeting.
The Treasury rally was also driven by some flight-to-safety dynamics and recession fears. Thursday’s selloff was driven in part by bank updates that played into concerns around the cumulative impact of the fed tightening cycle. SVB Financial was taken over by US regulators on Friday, the second-largest bank failure since the 2008 collapse of Washington Mutual (FT). The failure came after concerns around its balance sheet after the value of its portfolio of mortgage bonds and US Treasuries fell by $15B amid the Fed rate hike cycle. The bank hoped to raise $2.25B of capital to cover those losses, but on Friday instead moved to explore a potential sale. The situation magnified other financial sector concerns including bank balance sheets, liquidity and funding pressures, higher deposit beta headwinds on NII, securities losses, private company valuations, credit deterioration (particularly in CRE), and the heightened potential for a systemic/credit event. However, some sell-side analysts said SVB’s issues were idiosyncratic. Wells Fargo analysts said that SVB was a worst case, and that the failure was driven by a lack of diversification given reliance on VCs. Morgan Stanley analysts also said that they don’t believe there’s a liquidity crunch facing the banking industry. Instead, the issue is the rising cost of liquidity, which will likely remain a headwind to NIM, revenue, and EPS. However, Reuters noted that despite the “idiosyncratic” argument, there was a surge in options trades to protect against downside in banking stocks. The S&P Financials Sector fell by 8% for the week, the worst weekly performance for the sector since Jun-20. Elsewhere, crypto bank Silvergate announced it would voluntarily liquidate after weeks of customer withdrawals and a number of crypto trading platforms cutting business with the bank (FT).
In addition to the higher-for-longer fed rate risk, a key bearish argument remains the focus on curve inversion. The 2Y/10Y spread hit -110 bp this week, a fresh post-1981 low, before falling in the end of the week back toward -90 bp. Other bearish arguments include uncertainty around the disinflationary path, a still-tight labor market, technical dynamics with the S&P back below the 200 DMA after late-week selloff, and Washington drama, including this week’s updates on the Biden budget and debt ceiling (Bloomberg). There are still a few bullish arguments, including potential for an even flatter rate path than expected given some better labor market signals, seen in the dovish repricing this week. Some positive corporate trends were also highlighted this week, including strong retail demand and inventory trends (Yahoo! Finance), as well as a better semiconductor backdrop and China reopening momentum.
Next week brings another set of key reports that are seen as key catalysts headed into the March FOMC meeting. February CPI is out Tuesday (14-Feb). Previews noted upside risk after the Manheim Used Vehicle Value Index was up 4.3% in February, the biggest m/m increase since 2009. Bank of America economist said they still see core services to rise by 0.54% m/m on stronger shelter and non-shelter components, implying inflationary pressures are still only diminishing slowly. February PPI and retail sales are out Wednesday.
Fixed Income

Yield Curve
January FOMC Statement January Fed Minutes Balance Sheet Reduction Plan Credit, Liquidity and Balance Sheet Federal Reserve Dot Plots
Treasury.gov yields FOMC Policy Normalization Statement Longer- Run Goals Jan 2022
Foreign Exchange Market
Energy Complex
The Baker Hughes rig count was down by 3 this week. There are 746 oil and gas rigs operating in the US – Up 83 over last year.
Metals Complex
Employment Picture
February Jobs Report – BLS Summary – Released 3/10/2023 – The US Economy added 311k nonfarm jobs in February and the Unemployment rate increased 0.2% to 3.6%. Average hourly earnings increased 8 cents to $33.09. Hiring highlights include +105k Leisure and Hospitality, +74k Education and Health Services, +50k Retail Trade, +46 Government, and +45k Professional and Business Services.
- Average hourly earnings increased 8 cents/0.2% to $33.09.
- U3 unemployment rate increased 0.2% to 3.6%. U6 unemployment rate increased 0.2% to 6.8%.
- The labor force participation rate was little changed at 62.5%.
- Average work week decreased by 0.1 to 34.5 hours.
Weekly Unemployment Claims – Released Thursday 3/9/2023 – The week ending March 4th observed an increase of 21k in initial claims increasing to 211k. The four-week moving average of initial jobless claims was up by 4k to 197k.
Job Openings & Labor Turnover Survey JOLTS – Released 3/8/2023 – The number of job openings decreased to 10.8 million on the last business day of January, the U.S. Bureau of Labor Statistics reported. Over the month the number of hires and total separations changed little at 6.4 million and 5.9 million, respectively. Within separations, quits (3.9 million) and layoffs and discharges (1.7 million) increased.
Employment Cost Index – Released 1/31/2023 – Compensation costs for civilian workers increased 1.0% for the 3-month period ending in December 2022. The 12-month period ending on December 2022 saw compensation costs increase by 5.1%. The 12-month period ending December 2021 increased 4.0%. Wages and salaries increased 5.1 percent over the year and increased 4.5 percent for the 12-month period ending in December 2021. Benefit costs increased 4.9 percent over the year and increased 2.8 percent for the 12-month period ending in December 2021. This report is published quarterly.
This Week’s Economic Data
Links take you to the data source
U.S. Trade Balance – Released 3/8/2023 – The U.S. monthly international trade deficit increased in January 2023 according to the U.S. Bureau of Economic Analysis and the U.S. Census Bureau. The deficit increased from $67.2 billion in December (revised) to $68.3 billion in January. January exports were $257.5 billion, $8.5 billion more than December exports. January imports were $325.8 billion, $9.6 billion more than December imports. Year-over-year, the goods and services deficit decreased $19.2 billion, or 21.9 percent, from January 2022. Exports increased $30.2 billion or 13.3 percent. Imports increased $11.0 billion or 3.5 percent.
Consumer Credit – Released 3/7/2023 – In January, consumer credit increased at a seasonally adjusted annual rate of 3.7 percent. Revolving credit increased at an annual rate of 11.1 percent, while nonrevolving credit increased at an annual rate of 1.2 percent.
Recent Economic Date
Links take you to the data source
US Light Vehicle Sales – Released 3/3/2023 – U.S. light vehicle sales were at a seasonally adjusted annual rate (SAAR) of 14.886 million units in February.
PMI Non-Manufacturing Index – Released 3/3/2023 – Economic activity fell in February. The Services PMI® registered 55.1 percent, 0.1 percentage points lower than January. In January the Services PMI® registered 55.2 percent.
PMI Manufacturing Index – Released 3/1/2023 – The February Manufacturing PMI® registered 47.7 percent, 0.3 percentage point higher than the 47.4 percent recorded in January. Regarding the overall economy, this figure indicates three months of contraction following 30 months of expansion. The New Orders Index remained in contraction territory at 47.0 percent, 4.5 percentage points higher than the 42.5 percent recorded in January. The production index declined 0.7 percentage points to 47.3.
U.S. Construction Spending – Released 3/1/2023 – Construction spending during January 2023 was estimated at a seasonally adjusted annual rate of $1,825.7 billion, 0.1 percent below the revised December estimate of $1,827.5 billion. The January figure is 5.7 percent above the January 2022 estimate of $1,726.6 billion.
Chicago PMI – Released 2/28/2023 – Chicago PMI remained in contraction territory and decreased in February to 43.6 points down from 44.3 points in January. This is the lowest reading since November 2022 and marks six consecutive months in contractionary territory.
Consumer Confidence – Released 2/28/2023 – The Conference Board Consumer Confidence Index® decreased in February. The Index now stands at 102.9 (1985=100), down from 106.0 in January.
Durable Goods – Released 2/27/2023 – New orders for manufactured durable goods in January decreased $13.0 billion or 4.5% to $272.3 billion. Transportation equipment led the decrease down $14.2 billion or 13.3% to $92.8 billion.
Personal Income – Released 2/24/2023 – Personal income increased $131.1 billion, or 0.6 percent in January. Disposable Personal Income increased $387.4 billion or 2.0 percent. Personal Consumption Expenditure increased $312.5 billion or 1.8 percent.
New Residential Sales – Released 2/24/2023 – Sales of new single-family homes increased 7.2% to 670k, seasonally adjusted, in January. The median sales price of new homes sold in January was $427,500 with an average sales price of $474,400. At the end of January, the seasonally adjusted estimate of new homes for sale was 439k. This represents a supply of 7.9 months at the current sales rate.
Second Estimate of 4th Quarter 2022 GDP – Released 2/23/2023 – Real gross domestic product (GDP) increased at an annual rate of 2.7 percent in the fourth quarter of 2022 according to the second estimate released by the Bureau of Economic Analysis, following an increase of 3.2 percent in the third quarter of 2022. The advance estimate saw real GDP increase by 2.9%.The GDP estimate released today is based on source data that are more complete than the advance estimate. The increase in real GDP reflected increases in private inventory investment, consumer spending, federal government spending, state and local government spending, and nonresidential fixed investment that were partly offset by decreases in residential fixed investment and exports. Imports, which are a subtraction in the calculation of GDP, decreased. The updated estimates primarily reflected a downward revision to consumer spending that was partly offset by an upward revision to nonresidential fixed investment. Imports, which are a subtraction in the calculation of GDP, were revised up.
Existing Home Sales – Released 2/21/2023 – Existing home sales decreased in January marking twelve consecutive months of declines. Sales declined 0.7% to a seasonally adjusted rate of 4.0 million in January. Sales decreased 36.9% year-over-year. Housing inventory sits at 980k units. Up 2.1% from December’s inventory. Up 15.3% over last year. Unsold inventory sits at a 2.9-month supply. The median existing home price for all housing types was $359,000 which is up 1.3% from January 2021. This marks 131 consecutive months of year-over-year increases, the longest-running streak on record.
Producer Price Index – Released 2/16/2023 – The PPI for final demand increased 0.7 percent in January, seasonally adjusted, the U.S. Bureau of Labor Statistics reported. Final demand prices declined 0.2 percent in December but increased 0.3 percent in November. On an unadjusted basis, the index for final demand increased 6.0 percent year over year.
Housing Starts – Released 2/16/2023 – New home starts in January were at a seasonally adjusted annual rate of 1.309 million; down 4.5% below December, and 21.4% below last January’s rate. Building Permits were at a seasonally adjusted annual rate of 1.339 million, up 0.1% compared to December, but down 27.3% over last year.
Industrial Production and Capacity Utilization – Released 2/15/2023 – In January Industrial production was unchanged. Manufacturing increased 1.0%. Utilities output decreased 9.9%. Mining output increased 2.0%. Total industrial production was 0.8% higher in January than a year ago. Total capacity utilization decreased 0.1% in January to 78.3% which is 1.3% below its long run average.
Retail Sales – Released 2/15/2023 – U.S. retail sales for January increased 3.0% to $697.0 billion and retail sales are 6.4% above January 2022. U.S. retail sales for the November 2022 through January 2023 period were up 6.1% from the same period a year ago.
Consumer Price Index – Released 2/14/2023 – Consumer prices increased 0.5% m/m in January following a 0.1% increase in December. Consumer prices are up 6.4% for the 12-month period ending in January. Core consumer prices increased 0.4% m/m in January.
Next week we get data on CPI, PPI, Retail Sales, Industrial Production and Capacity Utilization, and Housing Starts.
Data Sources:
Bureau of Economic Analysis (BEA)
Congressional Budget Office (CBO)
U.S. Bureau of Labor Statistics (BLS)
Federal Reserve Economic Data (FRED Charts)
CME Fed Watch
U.S. Treasury – Yields
U.S. Census Bureau
Institute for Supply Management (ISM)
Weekly DOL Employment Data
BLS Monthly Jobs Report
JOLTS
US Energy Admin (EIA)
BLS Consumer Price Index CPI
BLS Producer Price Index PPI
Atlanta Fed GDPNOW
NY Fed Nowcast GDP
US Census Bureau Housing Starts
Consumer Credit
USCB Retail Sales
Construction Spending
Federal Reserve Dot Plots
NY Empire Index
Philadelphia Federal Reserve
P/E Ratio Data -Yardeni Research
Technical Analysis Info:
StockCharts.com – Financial Charts
Exponential vs Simple moving average
Other Links:
1973 Arab Oil Embargo
Hunt Brothers Silver
Long-Term Capital bailout


Week 10 Talking Points
Table of Contents
Good Life Advisors – Talking Points – Week 10
Reasons for Negative Sentiment Just Keep Coming
So obviously the big story that’ll be plastered in the headlines this week is the FDIC takeover of Silicon Valley Bank and the possible contagion that could follow. An hour into Sunday night futures trading and it doesn’t appear that bad, (right this moment). In fact, at the time of this writing futures are actually up around a percent. This is primarily due to the Federal Reserve and the Treasury Departments announcement Sunday night the creation of a new facility to backstop bank deposits. Regulators announced the moves in a joint statement from Treasury Secretary Janet Yellen, Fed Chair Jerome Powell and FDIC. The group said that depositors at SVB and another closed bank (Signature) would have access to all of their money on Monday. This is just icing on the worry cake. We have inflation, debt ceiling limits, high valuations, falling earnings, a proxy war with Russia and a growing treat from China, now add bank failures to the list. It’s completely possible that the SVB/ Signature failures were caused by reckless risk controls and will be contained to a handful of names. It is also possible that the fall out grows. At the moment it looks like the Fed backstop will provide market participant enough trust in the system to prevent a true run on the banks.
US equities were lower this week, with the S&P positing the worst weekly performance since September and Nasdaq since November, while the small-cap Russell 2000 posted the worst week since Jan-22. All sectors were down with banks the big decliner for the week amid the SVB Financial failure. The KBW Bank Index BKX -15.7% posted the worst weekly performance since Mar-20 (-18.8%), with some acute weakness across other names deemed risky. Insurance, fund and asset managers were also among the worst performance in financials. Discretionary groups broadly weaker including retail (XRT -6.1%), autos, and travel and leisure. Homebuilders (XHB -4.9%) were a slight underperformer despite the rate tailwind. Cyclicals were broadly weaker including transports, building materials, and construction and engineering, though semis (SOX -3.5%) were a relative outperformer. Commodity-linked groups were broadly weaker including industrial metals and agricultural chemicals. Energy was a laggard as crude sold off on recession fears, with E&Ps and oilfield services among the worst groups. FANMAG complex was broadly in line, though cloud, cybersecurity, and payments underperformed. Some of the relative outperformers included defensives and flight-to-safety groups like grocers, convenience stores, beverages, precious metals miners, and large cap pharma. Treasuries rallied across the curve with some curve steepening, with Friday’s strength counting for the bulk of the gains. The dollar index was little changed for the week, with some weakness on the yen cross but slight gains on the euro and sterling crosses. Gold finished the week up 0.7%. WTI crude was down 3.8% for the week
The biggest story of the week before SVB was the volatility around Fed rate path expectations. Into Friday, 2Y yields made the biggest downward two-day move since 9/11 and Black Monday in 1987. The market pricing for peak fed funds rate was nearly 5.80% after Fed Chair Powell’s appearance in front of the Senate Banking Committee on Tuesday, though fell to around 5.25% by Friday afternoon. At his Tuesday appearance, Powell said that if data indicate that faster tightening is warranted, the Fed is prepared to increase the pace of rate hikes (FT). Powell’s comments pushed pricing for a 50 bp hike in the March FOMC meeting (22-Mar) to around 80%. However, the odds fell to under 40% by Friday amid a batch of labor market data, as well as recession and financial system concerns. Thursday’s initial jobless claims report came in higher than expected, while continuing claims tied for the highest print since Jan-22 (Bloomberg). Friday’s February nonfarm payrolls report showed a headline print of 311K, higher than consensus for 215K. However, average hourly earnings growth cooler than expected, up 0.2% m/m, down from January 0.3% and below consensus for 0.4%, trends which economists said lessened fears of labor market overheating (FT). A number of Street economists reiterated calls for a 25 bp hike in March, though noted risk remains to the upside pending Tuesday’s CPI report and other key data ahead of the meeting.
The Treasury rally was also driven by some flight-to-safety dynamics and recession fears. Thursday’s selloff was driven in part by bank updates that played into concerns around the cumulative impact of the fed tightening cycle. SVB Financial was taken over by US regulators on Friday, the second-largest bank failure since the 2008 collapse of Washington Mutual (FT). The failure came after concerns around its balance sheet after the value of its portfolio of mortgage bonds and US Treasuries fell by $15B amid the Fed rate hike cycle. The bank hoped to raise $2.25B of capital to cover those losses, but on Friday instead moved to explore a potential sale. The situation magnified other financial sector concerns including bank balance sheets, liquidity and funding pressures, higher deposit beta headwinds on NII, securities losses, private company valuations, credit deterioration (particularly in CRE), and the heightened potential for a systemic/credit event. However, some sell-side analysts said SVB’s issues were idiosyncratic. Wells Fargo analysts said that SVB was a worst case, and that the failure was driven by a lack of diversification given reliance on VCs. Morgan Stanley analysts also said that they don’t believe there’s a liquidity crunch facing the banking industry. Instead, the issue is the rising cost of liquidity, which will likely remain a headwind to NIM, revenue, and EPS. However, Reuters noted that despite the “idiosyncratic” argument, there was a surge in options trades to protect against downside in banking stocks. The S&P Financials Sector fell by 8% for the week, the worst weekly performance for the sector since Jun-20. Elsewhere, crypto bank Silvergate announced it would voluntarily liquidate after weeks of customer withdrawals and a number of crypto trading platforms cutting business with the bank (FT).
In addition to the higher-for-longer fed rate risk, a key bearish argument remains the focus on curve inversion. The 2Y/10Y spread hit -110 bp this week, a fresh post-1981 low, before falling in the end of the week back toward -90 bp. Other bearish arguments include uncertainty around the disinflationary path, a still-tight labor market, technical dynamics with the S&P back below the 200 DMA after late-week selloff, and Washington drama, including this week’s updates on the Biden budget and debt ceiling (Bloomberg). There are still a few bullish arguments, including potential for an even flatter rate path than expected given some better labor market signals, seen in the dovish repricing this week. Some positive corporate trends were also highlighted this week, including strong retail demand and inventory trends (Yahoo! Finance), as well as a better semiconductor backdrop and China reopening momentum.
Next week brings another set of key reports that are seen as key catalysts headed into the March FOMC meeting. February CPI is out Tuesday (14-Feb). Previews noted upside risk after the Manheim Used Vehicle Value Index was up 4.3% in February, the biggest m/m increase since 2009. Bank of America economist said they still see core services to rise by 0.54% m/m on stronger shelter and non-shelter components, implying inflationary pressures are still only diminishing slowly. February PPI and retail sales are out Wednesday.
Fixed Income
Yield Curve
January FOMC Statement January Fed Minutes Balance Sheet Reduction Plan Credit, Liquidity and Balance Sheet Federal Reserve Dot Plots
Treasury.gov yields FOMC Policy Normalization Statement Longer- Run Goals Jan 2022
Foreign Exchange Market
Energy Complex
The Baker Hughes rig count was down by 3 this week. There are 746 oil and gas rigs operating in the US – Up 83 over last year.
Metals Complex
Employment Picture
February Jobs Report – BLS Summary – Released 3/10/2023 – The US Economy added 311k nonfarm jobs in February and the Unemployment rate increased 0.2% to 3.6%. Average hourly earnings increased 8 cents to $33.09. Hiring highlights include +105k Leisure and Hospitality, +74k Education and Health Services, +50k Retail Trade, +46 Government, and +45k Professional and Business Services.
Weekly Unemployment Claims – Released Thursday 3/9/2023 – The week ending March 4th observed an increase of 21k in initial claims increasing to 211k. The four-week moving average of initial jobless claims was up by 4k to 197k.
Job Openings & Labor Turnover Survey JOLTS – Released 3/8/2023 – The number of job openings decreased to 10.8 million on the last business day of January, the U.S. Bureau of Labor Statistics reported. Over the month the number of hires and total separations changed little at 6.4 million and 5.9 million, respectively. Within separations, quits (3.9 million) and layoffs and discharges (1.7 million) increased.
Employment Cost Index – Released 1/31/2023 – Compensation costs for civilian workers increased 1.0% for the 3-month period ending in December 2022. The 12-month period ending on December 2022 saw compensation costs increase by 5.1%. The 12-month period ending December 2021 increased 4.0%. Wages and salaries increased 5.1 percent over the year and increased 4.5 percent for the 12-month period ending in December 2021. Benefit costs increased 4.9 percent over the year and increased 2.8 percent for the 12-month period ending in December 2021. This report is published quarterly.
This Week’s Economic Data
Links take you to the data source
U.S. Trade Balance – Released 3/8/2023 – The U.S. monthly international trade deficit increased in January 2023 according to the U.S. Bureau of Economic Analysis and the U.S. Census Bureau. The deficit increased from $67.2 billion in December (revised) to $68.3 billion in January. January exports were $257.5 billion, $8.5 billion more than December exports. January imports were $325.8 billion, $9.6 billion more than December imports. Year-over-year, the goods and services deficit decreased $19.2 billion, or 21.9 percent, from January 2022. Exports increased $30.2 billion or 13.3 percent. Imports increased $11.0 billion or 3.5 percent.
Consumer Credit – Released 3/7/2023 – In January, consumer credit increased at a seasonally adjusted annual rate of 3.7 percent. Revolving credit increased at an annual rate of 11.1 percent, while nonrevolving credit increased at an annual rate of 1.2 percent.
Recent Economic Date
Links take you to the data source
US Light Vehicle Sales – Released 3/3/2023 – U.S. light vehicle sales were at a seasonally adjusted annual rate (SAAR) of 14.886 million units in February.
PMI Non-Manufacturing Index – Released 3/3/2023 – Economic activity fell in February. The Services PMI® registered 55.1 percent, 0.1 percentage points lower than January. In January the Services PMI® registered 55.2 percent.
PMI Manufacturing Index – Released 3/1/2023 – The February Manufacturing PMI® registered 47.7 percent, 0.3 percentage point higher than the 47.4 percent recorded in January. Regarding the overall economy, this figure indicates three months of contraction following 30 months of expansion. The New Orders Index remained in contraction territory at 47.0 percent, 4.5 percentage points higher than the 42.5 percent recorded in January. The production index declined 0.7 percentage points to 47.3.
U.S. Construction Spending – Released 3/1/2023 – Construction spending during January 2023 was estimated at a seasonally adjusted annual rate of $1,825.7 billion, 0.1 percent below the revised December estimate of $1,827.5 billion. The January figure is 5.7 percent above the January 2022 estimate of $1,726.6 billion.
Chicago PMI – Released 2/28/2023 – Chicago PMI remained in contraction territory and decreased in February to 43.6 points down from 44.3 points in January. This is the lowest reading since November 2022 and marks six consecutive months in contractionary territory.
Consumer Confidence – Released 2/28/2023 – The Conference Board Consumer Confidence Index® decreased in February. The Index now stands at 102.9 (1985=100), down from 106.0 in January.
Durable Goods – Released 2/27/2023 – New orders for manufactured durable goods in January decreased $13.0 billion or 4.5% to $272.3 billion. Transportation equipment led the decrease down $14.2 billion or 13.3% to $92.8 billion.
Personal Income – Released 2/24/2023 – Personal income increased $131.1 billion, or 0.6 percent in January. Disposable Personal Income increased $387.4 billion or 2.0 percent. Personal Consumption Expenditure increased $312.5 billion or 1.8 percent.
New Residential Sales – Released 2/24/2023 – Sales of new single-family homes increased 7.2% to 670k, seasonally adjusted, in January. The median sales price of new homes sold in January was $427,500 with an average sales price of $474,400. At the end of January, the seasonally adjusted estimate of new homes for sale was 439k. This represents a supply of 7.9 months at the current sales rate.
Second Estimate of 4th Quarter 2022 GDP – Released 2/23/2023 – Real gross domestic product (GDP) increased at an annual rate of 2.7 percent in the fourth quarter of 2022 according to the second estimate released by the Bureau of Economic Analysis, following an increase of 3.2 percent in the third quarter of 2022. The advance estimate saw real GDP increase by 2.9%.The GDP estimate released today is based on source data that are more complete than the advance estimate. The increase in real GDP reflected increases in private inventory investment, consumer spending, federal government spending, state and local government spending, and nonresidential fixed investment that were partly offset by decreases in residential fixed investment and exports. Imports, which are a subtraction in the calculation of GDP, decreased. The updated estimates primarily reflected a downward revision to consumer spending that was partly offset by an upward revision to nonresidential fixed investment. Imports, which are a subtraction in the calculation of GDP, were revised up.
Existing Home Sales – Released 2/21/2023 – Existing home sales decreased in January marking twelve consecutive months of declines. Sales declined 0.7% to a seasonally adjusted rate of 4.0 million in January. Sales decreased 36.9% year-over-year. Housing inventory sits at 980k units. Up 2.1% from December’s inventory. Up 15.3% over last year. Unsold inventory sits at a 2.9-month supply. The median existing home price for all housing types was $359,000 which is up 1.3% from January 2021. This marks 131 consecutive months of year-over-year increases, the longest-running streak on record.
Producer Price Index – Released 2/16/2023 – The PPI for final demand increased 0.7 percent in January, seasonally adjusted, the U.S. Bureau of Labor Statistics reported. Final demand prices declined 0.2 percent in December but increased 0.3 percent in November. On an unadjusted basis, the index for final demand increased 6.0 percent year over year.
Housing Starts – Released 2/16/2023 – New home starts in January were at a seasonally adjusted annual rate of 1.309 million; down 4.5% below December, and 21.4% below last January’s rate. Building Permits were at a seasonally adjusted annual rate of 1.339 million, up 0.1% compared to December, but down 27.3% over last year.
Industrial Production and Capacity Utilization – Released 2/15/2023 – In January Industrial production was unchanged. Manufacturing increased 1.0%. Utilities output decreased 9.9%. Mining output increased 2.0%. Total industrial production was 0.8% higher in January than a year ago. Total capacity utilization decreased 0.1% in January to 78.3% which is 1.3% below its long run average.
Retail Sales – Released 2/15/2023 – U.S. retail sales for January increased 3.0% to $697.0 billion and retail sales are 6.4% above January 2022. U.S. retail sales for the November 2022 through January 2023 period were up 6.1% from the same period a year ago.
Consumer Price Index – Released 2/14/2023 – Consumer prices increased 0.5% m/m in January following a 0.1% increase in December. Consumer prices are up 6.4% for the 12-month period ending in January. Core consumer prices increased 0.4% m/m in January.
Next week we get data on CPI, PPI, Retail Sales, Industrial Production and Capacity Utilization, and Housing Starts.
Data Sources:
Bureau of Economic Analysis (BEA)
Congressional Budget Office (CBO)
U.S. Bureau of Labor Statistics (BLS)
Federal Reserve Economic Data (FRED Charts)
CME Fed Watch
U.S. Treasury – Yields
U.S. Census Bureau
Institute for Supply Management (ISM)
Weekly DOL Employment Data
BLS Monthly Jobs Report
JOLTS
US Energy Admin (EIA)
BLS Consumer Price Index CPI
BLS Producer Price Index PPI
Atlanta Fed GDPNOW
NY Fed Nowcast GDP
US Census Bureau Housing Starts
Consumer Credit
USCB Retail Sales
Construction Spending
Federal Reserve Dot Plots
NY Empire Index
Philadelphia Federal Reserve
P/E Ratio Data -Yardeni Research
Technical Analysis Info:
StockCharts.com – Financial Charts
Exponential vs Simple moving average
Other Links:
1973 Arab Oil Embargo
Hunt Brothers Silver
Long-Term Capital bailout
Categories:
Tags: