A Three Week Reprieve from the Shutdown
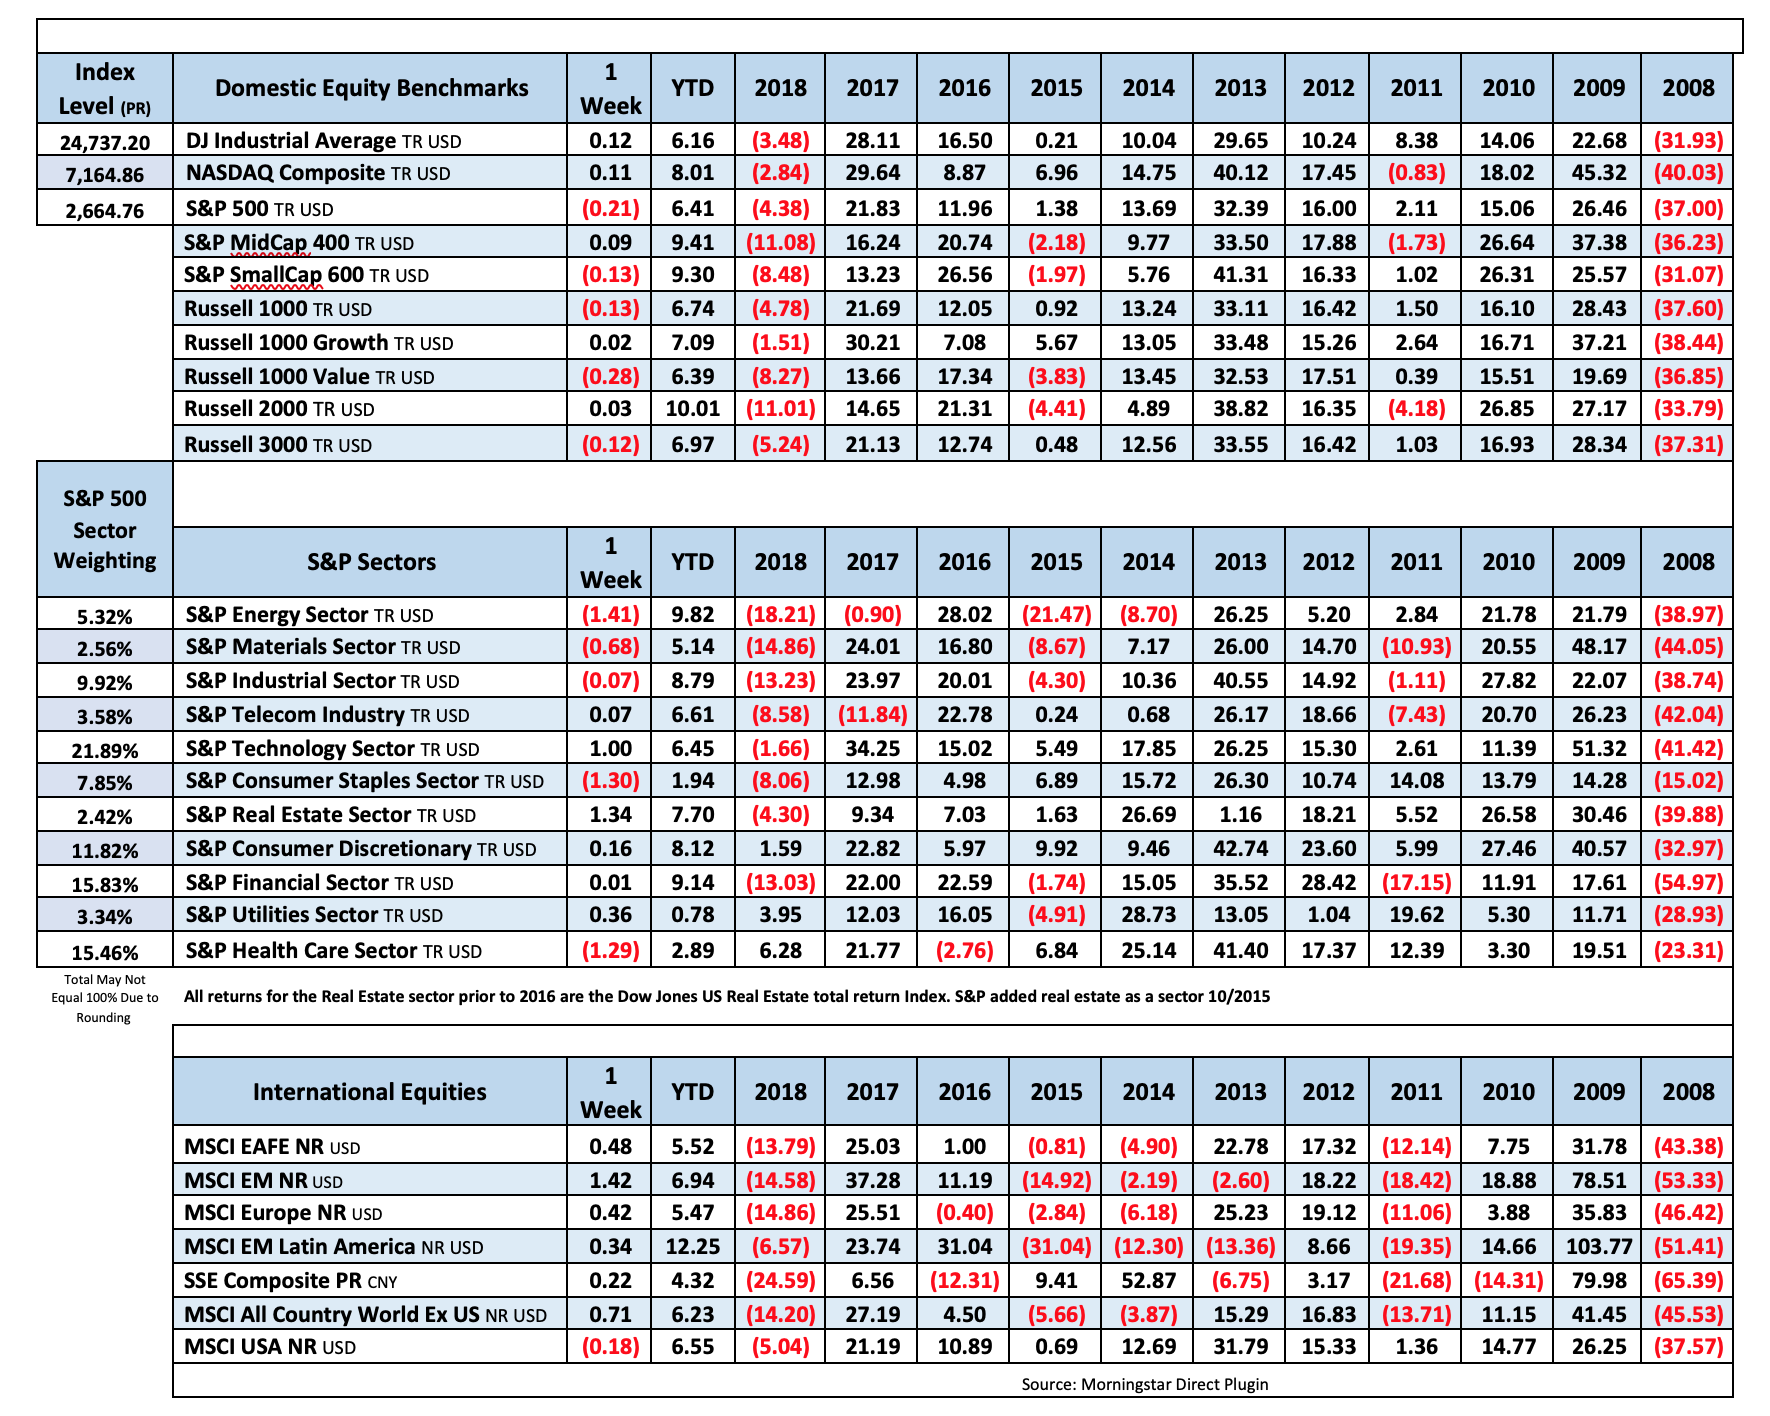
Volatility fell as markets had a mixed week with the S&P500 pulling back slightly. Sectors were also mixed as energy, staples, and healthcare all fell more than 1% while tech and real estate both climbed by more than 1%. Domestic markets underperformed as EM gained 1.4% and developed intl. gained 0.5%. US Treasuries and high-quality corporates were higher as high yield, tips and muni bonds were all down slightly. Earnings were mixed this week, IBM eps came in above expectations, Procter & Gamble and United Technologies also provided strong reports but, Johnson & Johnson expects sales growth to slow and Travelers missed by 10 cents. There appears to be a softening in the housing market as witnessed by this month’s existing homes sales. They declined 6.4% month over month and 10.3% year over year to an annualized rate of 4.99 million homes.
The FOMC holds its 1st policy meeting of 2019, on the 29th and 30th with a rate decision Wednesday at 2:00 pm.
Trade talks will be held this coming week as the Chinese President’s top economic aid will be in Washington Wednesday to continue negotiations with the administration.
Big earnings announcements coming this week – We’ll hear from Apple, Microsoft, Facebook, Amazon, Boeing, Caterpillar, BP, Archer-Daniels, Disney, GM, Fiat Chrysler, Humana, Cardinal Health, Pfizer, Merck, Met Life, and Prudential just to name the big ones. Payroll numbers are scheduled for Friday morning, last month’s jobs numbers were above average at 312k new jobs. We should start to see some of the delayed data get released as Gov’t workers return after being furloughed. Also out are consumer confidence, personal income, and spending and manufacturing ISM.

Fixed Income
FOMC December Statement Federal Reserve Dot Plots Dec 18 US Debt Measurement– November Meeting Minutes US Corporate Debt Tops $6 Trillion. Treasury.gov yields
Global Bond Yields
The two and five curve tiled back to inversion. You can see the longer part of the curve coming in this week.
Foreign Exchange Market
The dollar index fell slightly this week.
Energy Complex
Crude oil bottomed at $50.77 Dec 26, Since then it has rallied 22%. Brent crude oil fell 40% from Oct3 to Dec 24th. $85.98 – $50.77
The Baker Hughes rig count showed an increase of 9 this week. There are 1059 oil and gas rigs operating in the US – Up 112 over last year.
- Brent Crude Oil fell 1.69% this week closing at $61.64/bbl
- WTI Crude Oil lost 0.65% this week to close at $53.69/bbl
- Heating Oil fell 1.14% this week closing at $1.886/gallon
- Natural Gas fell 11.77% this week closing at $3.072 per million BTUs
- Unleaded Gas lost 4.36% this week at closing at $1.389/gallon
Metals Complex
All of Gold’s gain came on Friday.
- Gold rose 1.21% this week closing at $1298.10/oz
- Silver gained 1.05% on the week closing at $15.67/oz
- Palladium fell 2.11% this week closing at $1319.80/oz
- Platinum rose 0.74% this week closing at 818.30/oz
- Copper rose 1.83% this week closing at $2.729 /lb
Employment Picture
Weekly Unemployment Claims – Released Thursday 1/24 – In the week ending January 19th, initial claims were 199,000, a decrease of 13,000 from the previous week’s revised level. This marks the lowest level of initial claims since November 15, 1969. The 4-week moving average was 215,000 a decrease of 5,500 from the previous week’s revised average.
https://fred.stlouisfed.org/series/IC4WSA
Job Openings & Labor Turnover Survey – JOLTS Released Monday 1/8 – The number of job openings fell to 6.9 million on the last business day of November, the U.S. Bureau of Labor Statistics reported. Over the month, hires edged down to 5.7 million, quits edged down to 3.4 million, and total separations were little changed at 5.5 million. Within separations, the quits rate and the layoffs and discharges rate was unchanged at 2.3 percent and 1.2 percent, respectively.
December Jobs Report – BLS Summary – Released 1/4 – The US Economy added 312k nonfarm jobs in December. The revision for November was upward by 21k and the revision for October was upward 37k. Hiring highlights to include Education and Health care +88k, Leisure and Hospitality +55k, Professional and Business Services +43k, Manufacturing +32k, and Retail Trade +24k.
- Average hourly earnings increased by 11 cents/ 0.4% in December y/y hourly earnings are up 3.2%.
- U3 Civilian unemployment rate edged upward by 0.2% to 3.9%. The U6 unemployment rate remained flat at 7.6%.
- The labor force participation rate increased slightly from 62.9% to 63.1%.
- Average workweek increased by 0.1 hours to 34.5 hours.
Employment Cost Index – Released 10/31/18 – Compensation costs for civilian workers increased 2.8% for the 12-month period ending in September 2018 compared with a compensation costs increase of 2.5% in September 2017. Wages and salaries were up 2.9%, versus 2.5% for the 12-month period ending September 2017. Benefit costs increased 2.6%, versus 2.4% in September 2017. For private industry workers, compensation costs increased 2.9% year-over-year, versus 2.5% for the 12 months ending September 2017. Wages and salaries increased 3.1% year-over-year, versus 2.6% for the 12 months ending September 2017. Benefit costs increased 2.5%, versus 2.4% for the 12 months ending September 2017. This report is published quarterly.
This Week’s Economic Data
Links take you to the data source
Existing Home Sales – Released 1/22 – Existing home sales decreased 6.4% in December. Sales decreased to a seasonally adjusted rate of 4.99 million. Sales are currently down 10.3% from one year ago. Housing inventory declined to 3.7 months of inventory and the existing homes for sale declined to 1.55 million. The median sales price for all types of homes was $253,600, up 2.9% year/y.
Durable Goods – Scheduled Released 1/25 – (Not Released on time due to gov’t shutdown) December – New orders for manufactured durable goods increased $1.9 billion or 0.8% to $250.8 billion in November. This increase follows two consecutive months of decline. Transportation equipment, up 2.9%, drove the increase by $2.5 billion to $87 billion.
Recent Economic Data
Links bring you to the data source
Consumer Price Index – Released 1/11 – The Consumer Price Index declined 0.1% in December, core CPI, which excludes food and energy increased 0.2%. The monthly changes left total CPI up 1.9% year-over-year, versus 2.2% in November, and core CPI up 2.2%. The decline in total CPI in December was fueled by the energy index and gasoline index. A 0.3% increase in the shelter index drove the increase in core CPI, which was offset somewhat by a 0.2% decline in the price index for used cars and trucks.
Consumer Credit – Released 1/8 – Total outstanding consumer credit increased by 22.2 billion in November. Nonrevolving credit increased by $17.3 billion and revolving credit increased by $4.8 billion. Consumer credit increased at a seasonally adjusted annual rate of 6.75% in November, with revolving credit increased at an annual rate of 5.5% and nonrevolving credit increased at an annual rate of 7.00%.
PMI Non-Manufacturing Index (ISM Services) – Released 1/7 – There was a deceleration in non-manufacturing in December. The ISM Non-Manufacturing Index registered 57.6 points, falling from last months’ 60.7%. This represents continued growth in the non-manufacturing sector, at a slightly slower rate.
U.S. Trade Balance – Released 1/8 – (Not Released on time due to gov’t shutdown) The trade deficit rose $0.9 billion in October to – $55.5 billion. Exports were $211.0 billion while imports were $266.5 billion.
US Light Vehicle Sales – Released 12/6 – (Not Released on time due to gov’t shutdown) U.S. light vehicle sales were at a seasonally adjusted annual rate (SAAR) of 17.40 million units in November versus a SAAR of 17.49 million units in October. The November run rate was down 0.7% from the SAAR of 17.52 million units for November 2017.
PMI Manufacturing ISM Index – Released 1/3 – December PMI decreased 5.2% to 54.1% from November’s reading of 59.3%. The New Orders Index was down 11% to 51.1%. The Production Index registered 54.3% down 6.3%.
U.S. Construction Spending – Released 1/3 –Not released on time due to gov’t shutdown) – Last month construction spending decreased slightly by 0.1% in October measuring at a seasonally adjusted annual rate of $1,308.8 billion. The October figure is 4.9% above the October 2017 estimate. Private construction spending was 0.4% below the revised September estimate.
Chicago PMI – Released 12/28 – Chicago PMI decreased 1.0 point in December easing to 65.4, down from 66.4 in November. The Prices Paid indicator was down for the fifth consecutive month and by the largest margin in four years.
New Residential Sales – Released 12/28 – (Not released on time due to gov’t shutdown) Last month sales of new single-family homes declined in October by 8.9% to 544k, seasonally adjusted. The median sales price of new homes sold in October was $309.7k with an average sales price of $395.0k. At the end of October the seasonally adjusted estimate of new homes for sale was 336k. This represents a supply of 7.4 months at the current sales rate.
Consumer Confidence – Released 12/27 – The Consumer confidence index declined in December. The Index now shows a reading of 128.1 down from 136.4 in November. Despite the decline in December and despite weakened expectations regarding job prospects and business conditions, consumer confidence levels still indicate the economy will continue to expand at a solid pace in the short run. Consumer Confidence remains at historically strong levels. Should consumers’ assessment of the current conditions soften further; the pace of economic growth is likely to decline. Back to back declines in Consumer Confidence reflect a growing concern of a moderating pace of economic growth in 2019.
Personal Income – Released 12/21– Personal Income increased 0.2% in November according to the BEA. The majority of this increase was due to increases in wages and salaries and increases in farm proprietor’s income. Real PCE (the Feds preferred inflation gauge) increased 0.3%. Real disposable personal income increased 0.2%. Real Personal Consumption Expenditures (PCE) has risen 1.8% y/y.
3rd Estimate of 3rd Quarter GDP – Released 12/21– According to the third estimate released by the Bureau of Economic Analysis, Real Gross Domestic Product (Real GDP) increased at an annual rate of 3.4% in the third quarter of 2018. This result is slightly lower by 0.1% from 3.5% seen in the second estimate. The general outlook of real GDP remains roughly the same. The third estimate data provided an upward revision to private inventory investment. Downward revisions were reflected in personal consumption expenditures (PCE) and exports.
This report has been prepared without regard to the specific investment objectives, financial situation, and needs of any particular recipient. The information and opinions in this report are for general information use only and are not intended as an offer or solicitation with respect to the purchase or sale of any stock, bond, currency or CFD contract.
Some information contained herein has been obtained from third party sources believed to be reliable, but has not been independently verified by us; its accuracy or completeness is not guaranteed. Our commentary is based on information considered to be reliable, but no representation is made that it is accurate or complete, and should not be relied upon as such.
The views expressed represent the opinions and beliefs at the time of this commentary and are not meant as a market forecast. These views are subject to change at any time based on market or other conditions and Good Life Advisors disclaims any responsibility to update such views. This information may not be relied on as advice or as an indication of trading intent on behalf of any portfolio. Portfolio investments may change at any time.
Economic and performance information referenced is historical and past performance does not guarantee future results. References to future returns are not promises or estimates of actual returns we may achieve, and should not be relied upon.
No investment strategy or risk management process can guarantee returns or eliminate risk in any market environment. Investing in securities involves risk of loss. Stock and Bond prices can decline significantly in response to adverse market conditions, company-specific events, and other domestic and international political and economic developments. Any references to historical price movements or levels is informational based on our analysis and we do not represent or warrant that any such movements or levels are likely to reoccur in the future.
While the information contained herein was obtained from sources believed to be reliable, the author does not guarantee its accuracy or completeness, nor does author assume any liability for any direct, indirect or consequential loss that may result from the reliance by any person upon any such information or opinions.
Data Sources:
Bureau of Economic Analysis (BEA)
Congressional Budget Office (CBO)
U.S. Bureau of Labor Statistics (BLS)
Federal Reserve Economic Data (FRED Charts)
CME Fed Watch
U.S. Treasury – Yields
U.S. Census Bureau
Institute for Supply Management (ISM)
Weekly DOL Employment Data
BLS Monthly Jobs Report
JOLTS
US Energy Admn (EIA)
BLS Consumer Price Index CPI
BLS Producer Price Index PPI
Atlanta Fed GDPNOW
NY Fed Nowcast GDP
US Census Bureau Housing Starts
Consumer Credit
USCB Retail Sales
Construction Spending
Federal Reserve Dot Plots
NY Empire Index
Philadelphia Federal Reserve
P/E Ratio Data -Yardeni Research
Technical Analysis Info:
StockCharts.com – Financial Charts
Exponential vs Simple moving average
Other Links:
1973 Arab Oil Embargo
Hunt Brothers Silver
Long-Term Capital bailout


Week 4 Talking Points #4
A Three Week Reprieve from the Shutdown
Volatility fell as markets had a mixed week with the S&P500 pulling back slightly. Sectors were also mixed as energy, staples, and healthcare all fell more than 1% while tech and real estate both climbed by more than 1%. Domestic markets underperformed as EM gained 1.4% and developed intl. gained 0.5%. US Treasuries and high-quality corporates were higher as high yield, tips and muni bonds were all down slightly. Earnings were mixed this week, IBM eps came in above expectations, Procter & Gamble and United Technologies also provided strong reports but, Johnson & Johnson expects sales growth to slow and Travelers missed by 10 cents. There appears to be a softening in the housing market as witnessed by this month’s existing homes sales. They declined 6.4% month over month and 10.3% year over year to an annualized rate of 4.99 million homes.
The FOMC holds its 1st policy meeting of 2019, on the 29th and 30th with a rate decision Wednesday at 2:00 pm.
Trade talks will be held this coming week as the Chinese President’s top economic aid will be in Washington Wednesday to continue negotiations with the administration.
Big earnings announcements coming this week – We’ll hear from Apple, Microsoft, Facebook, Amazon, Boeing, Caterpillar, BP, Archer-Daniels, Disney, GM, Fiat Chrysler, Humana, Cardinal Health, Pfizer, Merck, Met Life, and Prudential just to name the big ones. Payroll numbers are scheduled for Friday morning, last month’s jobs numbers were above average at 312k new jobs. We should start to see some of the delayed data get released as Gov’t workers return after being furloughed. Also out are consumer confidence, personal income, and spending and manufacturing ISM.
Table of Contents
Fixed Income
FOMC December Statement Federal Reserve Dot Plots Dec 18 US Debt Measurement– November Meeting Minutes US Corporate Debt Tops $6 Trillion. Treasury.gov yields
Global Bond Yields
The two and five curve tiled back to inversion. You can see the longer part of the curve coming in this week.
Foreign Exchange Market
The dollar index fell slightly this week.
Energy Complex
Crude oil bottomed at $50.77 Dec 26, Since then it has rallied 22%. Brent crude oil fell 40% from Oct3 to Dec 24th. $85.98 – $50.77
The Baker Hughes rig count showed an increase of 9 this week. There are 1059 oil and gas rigs operating in the US – Up 112 over last year.
Metals Complex
All of Gold’s gain came on Friday.
Employment Picture
Weekly Unemployment Claims – Released Thursday 1/24 – In the week ending January 19th, initial claims were 199,000, a decrease of 13,000 from the previous week’s revised level. This marks the lowest level of initial claims since November 15, 1969. The 4-week moving average was 215,000 a decrease of 5,500 from the previous week’s revised average.
https://fred.stlouisfed.org/series/IC4WSA
Job Openings & Labor Turnover Survey – JOLTS Released Monday 1/8 – The number of job openings fell to 6.9 million on the last business day of November, the U.S. Bureau of Labor Statistics reported. Over the month, hires edged down to 5.7 million, quits edged down to 3.4 million, and total separations were little changed at 5.5 million. Within separations, the quits rate and the layoffs and discharges rate was unchanged at 2.3 percent and 1.2 percent, respectively.
December Jobs Report – BLS Summary – Released 1/4 – The US Economy added 312k nonfarm jobs in December. The revision for November was upward by 21k and the revision for October was upward 37k. Hiring highlights to include Education and Health care +88k, Leisure and Hospitality +55k, Professional and Business Services +43k, Manufacturing +32k, and Retail Trade +24k.
Employment Cost Index – Released 10/31/18 – Compensation costs for civilian workers increased 2.8% for the 12-month period ending in September 2018 compared with a compensation costs increase of 2.5% in September 2017. Wages and salaries were up 2.9%, versus 2.5% for the 12-month period ending September 2017. Benefit costs increased 2.6%, versus 2.4% in September 2017. For private industry workers, compensation costs increased 2.9% year-over-year, versus 2.5% for the 12 months ending September 2017. Wages and salaries increased 3.1% year-over-year, versus 2.6% for the 12 months ending September 2017. Benefit costs increased 2.5%, versus 2.4% for the 12 months ending September 2017. This report is published quarterly.
This Week’s Economic Data
Links take you to the data source
Existing Home Sales – Released 1/22 – Existing home sales decreased 6.4% in December. Sales decreased to a seasonally adjusted rate of 4.99 million. Sales are currently down 10.3% from one year ago. Housing inventory declined to 3.7 months of inventory and the existing homes for sale declined to 1.55 million. The median sales price for all types of homes was $253,600, up 2.9% year/y.
Durable Goods – Scheduled Released 1/25 – (Not Released on time due to gov’t shutdown) December – New orders for manufactured durable goods increased $1.9 billion or 0.8% to $250.8 billion in November. This increase follows two consecutive months of decline. Transportation equipment, up 2.9%, drove the increase by $2.5 billion to $87 billion.
Recent Economic Data
Links bring you to the data source
Consumer Price Index – Released 1/11 – The Consumer Price Index declined 0.1% in December, core CPI, which excludes food and energy increased 0.2%. The monthly changes left total CPI up 1.9% year-over-year, versus 2.2% in November, and core CPI up 2.2%. The decline in total CPI in December was fueled by the energy index and gasoline index. A 0.3% increase in the shelter index drove the increase in core CPI, which was offset somewhat by a 0.2% decline in the price index for used cars and trucks.
Consumer Credit – Released 1/8 – Total outstanding consumer credit increased by 22.2 billion in November. Nonrevolving credit increased by $17.3 billion and revolving credit increased by $4.8 billion. Consumer credit increased at a seasonally adjusted annual rate of 6.75% in November, with revolving credit increased at an annual rate of 5.5% and nonrevolving credit increased at an annual rate of 7.00%.
PMI Non-Manufacturing Index (ISM Services) – Released 1/7 – There was a deceleration in non-manufacturing in December. The ISM Non-Manufacturing Index registered 57.6 points, falling from last months’ 60.7%. This represents continued growth in the non-manufacturing sector, at a slightly slower rate.
U.S. Trade Balance – Released 1/8 – (Not Released on time due to gov’t shutdown) The trade deficit rose $0.9 billion in October to – $55.5 billion. Exports were $211.0 billion while imports were $266.5 billion.
US Light Vehicle Sales – Released 12/6 – (Not Released on time due to gov’t shutdown) U.S. light vehicle sales were at a seasonally adjusted annual rate (SAAR) of 17.40 million units in November versus a SAAR of 17.49 million units in October. The November run rate was down 0.7% from the SAAR of 17.52 million units for November 2017.
PMI Manufacturing ISM Index – Released 1/3 – December PMI decreased 5.2% to 54.1% from November’s reading of 59.3%. The New Orders Index was down 11% to 51.1%. The Production Index registered 54.3% down 6.3%.
U.S. Construction Spending – Released 1/3 –Not released on time due to gov’t shutdown) – Last month construction spending decreased slightly by 0.1% in October measuring at a seasonally adjusted annual rate of $1,308.8 billion. The October figure is 4.9% above the October 2017 estimate. Private construction spending was 0.4% below the revised September estimate.
Chicago PMI – Released 12/28 – Chicago PMI decreased 1.0 point in December easing to 65.4, down from 66.4 in November. The Prices Paid indicator was down for the fifth consecutive month and by the largest margin in four years.
New Residential Sales – Released 12/28 – (Not released on time due to gov’t shutdown) Last month sales of new single-family homes declined in October by 8.9% to 544k, seasonally adjusted. The median sales price of new homes sold in October was $309.7k with an average sales price of $395.0k. At the end of October the seasonally adjusted estimate of new homes for sale was 336k. This represents a supply of 7.4 months at the current sales rate.
Consumer Confidence – Released 12/27 – The Consumer confidence index declined in December. The Index now shows a reading of 128.1 down from 136.4 in November. Despite the decline in December and despite weakened expectations regarding job prospects and business conditions, consumer confidence levels still indicate the economy will continue to expand at a solid pace in the short run. Consumer Confidence remains at historically strong levels. Should consumers’ assessment of the current conditions soften further; the pace of economic growth is likely to decline. Back to back declines in Consumer Confidence reflect a growing concern of a moderating pace of economic growth in 2019.
Personal Income – Released 12/21– Personal Income increased 0.2% in November according to the BEA. The majority of this increase was due to increases in wages and salaries and increases in farm proprietor’s income. Real PCE (the Feds preferred inflation gauge) increased 0.3%. Real disposable personal income increased 0.2%. Real Personal Consumption Expenditures (PCE) has risen 1.8% y/y.
3rd Estimate of 3rd Quarter GDP – Released 12/21– According to the third estimate released by the Bureau of Economic Analysis, Real Gross Domestic Product (Real GDP) increased at an annual rate of 3.4% in the third quarter of 2018. This result is slightly lower by 0.1% from 3.5% seen in the second estimate. The general outlook of real GDP remains roughly the same. The third estimate data provided an upward revision to private inventory investment. Downward revisions were reflected in personal consumption expenditures (PCE) and exports.
This report has been prepared without regard to the specific investment objectives, financial situation, and needs of any particular recipient. The information and opinions in this report are for general information use only and are not intended as an offer or solicitation with respect to the purchase or sale of any stock, bond, currency or CFD contract.
Some information contained herein has been obtained from third party sources believed to be reliable, but has not been independently verified by us; its accuracy or completeness is not guaranteed. Our commentary is based on information considered to be reliable, but no representation is made that it is accurate or complete, and should not be relied upon as such.
The views expressed represent the opinions and beliefs at the time of this commentary and are not meant as a market forecast. These views are subject to change at any time based on market or other conditions and Good Life Advisors disclaims any responsibility to update such views. This information may not be relied on as advice or as an indication of trading intent on behalf of any portfolio. Portfolio investments may change at any time.
Economic and performance information referenced is historical and past performance does not guarantee future results. References to future returns are not promises or estimates of actual returns we may achieve, and should not be relied upon.
No investment strategy or risk management process can guarantee returns or eliminate risk in any market environment. Investing in securities involves risk of loss. Stock and Bond prices can decline significantly in response to adverse market conditions, company-specific events, and other domestic and international political and economic developments. Any references to historical price movements or levels is informational based on our analysis and we do not represent or warrant that any such movements or levels are likely to reoccur in the future.
While the information contained herein was obtained from sources believed to be reliable, the author does not guarantee its accuracy or completeness, nor does author assume any liability for any direct, indirect or consequential loss that may result from the reliance by any person upon any such information or opinions.
Data Sources:
Bureau of Economic Analysis (BEA)
Congressional Budget Office (CBO)
U.S. Bureau of Labor Statistics (BLS)
Federal Reserve Economic Data (FRED Charts)
CME Fed Watch
U.S. Treasury – Yields
U.S. Census Bureau
Institute for Supply Management (ISM)
Weekly DOL Employment Data
BLS Monthly Jobs Report
JOLTS
US Energy Admn (EIA)
BLS Consumer Price Index CPI
BLS Producer Price Index PPI
Atlanta Fed GDPNOW
NY Fed Nowcast GDP
US Census Bureau Housing Starts
Consumer Credit
USCB Retail Sales
Construction Spending
Federal Reserve Dot Plots
NY Empire Index
Philadelphia Federal Reserve
P/E Ratio Data -Yardeni Research
Technical Analysis Info:
StockCharts.com – Financial Charts
Exponential vs Simple moving average
Other Links:
1973 Arab Oil Embargo
Hunt Brothers Silver
Long-Term Capital bailout
Categories:
Tags: