Can a Gov’t Shutdown help the Economy?
Short Answer: No – A continued gov’t shutdown will be a negative input for GDP and may carry ripple effects in the economy. If the Gov’t shutdown lasts till Monday, it will be the longest ever at 24 days. This week hundreds of thousands of federal workers missed their first paycheck(s).This includes both TSA and ICE (Immigration and Customs Enforcement). It could be a bad week for travelers both pleasure and business.
POTUS was asked about the plan for the shutdown on Friday, his response: “I do have a plan on the shutdown,” he said “But to understand that plan you would have to understand the fact that I won the election”. I have no idea what that means, but it doesn’t sound like there is a plan other than to let it drag out. Don’t get me wrong, it is certainly possible that an immigration “grand bargain” could be reached. Something like; fully funded border control for resolving DACA. If that doesn’t happen soon I am sure that every week, as more federal workers miss paychecks, it will become harder and harder for vulnerable Republicans to tow the Presidents line. If a deal is not reached soon there will be republican defectors on the Issue.
In non-shutdown news, UK Parliament votes on a Brexit plan on Tuesday. In June 2016 a public referendum was held in the U.K. The voters choose to invoke article 50 of the EU treaty that outlines how to leave the union. It is now the Prime Minister, Theresa May’s job to get that done. She has been cheerleading hard for her Brexit deal, saying that failure to reach an agreement would result in “a catastrophic and unforgivable breach of trust in our democracy”. A hard Brexit would be the result of the UK leaving the EU without some kind of agreement between GB and the EU on trade and immigration. There are real economic dangers of the UK leaving without trade and immigration concessions.
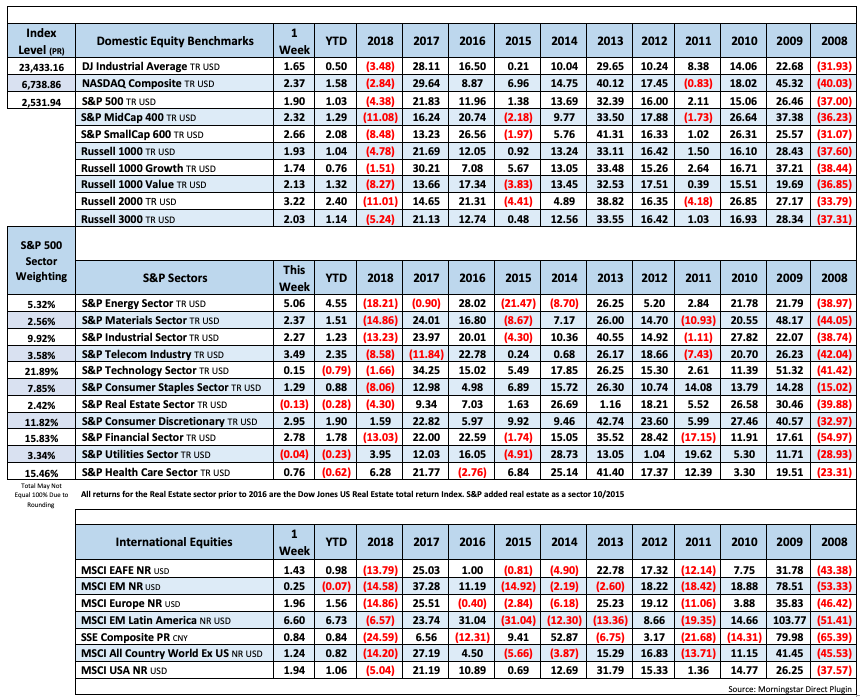
Equity markets continued their bounce this week. The S&P500 adding 1.9%, the Dow rising 1.65%, the Nasdaq, SP400 & SP600 all gaining over 2.3%. Since the recent bottom on Christmas eve the equity markets have all rallied with the S&P gaining 10.4% off the lows and the S&P600 gaining 13.6% since the close on Christmas Eve. It should be noted that US Treasury yields have continued further inversion this week as the 1,2,and 3 year yields are all higher than the 5 year treasury yield.
2018 – A year that produced new all-time-highs as wells as historic drawdowns.
Drawdown 1 – 1/26/2018 – 2/6/2018 SPX 2930 – 2581 Drawdown – 10.01%
Drawdown 2 – 9/20/2018 – 12/24/2018 SPX 2930 – 2351 Drawdown – 19.76%
Low to High 2/11/2016 – 9/20/2018 SPX – 1829 – 2930 Gain – 60.1%
Peak to Peak 5/21/2015 – 9/20/2018 SPX 2130 – 2930 Gain – 37.55%
Fixed Income
The one, two and three year Treasuries are all yielding more than a five year – treasury.gov yields

FOMC December Statement Federal Reserve Dot Plots Dec 18 US Debt Measurement– November Meeting Minutes US Corporate Debt Tops $6 Trillion.
Global Bond Yields
Foreign Exchange Market
The Brexit vote is sure to add volatility to the currency markets this week
Energy Complex
Crude oil bottomed at $50.77 Dec 26, Since then it has rallied 20%. Brent crude oil fell 40% from Oct3 to Dec 24th. $85.98 – $50.77
The Baker Hughes rig count was flat this week. There are 1075 oil and gas rigs operating in the US – Up 136 over last year.
- Brent Crude Oil rose 5.67% this week closing at $60.59/bbl
- WTI Crude Oil gained 7.57% this week to close at $51./bbl
- Heating Oil rose 6.25% this week closing at $1.880/gallon
- Natural Gas gained 1.84% this week closing at $3.099 per million BTUs
- Unleaded Gas rose 3.92% this week at closing at $1.401/gallon
Metals Complex
- Gold rose 0.29% this week closing at $1289.50/oz
- Silver fell 0.82% on the week closing at $15.66/oz
- Palladium rose 3.59% this week closing at $1278.70/oz
- Platinum fell 1.11% this week closing at 818.10/oz
- Copper rose 0.55% this week closing at $2.662/lb
Employment Picture
Job Openings & Labor Turnover Survey – JOLTS Released Monday 12/10 – The number of job openings fell to 6.9 million on the last business day of November, the U.S. Bureau of Labor Statistics reported. Over the month, hires edged down to 5.7 million, quits edged down to 3.4 million, and total separations were little changed at 5.5 million. Within separations, the quits rate and the layoffs and discharges rate were unchanged at 2.3 percent and 1.2 percent, respectively.
December Jobs Report – BLS Summary Released 1/4 – The US Economy added 312k nonfarm jobs in December. The revision for November was upward by 21k and the revision for October was upward 37k. Hiring highlights to include Education and Health care +88k, Leisure and Hospitality +55k, Professional and Business Services +43k, Manufacturing +32k, and Retail Trade +24k.
- Average hourly earnings increased by 11 cents/ 0.4% in December y/y hourly earnings are up 3.2%.
- U3 Civilian unemployment rate edged upward by 0.2% to 3.9%. The U6 unemployment rate remained flat at 7.6%.
- The labor force participation rate increased slightly from 62.9% to 63.1%.
- Average workweek increased by 0.1 hours to 34.5 hours.
Weekly Unemployment Claims – Released Thursday 1/3 – In the week ending January 5th, initial claims were 216,000, a decrease of 17,000 from the previous week’s revised level. The 4-week moving average was 221,750 an increase of 2500 from the previous week’s revised average.
Employment Cost Index – Released 10/31 – Compensation costs for civilian workers increased 2.8% for the 12-month period ending in September 2018 compared with a compensation costs increase of 2.5% in September 2017. Wages and salaries were up 2.9%, versus 2.5% for the 12-month period ending September 2017. Benefit costs increased 2.6%, versus 2.4% in September 2017. For private industry workers, compensation costs increased 2.9% year-over-year, versus 2.5% for the 12 months ending September 2017. Wages and salaries increased 3.1% year-over-year, versus 2.6% for the 12 months ending September 2017. Benefit costs increased 2.5%, versus 2.4% for the 12 months ending September 2017. This report is published quarterly.
This Week’s Economic Data
Consumer Price Index – Released 1/11 – The Consumer Price Index declined 0.1% in December, core CPI, which excludes food and energy increased 0.2%. The monthly changes left total CPI up 1.9% year-over-year, versus 2.2% in November, and core CPI up 2.2%. The decline in total CPI in December was fueled by the energy index and gasoline index. A 0.3% increase in the shelter index drove the increase in core CPI, which was offset somewhat by a 0.2% decline in the price index for used cars and trucks.
Consumer Credit – Released 1/8 – Total outstanding consumer credit increased by 22.2 billion in November. Nonrevolving credit increased by $17.3 billion and revolving credit increased by $4.8 billion. Consumer credit increased at a seasonally adjusted annual rate of 6.75% in November, with revolving credit increased at an annual rate of 5.5% and nonrevolving credit increased at an annual rate of 7.00%.
PMI Non-Manufacturing Index (ISM Services) – Released 1/7 – There was a deceleration in non-manufacturing in December. The ISM Non-Manufacturing Index registered 57.6 points, falling from last months’ 60.7%. This represents continued growth in the non-manufacturing sector, at a slightly slower rate.
Recent Economic Data
PMI Manufacturing ISM Index – Released 1/3 – December PMI decreased 5.2% to 54.1% from November’s reading of 59.3%. The New Orders Index was down 11% to 51.1%. The Production Index registered 54.3% down 6.3%.
U.S. Construction Spending – Released 1/3 – Not released on time due to gov’t shutdown) – Last month construction spending decreased slightly by 0.1% in October measuring at a seasonally adjusted annual rate of $1,308.8 billion. The October figure is 4.9% above the October 2017 estimate. Private construction spending was 0.4% below the revised September estimate.
Chicago PMI – Released 12/28 – Chicago PMI decreased 1.0 point in December easing to 65.4, down from 66.4 in November. The Prices Paid indicator was down for the fifth consecutive month and by the largest margin in four years.
New Residential Sales – Released 12/28 – Not released yet due to gov’t shutdown. Last month sales of new single-family homes declined in October by 8.9% to 544k, seasonally adjusted. The median sales price of new homes sold in October was $309.7k with an average sales price of $395.0k. At the end of October the seasonally adjusted estimate of new homes for sale was 336k. This represents a supply of 7.4 months at the current sales rate.
Consumer Confidence – Released 12/27 – The Consumer confidence index declined in December. The Index now shows a reading of 128.1 down from 136.4 in November. Despite the decline in December and despite weakened expectations regarding job prospects and business conditions, consumer confidence levels still indicate the economy will continue to expand at a solid pace in the short run. Consumer Confidence remains at historically strong levels. Should consumers’ assessment of the current conditions soften further; the pace of economic growth is likely to decline. Back to back declines in Consumer Confidence reflect a growing concern of a moderating pace of economic growth in 2019.
Personal Income – Released 12/21 – Personal Income increased 0.2% in November according to the BEA. The majority of this increase was due to increases in wages and salaries and increases in farm proprietor’s income. Real PCE (the Feds preferred inflation gauge) increased 0.3%. Real disposable personal income increased 0.2%. Real Personal Consumption Expenditures (PCE) has risen 1.8% y/y.
3rd Estimate of 3rd Quarter GDP – Released 12/21 – According to the third estimate released by the Bureau of Economic Analysis, Real Gross Domestic Product (Real GDP) increased at an annual rate of 3.4% in the third quarter of 2018. This result is slightly lower by 0.1% from 3.5% seen in the second estimate. The general outlook of real GDP remains roughly the same. The third estimate data provided an upward revision to private inventory investment. Downward revisions were reflected in personal consumption expenditures (PCE) and exports.
Durable Goods – Released 12/21 – New orders for manufactured durable goods increased $1.9 billion or 0.8% to $250.8 billion in November. This increase follows two consecutive months of decline. Transportation equipment, up 2.9%, drove the increase by $2.5 billion to $87 billion.
Existing Home Sales – Released 12/19 – Existing home sales increased by 1.9% in November. Sales increased to a seasonally adjusted rate of 5.32 million. Sales are currently down 7.0% from one year ago. Housing inventory declined to 3.9 months of inventory and the existing homes for sale declined to 1.74 million. The median sales price for all types of homes was $257,700, up 4.2% year/y.
Housing Starts – Released 12/18 – New home starts in November were at a seasonally adjusted rate of 1.256 million; up 3.2% above October and down 3.6% from last November. Building Permits were at a seasonally adjusted rate of 1.328 million, up 5.0% compared to last month and up 0.4% over last year.
Industrial Production and Capacity Utilization – Released 12/14 – Industrial production rose just 0.6% in November. Manufacturing output was unchanged. Capacity utilization gained 0.4% to78.5%. Utilization is 1.3% below its long-run (1972-2017) average.
Retail Sales – Released 12/14 – Retail Sales increased by 0.2% to $513.5 billion in November. Year over year retail sales increased 4.3%.
Producer Price Index – Released 12/11 – The Producer Price Index for final demand saw an increase of 0.1% in November. Core PPI (less food and energy) increased 0.3%. Year over year the index for final demand rose 2.5%.
US Light Vehicle Sales – Released 12/6 – U.S. light vehicle sales were at a seasonally adjusted annual rate (SAAR) of 17.40 million units in November versus a SAAR of 17.49 million units in October. The November run rate was down 0.7% from the SAAR of 17.52 million units for November 2017.
U.S. Trade Balance – Released 12/6 – The trade deficit rose $0.9 billion in October to – $55.5 billion. Exports were $211.0 billion while imports were $266.5 billion.
This report has been prepared without regard to the specific investment objectives, financial situation and needs of any particular recipient. The information and opinions in this report are for general information use only and are not intended as an offer or solicitation with respect to the purchase or sale of any stock, bond, currency or CFD contract.
Some information contained herein has been obtained from third party sources believed to be reliable, but has not been independently verified by us; its accuracy or completeness is not guaranteed. Our commentary is based on information considered to be reliable, but no representation is made that it is accurate or complete, and should not be relied upon as such.
The views expressed represent the opinions and beliefs at the time of this commentary and are not meant as a market forecast. These views are subject to change at any time based on market or other conditions and Good Life Advisors disclaims any responsibility to update such views. This information may not be relied on as advice or as an indication of trading intent on behalf of any portfolio. Portfolio investments may change at any time.
Economic and performance information referenced is historical and past performance does not guarantee future results. References to future returns are not promises or estimates of actual returns we may achieve, and should not be relied upon.
No investment strategy or risk management process can guarantee returns or eliminate risk in any market environment. Investing in securities involves risk of loss. Stock and Bond prices can decline significantly in response to adverse market conditions, company-specific events, and other domestic and international political and economic developments. Any references to historical price movements or levels is informational based on our analysis and we do not represent or warranty that any such movements or levels are likely to reoccur in the future.
While the information contained herein was obtained from sources believed to be reliable, author does not guarantee its accuracy or completeness, nor does author assume any liability for any direct, indirect or consequential loss that may result from the reliance by any person upon any such information or opinions.
Data Sources:
Bureau of Economic Analysis (BEA)
Congressional Budget Office (CBO)
U.S. Bureau of Labor Statistics (BLS)
Federal Reserve Economic Data (FRED Charts)
CME Fed Watch
U.S. Treasury – Yields
U.S. Census Bureau
Institute for Supply Management (ISM)
Weekly DOL Employment Data
BLS Monthly Jobs Report
JOLTS
US Energy Admn (EIA)
BLS Consumer Price Index CPI
BLS Producer Price Index PPI
Atlanta Fed GDPNOW
NY Fed Nowcast GDP
US Census Bureau Housing Starts
Consumer Credit
USCB Retail Sales
Construction Spending
Federal Reserve Dot Plots
NY Empire Index
Philadelphia Federal Reserve
P/E Ratio Data -Yardeni Research
Technical Analysis Info:
StockCharts.com – Financial Charts
Exponential vs Simple moving average
Other Links:
1973 Arab Oil Embargo
Hunt Brothers Silver
Long-Term Capital bailout


Week 2 #2 Talking Points
Can a Gov’t Shutdown help the Economy?
Short Answer: No – A continued gov’t shutdown will be a negative input for GDP and may carry ripple effects in the economy. If the Gov’t shutdown lasts till Monday, it will be the longest ever at 24 days. This week hundreds of thousands of federal workers missed their first paycheck(s).This includes both TSA and ICE (Immigration and Customs Enforcement). It could be a bad week for travelers both pleasure and business.
POTUS was asked about the plan for the shutdown on Friday, his response: “I do have a plan on the shutdown,” he said “But to understand that plan you would have to understand the fact that I won the election”. I have no idea what that means, but it doesn’t sound like there is a plan other than to let it drag out. Don’t get me wrong, it is certainly possible that an immigration “grand bargain” could be reached. Something like; fully funded border control for resolving DACA. If that doesn’t happen soon I am sure that every week, as more federal workers miss paychecks, it will become harder and harder for vulnerable Republicans to tow the Presidents line. If a deal is not reached soon there will be republican defectors on the Issue.
In non-shutdown news, UK Parliament votes on a Brexit plan on Tuesday. In June 2016 a public referendum was held in the U.K. The voters choose to invoke article 50 of the EU treaty that outlines how to leave the union. It is now the Prime Minister, Theresa May’s job to get that done. She has been cheerleading hard for her Brexit deal, saying that failure to reach an agreement would result in “a catastrophic and unforgivable breach of trust in our democracy”. A hard Brexit would be the result of the UK leaving the EU without some kind of agreement between GB and the EU on trade and immigration. There are real economic dangers of the UK leaving without trade and immigration concessions.
Equity markets continued their bounce this week. The S&P500 adding 1.9%, the Dow rising 1.65%, the Nasdaq, SP400 & SP600 all gaining over 2.3%. Since the recent bottom on Christmas eve the equity markets have all rallied with the S&P gaining 10.4% off the lows and the S&P600 gaining 13.6% since the close on Christmas Eve. It should be noted that US Treasury yields have continued further inversion this week as the 1,2,and 3 year yields are all higher than the 5 year treasury yield.
2018 – A year that produced new all-time-highs as wells as historic drawdowns.
Drawdown 1 – 1/26/2018 – 2/6/2018 SPX 2930 – 2581 Drawdown – 10.01%
Drawdown 2 – 9/20/2018 – 12/24/2018 SPX 2930 – 2351 Drawdown – 19.76%
Low to High 2/11/2016 – 9/20/2018 SPX – 1829 – 2930 Gain – 60.1%
Peak to Peak 5/21/2015 – 9/20/2018 SPX 2130 – 2930 Gain – 37.55%
Table of Contents
Fixed Income
The one, two and three year Treasuries are all yielding more than a five year – treasury.gov yields
FOMC December Statement Federal Reserve Dot Plots Dec 18 US Debt Measurement– November Meeting Minutes US Corporate Debt Tops $6 Trillion.
Global Bond Yields
Foreign Exchange Market
The Brexit vote is sure to add volatility to the currency markets this week
Energy Complex
Crude oil bottomed at $50.77 Dec 26, Since then it has rallied 20%. Brent crude oil fell 40% from Oct3 to Dec 24th. $85.98 – $50.77
The Baker Hughes rig count was flat this week. There are 1075 oil and gas rigs operating in the US – Up 136 over last year.
Metals Complex
Employment Picture
Job Openings & Labor Turnover Survey – JOLTS Released Monday 12/10 – The number of job openings fell to 6.9 million on the last business day of November, the U.S. Bureau of Labor Statistics reported. Over the month, hires edged down to 5.7 million, quits edged down to 3.4 million, and total separations were little changed at 5.5 million. Within separations, the quits rate and the layoffs and discharges rate were unchanged at 2.3 percent and 1.2 percent, respectively.
December Jobs Report – BLS Summary Released 1/4 – The US Economy added 312k nonfarm jobs in December. The revision for November was upward by 21k and the revision for October was upward 37k. Hiring highlights to include Education and Health care +88k, Leisure and Hospitality +55k, Professional and Business Services +43k, Manufacturing +32k, and Retail Trade +24k.
Weekly Unemployment Claims – Released Thursday 1/3 – In the week ending January 5th, initial claims were 216,000, a decrease of 17,000 from the previous week’s revised level. The 4-week moving average was 221,750 an increase of 2500 from the previous week’s revised average.
Employment Cost Index – Released 10/31 – Compensation costs for civilian workers increased 2.8% for the 12-month period ending in September 2018 compared with a compensation costs increase of 2.5% in September 2017. Wages and salaries were up 2.9%, versus 2.5% for the 12-month period ending September 2017. Benefit costs increased 2.6%, versus 2.4% in September 2017. For private industry workers, compensation costs increased 2.9% year-over-year, versus 2.5% for the 12 months ending September 2017. Wages and salaries increased 3.1% year-over-year, versus 2.6% for the 12 months ending September 2017. Benefit costs increased 2.5%, versus 2.4% for the 12 months ending September 2017. This report is published quarterly.
This Week’s Economic Data
Consumer Price Index – Released 1/11 – The Consumer Price Index declined 0.1% in December, core CPI, which excludes food and energy increased 0.2%. The monthly changes left total CPI up 1.9% year-over-year, versus 2.2% in November, and core CPI up 2.2%. The decline in total CPI in December was fueled by the energy index and gasoline index. A 0.3% increase in the shelter index drove the increase in core CPI, which was offset somewhat by a 0.2% decline in the price index for used cars and trucks.
Consumer Credit – Released 1/8 – Total outstanding consumer credit increased by 22.2 billion in November. Nonrevolving credit increased by $17.3 billion and revolving credit increased by $4.8 billion. Consumer credit increased at a seasonally adjusted annual rate of 6.75% in November, with revolving credit increased at an annual rate of 5.5% and nonrevolving credit increased at an annual rate of 7.00%.
PMI Non-Manufacturing Index (ISM Services) – Released 1/7 – There was a deceleration in non-manufacturing in December. The ISM Non-Manufacturing Index registered 57.6 points, falling from last months’ 60.7%. This represents continued growth in the non-manufacturing sector, at a slightly slower rate.
Recent Economic Data
PMI Manufacturing ISM Index – Released 1/3 – December PMI decreased 5.2% to 54.1% from November’s reading of 59.3%. The New Orders Index was down 11% to 51.1%. The Production Index registered 54.3% down 6.3%.
U.S. Construction Spending – Released 1/3 – Not released on time due to gov’t shutdown) – Last month construction spending decreased slightly by 0.1% in October measuring at a seasonally adjusted annual rate of $1,308.8 billion. The October figure is 4.9% above the October 2017 estimate. Private construction spending was 0.4% below the revised September estimate.
Chicago PMI – Released 12/28 – Chicago PMI decreased 1.0 point in December easing to 65.4, down from 66.4 in November. The Prices Paid indicator was down for the fifth consecutive month and by the largest margin in four years.
New Residential Sales – Released 12/28 – Not released yet due to gov’t shutdown. Last month sales of new single-family homes declined in October by 8.9% to 544k, seasonally adjusted. The median sales price of new homes sold in October was $309.7k with an average sales price of $395.0k. At the end of October the seasonally adjusted estimate of new homes for sale was 336k. This represents a supply of 7.4 months at the current sales rate.
Consumer Confidence – Released 12/27 – The Consumer confidence index declined in December. The Index now shows a reading of 128.1 down from 136.4 in November. Despite the decline in December and despite weakened expectations regarding job prospects and business conditions, consumer confidence levels still indicate the economy will continue to expand at a solid pace in the short run. Consumer Confidence remains at historically strong levels. Should consumers’ assessment of the current conditions soften further; the pace of economic growth is likely to decline. Back to back declines in Consumer Confidence reflect a growing concern of a moderating pace of economic growth in 2019.
Personal Income – Released 12/21 – Personal Income increased 0.2% in November according to the BEA. The majority of this increase was due to increases in wages and salaries and increases in farm proprietor’s income. Real PCE (the Feds preferred inflation gauge) increased 0.3%. Real disposable personal income increased 0.2%. Real Personal Consumption Expenditures (PCE) has risen 1.8% y/y.
3rd Estimate of 3rd Quarter GDP – Released 12/21 – According to the third estimate released by the Bureau of Economic Analysis, Real Gross Domestic Product (Real GDP) increased at an annual rate of 3.4% in the third quarter of 2018. This result is slightly lower by 0.1% from 3.5% seen in the second estimate. The general outlook of real GDP remains roughly the same. The third estimate data provided an upward revision to private inventory investment. Downward revisions were reflected in personal consumption expenditures (PCE) and exports.
Durable Goods – Released 12/21 – New orders for manufactured durable goods increased $1.9 billion or 0.8% to $250.8 billion in November. This increase follows two consecutive months of decline. Transportation equipment, up 2.9%, drove the increase by $2.5 billion to $87 billion.
Existing Home Sales – Released 12/19 – Existing home sales increased by 1.9% in November. Sales increased to a seasonally adjusted rate of 5.32 million. Sales are currently down 7.0% from one year ago. Housing inventory declined to 3.9 months of inventory and the existing homes for sale declined to 1.74 million. The median sales price for all types of homes was $257,700, up 4.2% year/y.
Housing Starts – Released 12/18 – New home starts in November were at a seasonally adjusted rate of 1.256 million; up 3.2% above October and down 3.6% from last November. Building Permits were at a seasonally adjusted rate of 1.328 million, up 5.0% compared to last month and up 0.4% over last year.
Industrial Production and Capacity Utilization – Released 12/14 – Industrial production rose just 0.6% in November. Manufacturing output was unchanged. Capacity utilization gained 0.4% to78.5%. Utilization is 1.3% below its long-run (1972-2017) average.
Retail Sales – Released 12/14 – Retail Sales increased by 0.2% to $513.5 billion in November. Year over year retail sales increased 4.3%.
Producer Price Index – Released 12/11 – The Producer Price Index for final demand saw an increase of 0.1% in November. Core PPI (less food and energy) increased 0.3%. Year over year the index for final demand rose 2.5%.
US Light Vehicle Sales – Released 12/6 – U.S. light vehicle sales were at a seasonally adjusted annual rate (SAAR) of 17.40 million units in November versus a SAAR of 17.49 million units in October. The November run rate was down 0.7% from the SAAR of 17.52 million units for November 2017.
U.S. Trade Balance – Released 12/6 – The trade deficit rose $0.9 billion in October to – $55.5 billion. Exports were $211.0 billion while imports were $266.5 billion.
This report has been prepared without regard to the specific investment objectives, financial situation and needs of any particular recipient. The information and opinions in this report are for general information use only and are not intended as an offer or solicitation with respect to the purchase or sale of any stock, bond, currency or CFD contract.
Some information contained herein has been obtained from third party sources believed to be reliable, but has not been independently verified by us; its accuracy or completeness is not guaranteed. Our commentary is based on information considered to be reliable, but no representation is made that it is accurate or complete, and should not be relied upon as such.
The views expressed represent the opinions and beliefs at the time of this commentary and are not meant as a market forecast. These views are subject to change at any time based on market or other conditions and Good Life Advisors disclaims any responsibility to update such views. This information may not be relied on as advice or as an indication of trading intent on behalf of any portfolio. Portfolio investments may change at any time.
Economic and performance information referenced is historical and past performance does not guarantee future results. References to future returns are not promises or estimates of actual returns we may achieve, and should not be relied upon.
No investment strategy or risk management process can guarantee returns or eliminate risk in any market environment. Investing in securities involves risk of loss. Stock and Bond prices can decline significantly in response to adverse market conditions, company-specific events, and other domestic and international political and economic developments. Any references to historical price movements or levels is informational based on our analysis and we do not represent or warranty that any such movements or levels are likely to reoccur in the future.
While the information contained herein was obtained from sources believed to be reliable, author does not guarantee its accuracy or completeness, nor does author assume any liability for any direct, indirect or consequential loss that may result from the reliance by any person upon any such information or opinions.
Data Sources:
Bureau of Economic Analysis (BEA)
Congressional Budget Office (CBO)
U.S. Bureau of Labor Statistics (BLS)
Federal Reserve Economic Data (FRED Charts)
CME Fed Watch
U.S. Treasury – Yields
U.S. Census Bureau
Institute for Supply Management (ISM)
Weekly DOL Employment Data
BLS Monthly Jobs Report
JOLTS
US Energy Admn (EIA)
BLS Consumer Price Index CPI
BLS Producer Price Index PPI
Atlanta Fed GDPNOW
NY Fed Nowcast GDP
US Census Bureau Housing Starts
Consumer Credit
USCB Retail Sales
Construction Spending
Federal Reserve Dot Plots
NY Empire Index
Philadelphia Federal Reserve
P/E Ratio Data -Yardeni Research
Technical Analysis Info:
StockCharts.com – Financial Charts
Exponential vs Simple moving average
Other Links:
1973 Arab Oil Embargo
Hunt Brothers Silver
Long-Term Capital bailout
Categories:
Tags: