Good Life Advisors – Talking Points – Week 4
“We’re Going to be Guided by the Data” – J. Powell, Wednesday 1/26
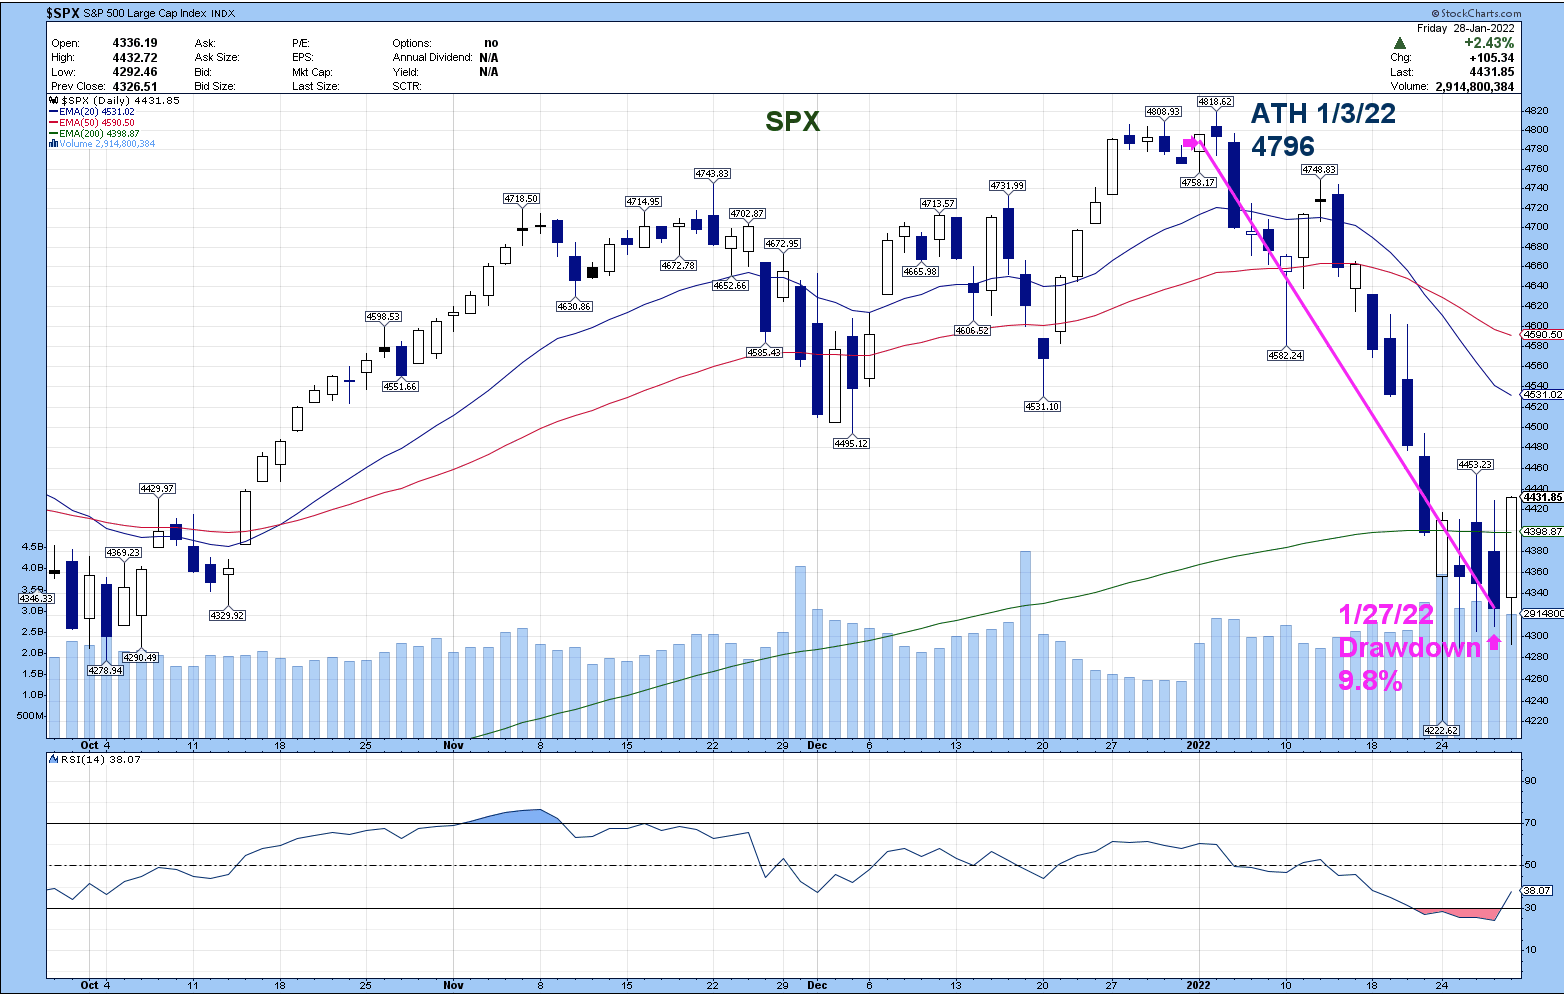
The S&P 500 hit an All-Time closing high (4,796) on January 3rd, the second trading day of 2022. 17 Days later it closed at 4,326, a drawdown of 9.8%. On an intraday basis (not using closing prices) the max drawdown this year is 12.3%. In this case the intraday ATH (4,818) was on the 4th and the low (4,222) was Thursday, it only took 14 days.
The fact of the matter is that the Fed will be raising rates for the 1st time since December 2018 very soon. Some are suggesting that they may even start with 50 bps hike. Below, you’re looking at the CME Fed Rate Watch tool for year-end 2022. Take a look at the differences over the last month. The market went from pricing in two to three hikes to currently looking at four to five, in a month. During that same time period the yield on the one-year US Treasury doubled, yep doubled. It rose from 38bps on January 4th to 75bps on Friday. For investors looking at buying short term CDs or bonds that’s music to their ears, for others it signals the ends of really, really cheap money.

The S&P 500 moved into correction territory on an intraday basis several times this week but rallied on Friday afternoon to finish higher. Prior days saw rallies ascribed to little other than oversold conditions and an anticipated buy-the-dip reaction, but these ultimately proved short-lived. Despite the Friday run-up, sentiment remains fairly cautious, and the path of least resistance seems to remain to the downside. The market reacted negatively to this week’s FOMC meeting, judging that the recent hawkish-Fed repricing has more room to run. The ongoing Q4 earnings season also continued to prove underwhelming, with reports tending to throw concerns about supply disruptions and higher costs into sharp relief. And while the market has tended to largely ignore geopolitics, the unsettled Russia-Ukraine situation is offering no help. Nevertheless, there was also a sense that the elements of the bullish case remain in evidence, including continued inflows, returning corporate buyback activity, waning Omicron pressures-and of course, potentially more attractive valuations.
The FOMC’s meeting this made no change to rates and reduced asset purchases in line with expectations, but the market’s focus was on how the Fed set itself up for a rate liftoff and reducing the balance sheet. The meeting statement said members expect that a rate hike “will soon be appropriate” given high inflation and a strong labor market, with the Fed at the same time releasing a set of broad principles regarding balance-sheet runoff (which will start after liftoff has begun). Powell’s press-conference commentary was seen as leaning hawkish. For instance, he stressed how current circumstances differ from prior cycles, which may mean normalization could start sooner and move faster. He also failed to push back robustly on notions of a 50bp hike or consecutive raises. Investors came away from the meeting with a greater conviction that every 2022 meeting may be “live,” and consequently the market priced in additional rate hikes (consensus is now looking for five hikes through the end of 2022.
Q4 GDP came in well ahead of consensus at a 6.9% SAAR, the fastest quarterly rise since Q3’20. The increase was powered by an increase in private inventory investment (particularly among auto dealers). December durable goods orders and core capital goods orders (non-defense, ex-aircraft) were both weaker than expectations. December new home sales posted their best month since March 2021, while the month’s pending home sales were weaker amid scarce inventories. January consumer confidence ticked down a bit m/m, with the release noting that concerns about inflation dropped for the second straight month. In contrast, the final read of the January UMich consumer sentiment index registered its lowest level since 2011. Finally, Friday saw some better-than-feared results on the inflation front. December core PCE was up 0.5% m/m, in line with consensus and little changed from the prior two months. At the same time, Q4’s employment cost index was up 1.0% q/q, below forecast for 1.2%.
Fixed Income
December FOMC Statement Credit, Liquidity and Balance Sheet Federal Reserve Dot Plots Dec 21′
US Corporate Debt Tops 7 Trillion. Treasury.gov yields FOMC Policy Normalization Statement Longer Run Goals August 2020
Global Bond Yields
Daily US Treasury Yields
Foreign Exchange Market
Energy Complex
The Baker Hughes rig count increased by 6 this week. There are 610 oil and gas rigs operating in the US – Up 226 over last year.
Metals Complex
Employment Picture
Weekly Unemployment Claims – Released Thursday 1/27/2022 – The week ending January 22ndobserved a decrease of 30k in initial claims currently at 260k. The four-week moving average of initial jobless claims increased 15k to 247k.
December Jobs Report – BLS Summary Released 1/7/2022 – The US Economy added 199k nonfarm jobs in December and the Unemployment rate edged down to 3.9%. Average hourly earnings increased by 19 cents to $31.31. Hiring highlights include +53k Leisure and Hospitality, +43k Professional and Business Services, and +26 in Manufacturing.
- Average hourly earnings increased by 19 cents to $31.31.
- U3 unemployment rate declined 0.3% to 3.9%. U6 unemployment rate declined to 7.3%.
- The labor force participation rate was unchanged at 61.9%.
- Average work week was unchanged at 34.7 hours.
Job Openings & Labor Turnover Survey JOLTS – Released 1/4/2022 – The U.S. Bureau of Labor Statistics reported the number and rate of job openings decreased to 10.6 million on the last business day of November. Over the month, hires were little changed at 6.7 million and separations increased to 6.3 million. Within separations, the quits rate increased to 3.0%. The layoffs and discharges rates were unchanged at 0.9%.
Employment Cost Index – Released 10/29/2021 – Compensation costs for civilian workers increased 1.3% for the 3-month period ending in September 2021. The 12-month period ending in September 2021 saw compensation costs increase by 3.7%. The 12-month period ending September 2020 increased 2.4%. Wages and salaries increased 4.2 percent over the year and increased 2.5 percent for the 12-month period ending in September 2020. Benefit costs increased 2.5 percent over the year and increased 2.3 percent for the 12-month period ending in September 2020. This report is published quarterly.
This Week’s Economic Data
Links take you to the data source
Personal Income – Released 1/28/2022 – Personal income increased $70.7 billion or 0.3 percent in December according to estimates released today by the Bureau of Economic Analysis. Disposable personal income (DPI) increased $39.9 billion or 0.2 percent and personal consumption expenditures (PCE) decreased $95.2 billion or 0.6 percent.
Advance Estimate of 4th Quarter 2021 GDP – Released 1/27/2022 – Real gross domestic product (GDP) increased at an annual rate of 6.9 percent in the fourth quarter of 2021, according to the advance estimate released by the Bureau of Economic Analysis. GDP increased 2.3 percent in the third quarter of 2021. The advance estimate is based on source data that are incomplete and subject to additional revision. The increase in real GDP primarily reflected increases in private inventory investment, exports, personal consumption expenditures (PCE), and nonresidential fixed investment that were partly offset by decreases in both federal and state and local government spending. Imports, which are a subtraction in the calculation of GDP, increased
Durable Goods – Released 1/27/2022 – New orders for manufactured durable goods in December decreased $2.4 billion or 0.9% to $267.6 billion. Transportation equipment led the decrease declining $3.3 billion or 3.9% to $80.1 billion.
New Residential Sales – Released 1/26/2022 – Sales of new single-family homes increased 11.9% to 811k, seasonally adjusted, in December. The median sales price of new homes sold in December was $377,700 with an average sales price of $457,300. At the end of December, the seasonally adjusted estimate of new homes for sale was 403k. This represents a supply of 6.0 months at the current sales rate.
Consumer Confidence – Released 1/25/2022 – The Consumer confidence index decreased in January following an increase in December. The Index now stands at 113.8, down from 115.2 in December.
Recent Economic Data
Links take you to the data source
Existing Home Sales – Released 1/20/2022 – Existing home sales decreased in December ending three months of increased sales. Sales declined 4.6% to a seasonally adjusted rate of 6.18 million in December. Sales increased 8.5% in 2021. Housing inventory sits at 910k units. Down 18% from November’s inventory. Down 14.2% over last year. Unsold inventory sits at a 1.8-month supply. The median existing home price for all housing types was $358,000 which is up 15.8% from December 2020.
Housing Starts – Released 1/19/2022 – New home starts in December were at a seasonally adjusted annual rate of 1.702 million; up 1.4% above November, and 2.5% above last December’s rate. Building Permits were at a seasonally adjusted annual rate of 1.873 million, up 9.1% compared to November, and up 6.5% over last year.
Industrial Production and Capacity Utilization – Released 1/14/2022 – In December Industrial production decreased 0.1%. Manufacturing decreased 0.3%. Utilities output decreased 1.5%. Mining output increased 2.0%. Total industrial production was 3.7% higher in December than a year ago. Total capacity utilization decreased 0.1% to 76.5% in December which is 3.1% below its long run average.
Retail Sales – Released 1/14/2022 – U.S. retail sales for December decreased 1.9% to $626.8 billion but retail sales are 16.9% above December 2020. U.S. retail sales for the October 2021 through December 2021 period were up 17.1% from the same period a year ago.
Producer Price Index – Released 1/13/2022 – The Producer Price Index for final demand increased 0.2% in December. PPI less food and energy increased 0.5%. The change in PPI for final demand has increased 9.7% year/y.
Consumer Price Index – Released 1/12/2022 – Consumer prices rose 0.5% m/m in December following a 0.8% gain in November. Consumer prices are up 7.0% for the 12-month period ending in December. Core consumer prices increased 0.6% m/m in December following a 0.5% gain in November.
Consumer Credit – Released 1/7/2022 – Consumer credit increased at a seasonally adjusted annual rate of 11.0 percent in November. Revolving credit increased at an annual rate of 23.4 percent, while nonrevolving credit increased at an annual rate of 7.2 percent.
U.S. Trade Balance – Released 1/6/2022 – According to the U.S. Census Bureau of Economic Analysis the goods and services deficit increased in November by $13 billion to $80.2 billion. November exports were $224.2 billion, $0.4 billion more than October exports. November imports were $304.4 billion, $13.4 billion more than October imports. Year to date the goods and services deficit increased $174.6 billion or 28.6%, from the same period in 2020. Year to date exports and imports increased $354.4 billion or 18.2% and increased $529.0 billion or 20.7% respectively.
PMI Non-Manufacturing Index – Released 1/6/2022 – Economic activity in the non-manufacturing sector grew in November for the 19th consecutive month. ISM Non-Manufacturing registered 62.0 percent, which is 7.1 percentage points below the adjusted November reading of 69.1 percent.
PMI Manufacturing Index – Released 1/3/2022 – December PMI decreased 2.4% to 58.7% down from November’s reading of 61.1%. The New Orders Index was 60.4% down 1.1% from November’s reading of 61.5%. The Production Index registered 59.2%, down 2.3%.
U.S. Construction Spending – Released 1/3/2022 – Construction spending increased 0.4% in November measuring at a seasonally adjusted annual rate of $1,625.9 billion. The November figure is 9.3% above the November 2020 estimate. Private construction spending was 0.6% above the revised October estimate at $1,273.6 billion. Public construction spending was 0.2% below the revised October estimate at $352.3 billion.
Chicago PMI – Released 12/31/2021 – Chicago PMI increased to 63.1 points in December. Among the main five indicators, Production and New Orders and were higher. Order Backlogs, Employment and Supplier Deliveries fell across the month.
US Light Vehicle Sales – Released 12/23/2021 – U.S. light vehicle sales were at a seasonally adjusted annual rate (SAAR) of 12.857 million units in November.
Next week we get data on Chicago PMI, U.S. Construction Spending, Manufacturing PMI, Services PMI, JOLTS, the Employment Cost Index, and the January Jobs Report.
Data Sources:
Bureau of Economic Analysis (BEA)
Congressional Budget Office (CBO)
U.S. Bureau of Labor Statistics (BLS)
Federal Reserve Economic Data (FRED Charts)
CME Fed Watch
U.S. Treasury – Yields
U.S. Census Bureau
Institute for Supply Management (ISM)
Weekly DOL Employment Data
BLS Monthly Jobs Report
JOLTS
US Energy Admin (EIA)
BLS Consumer Price Index CPI
BLS Producer Price Index PPI
Atlanta Fed GDPNOW
NY Fed Nowcast GDP
US Census Bureau Housing Starts
Consumer Credit
USCB Retail Sales
Construction Spending
Federal Reserve Dot Plots
NY Empire Index
Philadelphia Federal Reserve
P/E Ratio Data -Yardeni Research
Technical Analysis Info:
StockCharts.com – Financial Charts
Exponential vs Simple moving average
Other Links:
1973 Arab Oil Embargo
Hunt Brothers Silver
Long-Term Capital bailout


Week 4 Talking Points
Good Life Advisors – Talking Points – Week 4
“We’re Going to be Guided by the Data” – J. Powell, Wednesday 1/26
The S&P 500 hit an All-Time closing high (4,796) on January 3rd, the second trading day of 2022. 17 Days later it closed at 4,326, a drawdown of 9.8%. On an intraday basis (not using closing prices) the max drawdown this year is 12.3%. In this case the intraday ATH (4,818) was on the 4th and the low (4,222) was Thursday, it only took 14 days.
The fact of the matter is that the Fed will be raising rates for the 1st time since December 2018 very soon. Some are suggesting that they may even start with 50 bps hike. Below, you’re looking at the CME Fed Rate Watch tool for year-end 2022. Take a look at the differences over the last month. The market went from pricing in two to three hikes to currently looking at four to five, in a month. During that same time period the yield on the one-year US Treasury doubled, yep doubled. It rose from 38bps on January 4th to 75bps on Friday. For investors looking at buying short term CDs or bonds that’s music to their ears, for others it signals the ends of really, really cheap money.
The S&P 500 moved into correction territory on an intraday basis several times this week but rallied on Friday afternoon to finish higher. Prior days saw rallies ascribed to little other than oversold conditions and an anticipated buy-the-dip reaction, but these ultimately proved short-lived. Despite the Friday run-up, sentiment remains fairly cautious, and the path of least resistance seems to remain to the downside. The market reacted negatively to this week’s FOMC meeting, judging that the recent hawkish-Fed repricing has more room to run. The ongoing Q4 earnings season also continued to prove underwhelming, with reports tending to throw concerns about supply disruptions and higher costs into sharp relief. And while the market has tended to largely ignore geopolitics, the unsettled Russia-Ukraine situation is offering no help. Nevertheless, there was also a sense that the elements of the bullish case remain in evidence, including continued inflows, returning corporate buyback activity, waning Omicron pressures-and of course, potentially more attractive valuations.
The FOMC’s meeting this made no change to rates and reduced asset purchases in line with expectations, but the market’s focus was on how the Fed set itself up for a rate liftoff and reducing the balance sheet. The meeting statement said members expect that a rate hike “will soon be appropriate” given high inflation and a strong labor market, with the Fed at the same time releasing a set of broad principles regarding balance-sheet runoff (which will start after liftoff has begun). Powell’s press-conference commentary was seen as leaning hawkish. For instance, he stressed how current circumstances differ from prior cycles, which may mean normalization could start sooner and move faster. He also failed to push back robustly on notions of a 50bp hike or consecutive raises. Investors came away from the meeting with a greater conviction that every 2022 meeting may be “live,” and consequently the market priced in additional rate hikes (consensus is now looking for five hikes through the end of 2022.
Q4 GDP came in well ahead of consensus at a 6.9% SAAR, the fastest quarterly rise since Q3’20. The increase was powered by an increase in private inventory investment (particularly among auto dealers). December durable goods orders and core capital goods orders (non-defense, ex-aircraft) were both weaker than expectations. December new home sales posted their best month since March 2021, while the month’s pending home sales were weaker amid scarce inventories. January consumer confidence ticked down a bit m/m, with the release noting that concerns about inflation dropped for the second straight month. In contrast, the final read of the January UMich consumer sentiment index registered its lowest level since 2011. Finally, Friday saw some better-than-feared results on the inflation front. December core PCE was up 0.5% m/m, in line with consensus and little changed from the prior two months. At the same time, Q4’s employment cost index was up 1.0% q/q, below forecast for 1.2%.
Table of Contents
Fixed Income
December FOMC Statement Credit, Liquidity and Balance Sheet Federal Reserve Dot Plots Dec 21′
US Corporate Debt Tops 7 Trillion. Treasury.gov yields FOMC Policy Normalization Statement Longer Run Goals August 2020
Global Bond Yields
Daily US Treasury Yields
Foreign Exchange Market
Energy Complex
The Baker Hughes rig count increased by 6 this week. There are 610 oil and gas rigs operating in the US – Up 226 over last year.
Metals Complex
Employment Picture
Weekly Unemployment Claims – Released Thursday 1/27/2022 – The week ending January 22ndobserved a decrease of 30k in initial claims currently at 260k. The four-week moving average of initial jobless claims increased 15k to 247k.
December Jobs Report – BLS Summary Released 1/7/2022 – The US Economy added 199k nonfarm jobs in December and the Unemployment rate edged down to 3.9%. Average hourly earnings increased by 19 cents to $31.31. Hiring highlights include +53k Leisure and Hospitality, +43k Professional and Business Services, and +26 in Manufacturing.
Job Openings & Labor Turnover Survey JOLTS – Released 1/4/2022 – The U.S. Bureau of Labor Statistics reported the number and rate of job openings decreased to 10.6 million on the last business day of November. Over the month, hires were little changed at 6.7 million and separations increased to 6.3 million. Within separations, the quits rate increased to 3.0%. The layoffs and discharges rates were unchanged at 0.9%.
Employment Cost Index – Released 10/29/2021 – Compensation costs for civilian workers increased 1.3% for the 3-month period ending in September 2021. The 12-month period ending in September 2021 saw compensation costs increase by 3.7%. The 12-month period ending September 2020 increased 2.4%. Wages and salaries increased 4.2 percent over the year and increased 2.5 percent for the 12-month period ending in September 2020. Benefit costs increased 2.5 percent over the year and increased 2.3 percent for the 12-month period ending in September 2020. This report is published quarterly.
This Week’s Economic Data
Links take you to the data source
Personal Income – Released 1/28/2022 – Personal income increased $70.7 billion or 0.3 percent in December according to estimates released today by the Bureau of Economic Analysis. Disposable personal income (DPI) increased $39.9 billion or 0.2 percent and personal consumption expenditures (PCE) decreased $95.2 billion or 0.6 percent.
Advance Estimate of 4th Quarter 2021 GDP – Released 1/27/2022 – Real gross domestic product (GDP) increased at an annual rate of 6.9 percent in the fourth quarter of 2021, according to the advance estimate released by the Bureau of Economic Analysis. GDP increased 2.3 percent in the third quarter of 2021. The advance estimate is based on source data that are incomplete and subject to additional revision. The increase in real GDP primarily reflected increases in private inventory investment, exports, personal consumption expenditures (PCE), and nonresidential fixed investment that were partly offset by decreases in both federal and state and local government spending. Imports, which are a subtraction in the calculation of GDP, increased
Durable Goods – Released 1/27/2022 – New orders for manufactured durable goods in December decreased $2.4 billion or 0.9% to $267.6 billion. Transportation equipment led the decrease declining $3.3 billion or 3.9% to $80.1 billion.
New Residential Sales – Released 1/26/2022 – Sales of new single-family homes increased 11.9% to 811k, seasonally adjusted, in December. The median sales price of new homes sold in December was $377,700 with an average sales price of $457,300. At the end of December, the seasonally adjusted estimate of new homes for sale was 403k. This represents a supply of 6.0 months at the current sales rate.
Consumer Confidence – Released 1/25/2022 – The Consumer confidence index decreased in January following an increase in December. The Index now stands at 113.8, down from 115.2 in December.
Recent Economic Data
Links take you to the data source
Existing Home Sales – Released 1/20/2022 – Existing home sales decreased in December ending three months of increased sales. Sales declined 4.6% to a seasonally adjusted rate of 6.18 million in December. Sales increased 8.5% in 2021. Housing inventory sits at 910k units. Down 18% from November’s inventory. Down 14.2% over last year. Unsold inventory sits at a 1.8-month supply. The median existing home price for all housing types was $358,000 which is up 15.8% from December 2020.
Housing Starts – Released 1/19/2022 – New home starts in December were at a seasonally adjusted annual rate of 1.702 million; up 1.4% above November, and 2.5% above last December’s rate. Building Permits were at a seasonally adjusted annual rate of 1.873 million, up 9.1% compared to November, and up 6.5% over last year.
Industrial Production and Capacity Utilization – Released 1/14/2022 – In December Industrial production decreased 0.1%. Manufacturing decreased 0.3%. Utilities output decreased 1.5%. Mining output increased 2.0%. Total industrial production was 3.7% higher in December than a year ago. Total capacity utilization decreased 0.1% to 76.5% in December which is 3.1% below its long run average.
Retail Sales – Released 1/14/2022 – U.S. retail sales for December decreased 1.9% to $626.8 billion but retail sales are 16.9% above December 2020. U.S. retail sales for the October 2021 through December 2021 period were up 17.1% from the same period a year ago.
Producer Price Index – Released 1/13/2022 – The Producer Price Index for final demand increased 0.2% in December. PPI less food and energy increased 0.5%. The change in PPI for final demand has increased 9.7% year/y.
Consumer Price Index – Released 1/12/2022 – Consumer prices rose 0.5% m/m in December following a 0.8% gain in November. Consumer prices are up 7.0% for the 12-month period ending in December. Core consumer prices increased 0.6% m/m in December following a 0.5% gain in November.
Consumer Credit – Released 1/7/2022 – Consumer credit increased at a seasonally adjusted annual rate of 11.0 percent in November. Revolving credit increased at an annual rate of 23.4 percent, while nonrevolving credit increased at an annual rate of 7.2 percent.
U.S. Trade Balance – Released 1/6/2022 – According to the U.S. Census Bureau of Economic Analysis the goods and services deficit increased in November by $13 billion to $80.2 billion. November exports were $224.2 billion, $0.4 billion more than October exports. November imports were $304.4 billion, $13.4 billion more than October imports. Year to date the goods and services deficit increased $174.6 billion or 28.6%, from the same period in 2020. Year to date exports and imports increased $354.4 billion or 18.2% and increased $529.0 billion or 20.7% respectively.
PMI Non-Manufacturing Index – Released 1/6/2022 – Economic activity in the non-manufacturing sector grew in November for the 19th consecutive month. ISM Non-Manufacturing registered 62.0 percent, which is 7.1 percentage points below the adjusted November reading of 69.1 percent.
PMI Manufacturing Index – Released 1/3/2022 – December PMI decreased 2.4% to 58.7% down from November’s reading of 61.1%. The New Orders Index was 60.4% down 1.1% from November’s reading of 61.5%. The Production Index registered 59.2%, down 2.3%.
U.S. Construction Spending – Released 1/3/2022 – Construction spending increased 0.4% in November measuring at a seasonally adjusted annual rate of $1,625.9 billion. The November figure is 9.3% above the November 2020 estimate. Private construction spending was 0.6% above the revised October estimate at $1,273.6 billion. Public construction spending was 0.2% below the revised October estimate at $352.3 billion.
Chicago PMI – Released 12/31/2021 – Chicago PMI increased to 63.1 points in December. Among the main five indicators, Production and New Orders and were higher. Order Backlogs, Employment and Supplier Deliveries fell across the month.
US Light Vehicle Sales – Released 12/23/2021 – U.S. light vehicle sales were at a seasonally adjusted annual rate (SAAR) of 12.857 million units in November.
Next week we get data on Chicago PMI, U.S. Construction Spending, Manufacturing PMI, Services PMI, JOLTS, the Employment Cost Index, and the January Jobs Report.
Data Sources:
Bureau of Economic Analysis (BEA)
Congressional Budget Office (CBO)
U.S. Bureau of Labor Statistics (BLS)
Federal Reserve Economic Data (FRED Charts)
CME Fed Watch
U.S. Treasury – Yields
U.S. Census Bureau
Institute for Supply Management (ISM)
Weekly DOL Employment Data
BLS Monthly Jobs Report
JOLTS
US Energy Admin (EIA)
BLS Consumer Price Index CPI
BLS Producer Price Index PPI
Atlanta Fed GDPNOW
NY Fed Nowcast GDP
US Census Bureau Housing Starts
Consumer Credit
USCB Retail Sales
Construction Spending
Federal Reserve Dot Plots
NY Empire Index
Philadelphia Federal Reserve
P/E Ratio Data -Yardeni Research
Technical Analysis Info:
StockCharts.com – Financial Charts
Exponential vs Simple moving average
Other Links:
1973 Arab Oil Embargo
Hunt Brothers Silver
Long-Term Capital bailout
Categories:
Tags: