The week started with oil futures jumping, 15%, the most ever overnight, as investors tried to understand the impact of a targeted attack on two Saudi refineries. Tuesday, overnight lending market rates (repo market) spiked, indicating lending stress. This caused the fed to inject $75 billion into the financial system, not once, not twice, but four days this week. On Wednesday, the Fed choose to cushion the economy against a global slowdown by cutting rates a quarter percent, making it two months in a row.
There was some slight movement on the trade front at the end of the week, as the Trump administration granted temporary tariff exemptions for some products imported from China. The decision was made after trade officials from the two countries conducted low-level talks ahead of the next round of negotiations planned for October, but the positive vibes were short-lived. Reuters reported on Friday afternoon that the Chinese trade delegation cancelled its plan for a visit to farms in Montana.
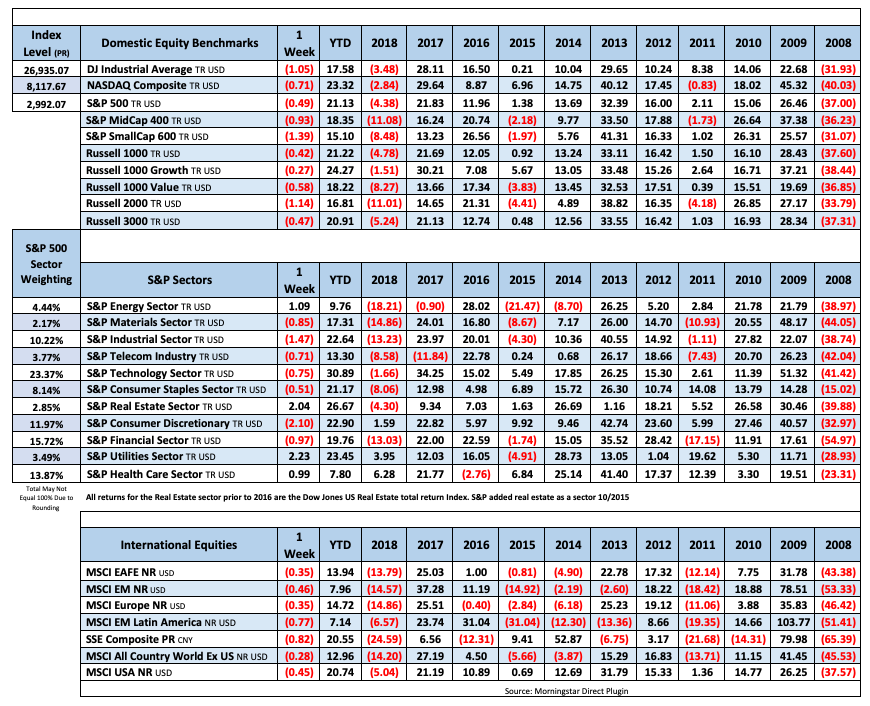
This was a week filled with seemingly extraordinary news but the equity markets were relatively stable. The Dow fell 1.05%, the Nasdaq lost 0.7% and the S&P500 was down 0.5% As we head into late September we find ourselves about two percent higher on the one year number and approximately 20% higher than two years ago.

Fixed Income
FOMC July Statement Federal Reserve Dot Plots Dec 18 US Debt Measurement– US Corporate Debt Tops $6 Trillion. Treasury.gov yields
FOMC Policy Normalization Statement
Global Bond Yields – The Fed cut rates by 25 bps last week.
Daily US Treasury Yields
Foreign Exchange Market
Energy Complex
The Baker Hughes rig count was lost 18 this week. There are 868 oil and gas rigs operating in the US – Down 185 over last year.
- Brent Crude Oil gained 4.95% this week closing at $63.20/bbl
- WTI Crude Oil gained 5.91% this week to close at $58.09/bbl
- Heating Oil gained 5.55% this week closing at $1.98/gallon
- Natural Gas lost 3.06% this week closing at $2.53 per million BTUs
- Unleaded Gas gained 6.05% this week closing at $1.65/gallon
Metals Complex
-
- Gold gained 1.04% this week closing at $1515.10/oz
- Silver gained 1.59% on the week closing at $17.85/oz
- Palladium gained 1.51% this week closing at $1625.00/oz
- Platinum lost 1.01% this week closing at $942.60/oz
- Copper lost 3.45% this week closing at $2.61/lb
Employment Picture
Weekly Unemployment Claims – Released Thursday 9/19/19– In the week ending September 14th, initial claims were 208,000, an increase of 2,000 from the previous week’s revised level. The 4-week moving average was 212,250, a decrease of 750 from the previous week’s revised average.
Job Openings & Labor Turnover Survey JOLTS – Released Tuesday 9/10 – The U.S. Bureau of Labor Statistics reported the number of job openings was little changed at 7.2 million on the last business day of July. Over the month, hires increased by 0.3 million to 6.0 million and separations increased by 0.3 million to 5.8 million. Within separations, the quits rate was little changed at 2.4%. The layoffs and discharges rates was little changed at 1.2%.
August Jobs Report – BLS Summary Released 9/6- The US Economy added 130k nonfarm jobs in August and the Unemployment remained constant at 3.7%. Average hourly earnings increased by 11 cents. Hiring highlights include Education and Health Services +32k, Professional and Business Services +37k, Government +34k, and -11k Retail Trade.
- Average hourly earnings increased by 11 cents/ 0.4% in August, y/y hourly earnings are up 3.2%.
- U3 unemployment remained unchanged at 3.7%. U6 unemployment rate increased 0.2% to 7.2%.
- The labor force participation rate increased in August at 63.2% (Unchanged year/y).
- Average work week increased by 0.1 hour to 34.4 hours.
Employment Cost Index – Released 7/31/19 – Compensation costs for civilian workers increased 0.6% for the 3-month period ending in June 2019. The 12 month period ending on June 2019 saw compensation costs increase by 2.7% versus 2.8% in June 2018. Wages and salaries were up 2.8% for the 12-month period ending June 2019, versus 2.8% for the 12-month period ending June 2018. Benefit costs increased 2.3% for the 12-month period ending June 2019. For private industry workers, compensation costs increased 2.6% year-over-year, versus 2.9% for the 12 months ending June 2018. This report is published quarterly.
This Week’s Economic Data
Links take you to the data source
Existing Home Sales Released 9/19 – Existing home sales increased in August. Sales gained 1.3% to a seasonally adjusted rate of 5.49 million. This marks two consecutive months of growth. Sales are currently up 2.6% from one year ago. Housing inventory declined to 4.1months of inventory and the total housing inventory decreased to 1.86 million. The median sales price for all types of homes was $278,200, up 4.7% year/y.
Housing Starts– Released 9/18 – New home starts in August were at a seasonally adjusted rate of 1.364 million; up 12.3% above July and 6.6% above last August’s rate. Building Permits were at a seasonally adjusted rate of 1.419 million, up 7.7% compared to July and up 12% over last year.
Industrial Production and Capacity Utilization Released 9/17 – Industrial production gained 0.6% in August. Manufacturing output increased 0.5% more than reversing its July decline. The index for utilities gained 0.6% and the index for mining gained 1.4%. Total capacity utilization increased 0.4% to 77.9% in August which is 1.9% below its long run average.
Recent Economic Data
Links take you to the data source
Retail Sales – Released 9/13 – U.S. retail sales for August were up 0.4% month/m increasing to $526.1 billion.
Consumer Price Index – Released 9/12 – The Consumer Price Index increased 0.1% in August. Core CPI, which excludes food and energy increased 0.3%. The monthly changes left total CPI up 1.7% year-over-year and core CPI up 2.4%.
Producer Price Index – Released 9/11 – The Producer Price Index for final demand increased 0.1% in August. Core PPI was flat. Year over year the index for final demand rose 1.9%.
Consumer Credit – Released 9/9 – Consumer credit increased at a seasonally adjusted annual rate of 6.75% in July. Revolving and nonrevolving credit increased at annual rates of 11.25% and 5.25% respectively. Total Outstanding consumer credit is currently at $4.123 trillion.
PMI Non-Manufacturing Index (ISM Services) – Released 9/5 – Economic activity in the non-manufacturing sector grew in August for the 115th consecutive month. ISM Non-Manufacturing registered 56.4 percent, which is 2.7 percentage points higher than the July reading of 53.7 percent. This represents continued growth in the non-manufacturing sector, at a slightly faster rate.
U.S. Trade Balance – Released 9/4 – The goods and services deficit has increased $28.2 billion or 8.2% year to date. Year to date exports and imports increased $3.4 billion or 0.2% and $24.9 billion or 1.4% respectively.
US Light Vehicle Sales – Released 9/4 – U.S. light vehicle sales were at a seasonally adjusted annual rate (SAAR) of 17.07 million units in August versus a SAAR of 16.82 million units in July.
PMI Manufacturing ISM Index – Released 9/3 – August PMI decreased 2.1% to 49.1% from July’s reading of 51.2%. The New Orders Index was down 3.6% from July’s reading of 50.8% to 47.2% for August. The Production Index registered 49.5% down 1.3%.
U.S. Construction Spending – Released 9/3 – Construction spending increased by 0.1% in July measuring at a seasonally adjusted annual rate of $1,288.8 billion. The July figure is 2.7% below the July 2018 estimate. Private construction spending was 0.1% below the revised June estimate at $963.7 billion. Public construction spending was 0.4% above the revised June estimate at $324.3 billion.
Chicago PMI – Released 8/30 – Chicago PMI gained 6 points in August rising to 50.4, up from 44.4 in July. This increase shows the index rising above contractionary territory where it was for the prior two months. Only two components declined this month as Supplier Deliveries sharply declined and inventories declined. The survey suggests a softer overall tone in business activity despite the overall gain
Personal Income – Released 8/30 – Personal Income increased 0.1% in July according to the BEA. The majority of the increase in July was due to increases in compensation of employees and government social benefits which were partially offset by a decline in personal interest income. Real PCE (the Feds preferred inflation gauge) increased 0.4% in July. Real disposable personal income increased 0.1% in July.
Advance Estimate of 2nd Quarter GDP – Released 8/29 – According to the second estimate released by the Bureau of Economic Analysis, Real Gross Domestic Product (Real GDP) increased at an annual rate of 2.0% in the second quarter of 2019. This is 0.1% less than the 2.1% given from the advance estimate. The second estimate is based on data that are more complete than that of the advance estimate issued last month. The second quarter increase in real GDP observed positive contributions from personal consumption expenditures (PCE), federal gov’t spending, and state and local gov’t spending that were partly offset by negative contributions from private inventory investment, exports, nonresidential fixed investment, and residential fixed investment. Imports also increased further offsetting gains to real GDP. A third estimate will be released on September 26, 2019.
Consumer Confidence – Released 8/27 – The Consumer confidence index declined slightly in August following a rebound in July. The Index now shows a reading of 135.1 down from 135.8 in July. Expectations overall still remain strong and consumers remain confident and willing to spend.
Durable Goods – Released 8/26 – New orders for manufactured durable goods increased $5.0 billion or 2.1% to $250.4 billion in July. The increase in July makes two consecutive months of increases. Transportation equipment increased 7.0%, driving the increase by $5.7 billion to $86.3 billion.
New Residential Sales – Released 8/23 – Sales of new single-family homes declined 12.8% to 635k, seasonally adjusted, in July. The median sales price of new homes sold in July was $312.8k with an average sales price of $388k. At the end of July the seasonally adjusted estimate of new homes for sale was 337k. This represents a supply of 6.4 months at the current sales rate.
Next week we get data on New Residential Sales, Durable Goods, Consumer Confidence, Personal Income, and the Third Estimate of 2nd Quarter GDP.
Data Sources:
Bureau of Economic Analysis (BEA)
Congressional Budget Office (CBO)
U.S. Bureau of Labor Statistics (BLS)
Federal Reserve Economic Data (FRED Charts)
CME Fed Watch
U.S. Treasury – Yields
U.S. Census Bureau
Institute for Supply Management (ISM)
Weekly DOL Employment Data
BLS Monthly Jobs Report
JOLTS
US Energy Admin (EIA)
BLS Consumer Price Index CPI
BLS Producer Price Index PPI
Atlanta Fed GDPNOW
NY Fed Nowcast GDP
US Census Bureau Housing Starts
Consumer Credit
USCB Retail Sales
Construction Spending
Federal Reserve Dot Plots
NY Empire Index
Philadelphia Federal Reserve
P/E Ratio Data -Yardeni Research
Technical Analysis Info:
StockCharts.com – Financial Charts
Exponential vs Simple moving average
Other Links:
1973 Arab Oil Embargo
Hunt Brothers Silver
Long-Term Capital bailout


Week 38 Talking Points
The week started with oil futures jumping, 15%, the most ever overnight, as investors tried to understand the impact of a targeted attack on two Saudi refineries. Tuesday, overnight lending market rates (repo market) spiked, indicating lending stress. This caused the fed to inject $75 billion into the financial system, not once, not twice, but four days this week. On Wednesday, the Fed choose to cushion the economy against a global slowdown by cutting rates a quarter percent, making it two months in a row.
There was some slight movement on the trade front at the end of the week, as the Trump administration granted temporary tariff exemptions for some products imported from China. The decision was made after trade officials from the two countries conducted low-level talks ahead of the next round of negotiations planned for October, but the positive vibes were short-lived. Reuters reported on Friday afternoon that the Chinese trade delegation cancelled its plan for a visit to farms in Montana.
This was a week filled with seemingly extraordinary news but the equity markets were relatively stable. The Dow fell 1.05%, the Nasdaq lost 0.7% and the S&P500 was down 0.5% As we head into late September we find ourselves about two percent higher on the one year number and approximately 20% higher than two years ago.
Table of Contents
Fixed Income
FOMC July Statement Federal Reserve Dot Plots Dec 18 US Debt Measurement– US Corporate Debt Tops $6 Trillion. Treasury.gov yields
FOMC Policy Normalization Statement
Global Bond Yields – The Fed cut rates by 25 bps last week.
Daily US Treasury Yields
Foreign Exchange Market
Energy Complex
The Baker Hughes rig count was lost 18 this week. There are 868 oil and gas rigs operating in the US – Down 185 over last year.
Metals Complex
Employment Picture
Weekly Unemployment Claims – Released Thursday 9/19/19– In the week ending September 14th, initial claims were 208,000, an increase of 2,000 from the previous week’s revised level. The 4-week moving average was 212,250, a decrease of 750 from the previous week’s revised average.
Job Openings & Labor Turnover Survey JOLTS – Released Tuesday 9/10 – The U.S. Bureau of Labor Statistics reported the number of job openings was little changed at 7.2 million on the last business day of July. Over the month, hires increased by 0.3 million to 6.0 million and separations increased by 0.3 million to 5.8 million. Within separations, the quits rate was little changed at 2.4%. The layoffs and discharges rates was little changed at 1.2%.
August Jobs Report – BLS Summary Released 9/6- The US Economy added 130k nonfarm jobs in August and the Unemployment remained constant at 3.7%. Average hourly earnings increased by 11 cents. Hiring highlights include Education and Health Services +32k, Professional and Business Services +37k, Government +34k, and -11k Retail Trade.
Employment Cost Index – Released 7/31/19 – Compensation costs for civilian workers increased 0.6% for the 3-month period ending in June 2019. The 12 month period ending on June 2019 saw compensation costs increase by 2.7% versus 2.8% in June 2018. Wages and salaries were up 2.8% for the 12-month period ending June 2019, versus 2.8% for the 12-month period ending June 2018. Benefit costs increased 2.3% for the 12-month period ending June 2019. For private industry workers, compensation costs increased 2.6% year-over-year, versus 2.9% for the 12 months ending June 2018. This report is published quarterly.
This Week’s Economic Data
Links take you to the data source
Existing Home Sales Released 9/19 – Existing home sales increased in August. Sales gained 1.3% to a seasonally adjusted rate of 5.49 million. This marks two consecutive months of growth. Sales are currently up 2.6% from one year ago. Housing inventory declined to 4.1months of inventory and the total housing inventory decreased to 1.86 million. The median sales price for all types of homes was $278,200, up 4.7% year/y.
Housing Starts– Released 9/18 – New home starts in August were at a seasonally adjusted rate of 1.364 million; up 12.3% above July and 6.6% above last August’s rate. Building Permits were at a seasonally adjusted rate of 1.419 million, up 7.7% compared to July and up 12% over last year.
Industrial Production and Capacity Utilization Released 9/17 – Industrial production gained 0.6% in August. Manufacturing output increased 0.5% more than reversing its July decline. The index for utilities gained 0.6% and the index for mining gained 1.4%. Total capacity utilization increased 0.4% to 77.9% in August which is 1.9% below its long run average.
Recent Economic Data
Links take you to the data source
Retail Sales – Released 9/13 – U.S. retail sales for August were up 0.4% month/m increasing to $526.1 billion.
Consumer Price Index – Released 9/12 – The Consumer Price Index increased 0.1% in August. Core CPI, which excludes food and energy increased 0.3%. The monthly changes left total CPI up 1.7% year-over-year and core CPI up 2.4%.
Producer Price Index – Released 9/11 – The Producer Price Index for final demand increased 0.1% in August. Core PPI was flat. Year over year the index for final demand rose 1.9%.
Consumer Credit – Released 9/9 – Consumer credit increased at a seasonally adjusted annual rate of 6.75% in July. Revolving and nonrevolving credit increased at annual rates of 11.25% and 5.25% respectively. Total Outstanding consumer credit is currently at $4.123 trillion.
PMI Non-Manufacturing Index (ISM Services) – Released 9/5 – Economic activity in the non-manufacturing sector grew in August for the 115th consecutive month. ISM Non-Manufacturing registered 56.4 percent, which is 2.7 percentage points higher than the July reading of 53.7 percent. This represents continued growth in the non-manufacturing sector, at a slightly faster rate.
U.S. Trade Balance – Released 9/4 – The goods and services deficit has increased $28.2 billion or 8.2% year to date. Year to date exports and imports increased $3.4 billion or 0.2% and $24.9 billion or 1.4% respectively.
US Light Vehicle Sales – Released 9/4 – U.S. light vehicle sales were at a seasonally adjusted annual rate (SAAR) of 17.07 million units in August versus a SAAR of 16.82 million units in July.
PMI Manufacturing ISM Index – Released 9/3 – August PMI decreased 2.1% to 49.1% from July’s reading of 51.2%. The New Orders Index was down 3.6% from July’s reading of 50.8% to 47.2% for August. The Production Index registered 49.5% down 1.3%.
U.S. Construction Spending – Released 9/3 – Construction spending increased by 0.1% in July measuring at a seasonally adjusted annual rate of $1,288.8 billion. The July figure is 2.7% below the July 2018 estimate. Private construction spending was 0.1% below the revised June estimate at $963.7 billion. Public construction spending was 0.4% above the revised June estimate at $324.3 billion.
Chicago PMI – Released 8/30 – Chicago PMI gained 6 points in August rising to 50.4, up from 44.4 in July. This increase shows the index rising above contractionary territory where it was for the prior two months. Only two components declined this month as Supplier Deliveries sharply declined and inventories declined. The survey suggests a softer overall tone in business activity despite the overall gain
Personal Income – Released 8/30 – Personal Income increased 0.1% in July according to the BEA. The majority of the increase in July was due to increases in compensation of employees and government social benefits which were partially offset by a decline in personal interest income. Real PCE (the Feds preferred inflation gauge) increased 0.4% in July. Real disposable personal income increased 0.1% in July.
Advance Estimate of 2nd Quarter GDP – Released 8/29 – According to the second estimate released by the Bureau of Economic Analysis, Real Gross Domestic Product (Real GDP) increased at an annual rate of 2.0% in the second quarter of 2019. This is 0.1% less than the 2.1% given from the advance estimate. The second estimate is based on data that are more complete than that of the advance estimate issued last month. The second quarter increase in real GDP observed positive contributions from personal consumption expenditures (PCE), federal gov’t spending, and state and local gov’t spending that were partly offset by negative contributions from private inventory investment, exports, nonresidential fixed investment, and residential fixed investment. Imports also increased further offsetting gains to real GDP. A third estimate will be released on September 26, 2019.
Consumer Confidence – Released 8/27 – The Consumer confidence index declined slightly in August following a rebound in July. The Index now shows a reading of 135.1 down from 135.8 in July. Expectations overall still remain strong and consumers remain confident and willing to spend.
Durable Goods – Released 8/26 – New orders for manufactured durable goods increased $5.0 billion or 2.1% to $250.4 billion in July. The increase in July makes two consecutive months of increases. Transportation equipment increased 7.0%, driving the increase by $5.7 billion to $86.3 billion.
New Residential Sales – Released 8/23 – Sales of new single-family homes declined 12.8% to 635k, seasonally adjusted, in July. The median sales price of new homes sold in July was $312.8k with an average sales price of $388k. At the end of July the seasonally adjusted estimate of new homes for sale was 337k. This represents a supply of 6.4 months at the current sales rate.
Next week we get data on New Residential Sales, Durable Goods, Consumer Confidence, Personal Income, and the Third Estimate of 2nd Quarter GDP.
Data Sources:
Bureau of Economic Analysis (BEA)
Congressional Budget Office (CBO)
U.S. Bureau of Labor Statistics (BLS)
Federal Reserve Economic Data (FRED Charts)
CME Fed Watch
U.S. Treasury – Yields
U.S. Census Bureau
Institute for Supply Management (ISM)
Weekly DOL Employment Data
BLS Monthly Jobs Report
JOLTS
US Energy Admin (EIA)
BLS Consumer Price Index CPI
BLS Producer Price Index PPI
Atlanta Fed GDPNOW
NY Fed Nowcast GDP
US Census Bureau Housing Starts
Consumer Credit
USCB Retail Sales
Construction Spending
Federal Reserve Dot Plots
NY Empire Index
Philadelphia Federal Reserve
P/E Ratio Data -Yardeni Research
Technical Analysis Info:
StockCharts.com – Financial Charts
Exponential vs Simple moving average
Other Links:
1973 Arab Oil Embargo
Hunt Brothers Silver
Long-Term Capital bailout
Categories:
Tags: