A slide in Treasury Yields deepens worries about growth and low inflation.
A wild week in the markets, concerns over growth, trade, and yields played out. Despite the markets having the worst day of 2019 on Monday, each of the major indices losing around 3%, the S&P 500 only finished the week down 0.5%, the Dow lost 0.8%, the Nasdaq lost 0.6%, and the R2K lost 1.3%. The selling Monday came as China allowed the yen to fall below 7 per U.S. dollar in response to President Trump’s tariff threat. Additionally, China’s instructed its state-sponsored companies to suspend new agricultural purchases from the U.S. Adding to the sour mood was the U.S. labeling China a currency manipulator for the first time since 1994. The 2-10 spread, which is widely viewed as a possible indicator for a recession, narrowed to its lowest point since 2007.
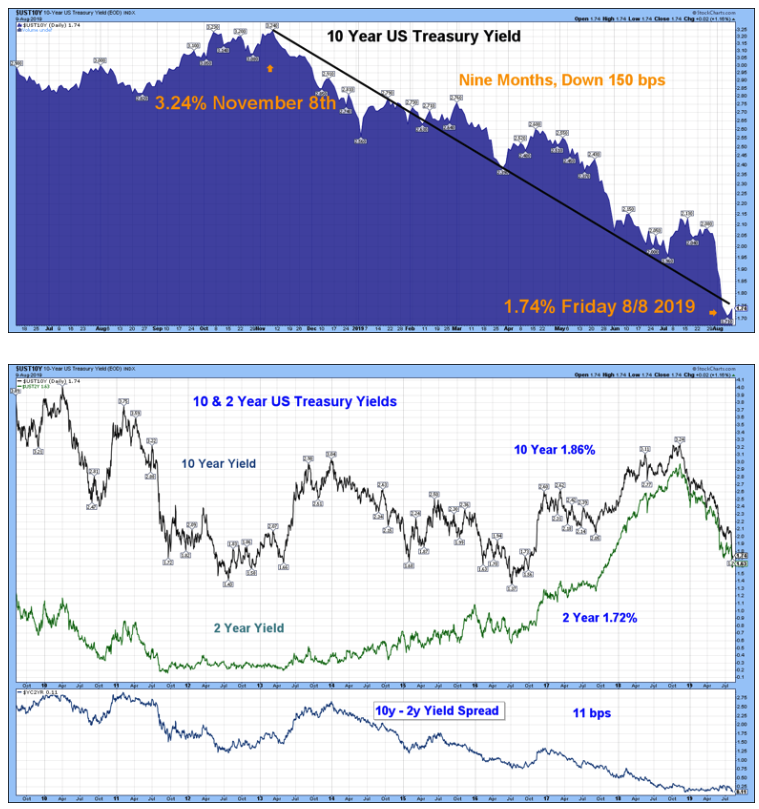

Fixed Income – Yields Dropped
FOMC March Statement Federal Reserve Dot Plots Dec 18 US Debt Measurement June Meeting Minutes US Corporate Debt Tops $6 Trillion Treasury.gov yields FOMC Policy Normalization Statement
Global Bond Yields
Daily US Treasury Yields
Foreign Exchange Market
Energy Complex
The Baker Hughes rig count lost 8 this week. There are 934 oil and gas rigs operating in the US – down 123 over last year.
- Brent Crude Oil lost 5.43% this week closing at $58.53/bbl
- WTI Crude Oil lost 2.08% this week to close at $54.50/bbl
- Heating Oil lost 4.35% this week closing at $1.81/gallon
- Natural Gas lost 0.09% this week closing at $2.12 per million BTUs
- Unleaded Gas lost 6.03% this week closing at $1.67/gallon
Metals Complex
Gold is climbing, currently at $1508.50/oz
- Gold lost 0.07% this week closing at $1508.50/oz
- Silver gained 4.06% on the week closing at $16.93/oz
- Palladium gained 0.41% this week closing at $1412.70/oz
- Platinum gained 1.27% this week closing at $863.80/oz
- Copper gained 0.68% this week closing at $2.59/lb
Employment Picture
Weekly Unemployment Claims – Released Thursday 8/8 – In the week ending August 9th, initial claims were 209,000, a decrease of 8,000 from the previous week’s revised level. The 4-week moving average was 212,250, an increase of 250 from the previous week’s revised average.
Job Openings & Labor Turnover Survey JOLTS – Released Tuesday 8/6 – The U.S. Bureau of Labor Statistics reported the number of job openings was little changed at 7.3 million on the last business day of June. Over the month, hires were little changed at 5.7 million and separations were little changed at 5.5 million. Within separations, the quits rate remained unchanged at 2.3%. The layoffs and discharges rates were little changed at 1.1%.
July Jobs Report – BLS Summary – Released 8/2 – The US Economy added 164k nonfarm jobs in July and the Unemployment remained constant at 3.7%. Average hourly earnings increased by 8 cents. Hiring highlights include Education and Health Services +66k, Professional and Business Services +38k, Financial Activities +18k.
- Average hourly earnings increased by 8 cents/ 0.23% in July, y/y hourly earnings are up 3.2%.
- U3 unemployment remained unchanged at 3.7%. U6 unemployment rate declined 0.2% to 7.0%.
- The labor force participation rate was little changed in July at 63.0% (Unchanged year/y).
- Average workweek declined by 0.1 hours to 34.3 hours.
Employment Cost Index – Released 7/31/19 – Compensation costs for civilian workers increased 0.6% for the 3-month period ending in June 2019. The 12 month period ending in June 2019 saw compensation costs increase by 2.7% versus 2.8% in June 2018. Wages and salaries were up 2.8% for the 12-month period ending June 2019, versus 2.8% for the 12-month period ending June 2018. Benefit costs increased 2.3% for the 12-month period ending June 2019. For private industry workers, compensation costs increased 2.6% year-over-year, versus 2.9% for the 12 months ending June 2018. Wages and salaries increased 3.0% year-over-year, versus 2.9% for the 12 months ending June 2018. Benefit costs increased 1.8%, versus 2.8% for the 12 months ending June 2018. This report is published quarterly.
This Week’s Economic Data
Links take you to the data source
Producer Price Index – Released 8/9 – The Producer Price Index for final demand increased 0.2% in July. Core PPI was up 0.1%. Year over year the index for final demand rose 1.7%.
Consumer Credit – Released 8/7 – Consumer credit increased at a seasonally adjusted annual rate of 5.00% in the second quarter. Revolving and nonrevolving credit increased at annual rates of 5.25% and 4.75% respectively. Total Outstanding consumer credit is currently at $4.102 trillion.
PMI Non-Manufacturing Index (ISM Services) – Released 8/5 – Economic activity in the non-manufacturing sector grew in July for the 114th consecutive month. ISM Non-Manufacturing registered 53.7 percent, which is 1.4 percentage points lower than the June reading of 55.1 percent. This represents continued growth in the non-manufacturing sector, at a slightly slower rate.
Recent Economic Data
Links take you to the data source
U.S. Trade Balance – Released 8/2 – The U.S. Trade deficit was $55.2 billion in June, down $0.2 billion from $55.3 billion in June. June exports were $206.3 billion, $4.4 billion less than May exports. June imports were $261.5 billion, $4.6 billion less than May imports. The goods and services deficit has increased $23.2 billion or 7.9% year to date. Year to date exports and imports increased $0.5 billion or 0.1% and $23.8 billion or 1.5% respectively.
PMI Manufacturing ISM Index – Released 8/1 – July PMI decreased 0.5% to 51.2% from June’s reading of 52.7%. The New Orders Index was up 0.8% from June’s reading of 50.0% to 50.8% for June. The Production Index registered 50.8% down 3.3%.
U.S. Construction Spending – Released 8/1 – Construction spending declined by 1.3% in June measuring at a seasonally adjusted annual rate of $1,287.0 billion. The June figure is 2.1% below the June 2018 estimate. Private construction spending was 0.4% below the revised May estimate at $962.9 billion. Public construction spending was 3.7% below the revised May estimate at $324.1 billion.
Chicago PMI – Released 7/31 – Chicago PMI decreased 5.3 points in July falling to 44.4, down from 49.7 in June. This decline shows the index entering contraction territory. Four of five components were in contraction territory this month. This decline brings with it reductions in business confidence, weak demand, and slowed production levels. Also order backlogs are now in contraction for three consecutive months. Global risks, trade tensions, slowdown in demand and slower growth expectations, all jeopardize business conditions.
Personal Income – Released 7/30 – Personal Income increased 0.4% in June according to the BEA. The majority of the increase in June was due to increases in wages and salaries, supplements to wages and salaries, and government social benefits to persons. Real PCE (the Feds preferred inflation gauge) increased 0.2% in June. Real disposable personal income increased 0.3% in June.
Consumer Confidence – Released 7/30 – The Consumer confidence index rebounded in July following a decrease in June. The Index now shows a reading of 135.7 up from 124.3 in June. Following a sharp decline in June, the index has rebounded to its highest level this year with consumers once again optimistic about current and prospective business and labor market conditions.
Advance Estimate of 2nd Quarter GDP – Released 7/26 – According to the advance estimate released by the Bureau of Economic Analysis, Real Gross Domestic Product (Real GDP) increased at an annual rate of 2.1% in the second quarter of 2019. The advance estimate is based on data that are either incomplete or subject to more review. The second-quarter increase in real GDP observed positive contributions from personal consumption expenditures (PCE), federal gov’t spending, and state and local gov’t spending that were partly offset by negative contributions from private inventory investment, exports, nonresidential fixed investment, and residential fixed investment. Imports also increased further offsetting gains to real GDP. A second estimate will be released on August 29, 2019.
Durable Goods – Released 7/25 – New orders for manufactured durable goods increased $4.9 billion or 2.0% to $246.0 billion in June. The increase in June follows two consecutive months of decline. Transportation equipment increased 3.1%%, driving the increase by $2.6 billion to $88.8 billion.
New Residential Sales – Released 7/24 – Sales of new single-family homes increased 7.0% to 646k, seasonally adjusted, in June. The median sales price of new homes sold in June was $308k with an average sales price of $310.4k. At the end of June, the seasonally adjusted estimate of new homes for sale was 338k. This represents a supply of 6.3 months at the current sales rate.
Existing Home Sales – Released 7/23 – Existing home sales declined slightly in June. Sales declined 1.7% to a seasonally adjusted rate of 5.27 million. Three of the last four months have seen declines. Sales are currently down 2.2% from one year ago. Housing inventory increased to 4.4 months of inventory and the total housing inventory increased to 1.93 million. The median sales price for all types of homes was $285,700, up 4.3% year/y.
Housing Starts – Released 7/17 – New home starts in June were at a seasonally adjusted rate of 1.253 million; down 0.9% below May and 6.2% above last June’s rate. Building Permits were at a seasonally adjusted rate of 1.220 million, down 6.1% compared to May and down 6.6% over last year.
Industrial Production and Capacity Utilization – Released 7/16 – Industrial production was unchanged in June. For the last two consecutive quarters industrial production has declined at an annual rate of 1.2% . Total capacity utilization decreased 0.2% to 77.9% in June from an unrevised 78.1% in May.
Retail Sales – Released 7/16 – U.S. retail sales for were up 0.4% month/m to 519.9 billion in June.
Consumer Price Index – Released 7/11 – The Consumer Price Index increased 0.1% in June. Core CPI, which excludes food and energy increased 0.3%. The monthly changes left total CPI up 1.6% year-over-year and core CPI up 2.1%.
US Light Vehicle Sales – Released 6/7 – U.S. light vehicle sales were at a seasonally adjusted annual rate (SAAR) of 17.9 million units in May versus a SAAR of 16.9 million units in April.
Next week we get data on the Consumer Price Index, Retail Sales, Industrial Production and Capacity Utilization, and Housing Starts.
Data Sources:
Bureau of Economic Analysis (BEA)
Congressional Budget Office (CBO)
U.S. Bureau of Labor Statistics (BLS)
Federal Reserve Economic Data (FRED Charts)
CME Fed Watch
U.S. Treasury – Yields
U.S. Census Bureau
Institute for Supply Management (ISM)
Weekly DOL Employment Data
BLS Monthly Jobs Report
JOLTS
US Energy Admin (EIA)
BLS Consumer Price Index CPI
BLS Producer Price Index PPI
Atlanta Fed GDPNOW
NY Fed Nowcast GDP
US Census Bureau Housing Starts
Consumer Credit
USCB Retail Sales
Construction Spending
Federal Reserve Dot Plots
NY Empire Index
Philadelphia Federal Reserve
P/E Ratio Data -Yardeni Research
Technical Analysis Info:
StockCharts.com – Financial Charts
Exponential vs Simple moving average
Other Links:
1973 Arab Oil Embargo
Hunt Brothers Silver
Long-Term Capital bailout


Week 31 Talking Points #24
A slide in Treasury Yields deepens worries about growth and low inflation.
A wild week in the markets, concerns over growth, trade, and yields played out. Despite the markets having the worst day of 2019 on Monday, each of the major indices losing around 3%, the S&P 500 only finished the week down 0.5%, the Dow lost 0.8%, the Nasdaq lost 0.6%, and the R2K lost 1.3%. The selling Monday came as China allowed the yen to fall below 7 per U.S. dollar in response to President Trump’s tariff threat. Additionally, China’s instructed its state-sponsored companies to suspend new agricultural purchases from the U.S. Adding to the sour mood was the U.S. labeling China a currency manipulator for the first time since 1994. The 2-10 spread, which is widely viewed as a possible indicator for a recession, narrowed to its lowest point since 2007.
Table of Contents
Fixed Income – Yields Dropped
FOMC March Statement Federal Reserve Dot Plots Dec 18 US Debt Measurement June Meeting Minutes US Corporate Debt Tops $6 Trillion Treasury.gov yields FOMC Policy Normalization Statement
Global Bond Yields
Daily US Treasury Yields
Foreign Exchange Market
Energy Complex
The Baker Hughes rig count lost 8 this week. There are 934 oil and gas rigs operating in the US – down 123 over last year.
Metals Complex
Gold is climbing, currently at $1508.50/oz
Employment Picture
Weekly Unemployment Claims – Released Thursday 8/8 – In the week ending August 9th, initial claims were 209,000, a decrease of 8,000 from the previous week’s revised level. The 4-week moving average was 212,250, an increase of 250 from the previous week’s revised average.
Job Openings & Labor Turnover Survey JOLTS – Released Tuesday 8/6 – The U.S. Bureau of Labor Statistics reported the number of job openings was little changed at 7.3 million on the last business day of June. Over the month, hires were little changed at 5.7 million and separations were little changed at 5.5 million. Within separations, the quits rate remained unchanged at 2.3%. The layoffs and discharges rates were little changed at 1.1%.
July Jobs Report – BLS Summary – Released 8/2 – The US Economy added 164k nonfarm jobs in July and the Unemployment remained constant at 3.7%. Average hourly earnings increased by 8 cents. Hiring highlights include Education and Health Services +66k, Professional and Business Services +38k, Financial Activities +18k.
Employment Cost Index – Released 7/31/19 – Compensation costs for civilian workers increased 0.6% for the 3-month period ending in June 2019. The 12 month period ending in June 2019 saw compensation costs increase by 2.7% versus 2.8% in June 2018. Wages and salaries were up 2.8% for the 12-month period ending June 2019, versus 2.8% for the 12-month period ending June 2018. Benefit costs increased 2.3% for the 12-month period ending June 2019. For private industry workers, compensation costs increased 2.6% year-over-year, versus 2.9% for the 12 months ending June 2018. Wages and salaries increased 3.0% year-over-year, versus 2.9% for the 12 months ending June 2018. Benefit costs increased 1.8%, versus 2.8% for the 12 months ending June 2018. This report is published quarterly.
This Week’s Economic Data
Links take you to the data source
Producer Price Index – Released 8/9 – The Producer Price Index for final demand increased 0.2% in July. Core PPI was up 0.1%. Year over year the index for final demand rose 1.7%.
Consumer Credit – Released 8/7 – Consumer credit increased at a seasonally adjusted annual rate of 5.00% in the second quarter. Revolving and nonrevolving credit increased at annual rates of 5.25% and 4.75% respectively. Total Outstanding consumer credit is currently at $4.102 trillion.
PMI Non-Manufacturing Index (ISM Services) – Released 8/5 – Economic activity in the non-manufacturing sector grew in July for the 114th consecutive month. ISM Non-Manufacturing registered 53.7 percent, which is 1.4 percentage points lower than the June reading of 55.1 percent. This represents continued growth in the non-manufacturing sector, at a slightly slower rate.
Recent Economic Data
Links take you to the data source
U.S. Trade Balance – Released 8/2 – The U.S. Trade deficit was $55.2 billion in June, down $0.2 billion from $55.3 billion in June. June exports were $206.3 billion, $4.4 billion less than May exports. June imports were $261.5 billion, $4.6 billion less than May imports. The goods and services deficit has increased $23.2 billion or 7.9% year to date. Year to date exports and imports increased $0.5 billion or 0.1% and $23.8 billion or 1.5% respectively.
PMI Manufacturing ISM Index – Released 8/1 – July PMI decreased 0.5% to 51.2% from June’s reading of 52.7%. The New Orders Index was up 0.8% from June’s reading of 50.0% to 50.8% for June. The Production Index registered 50.8% down 3.3%.
U.S. Construction Spending – Released 8/1 – Construction spending declined by 1.3% in June measuring at a seasonally adjusted annual rate of $1,287.0 billion. The June figure is 2.1% below the June 2018 estimate. Private construction spending was 0.4% below the revised May estimate at $962.9 billion. Public construction spending was 3.7% below the revised May estimate at $324.1 billion.
Chicago PMI – Released 7/31 – Chicago PMI decreased 5.3 points in July falling to 44.4, down from 49.7 in June. This decline shows the index entering contraction territory. Four of five components were in contraction territory this month. This decline brings with it reductions in business confidence, weak demand, and slowed production levels. Also order backlogs are now in contraction for three consecutive months. Global risks, trade tensions, slowdown in demand and slower growth expectations, all jeopardize business conditions.
Personal Income – Released 7/30 – Personal Income increased 0.4% in June according to the BEA. The majority of the increase in June was due to increases in wages and salaries, supplements to wages and salaries, and government social benefits to persons. Real PCE (the Feds preferred inflation gauge) increased 0.2% in June. Real disposable personal income increased 0.3% in June.
Consumer Confidence – Released 7/30 – The Consumer confidence index rebounded in July following a decrease in June. The Index now shows a reading of 135.7 up from 124.3 in June. Following a sharp decline in June, the index has rebounded to its highest level this year with consumers once again optimistic about current and prospective business and labor market conditions.
Advance Estimate of 2nd Quarter GDP – Released 7/26 – According to the advance estimate released by the Bureau of Economic Analysis, Real Gross Domestic Product (Real GDP) increased at an annual rate of 2.1% in the second quarter of 2019. The advance estimate is based on data that are either incomplete or subject to more review. The second-quarter increase in real GDP observed positive contributions from personal consumption expenditures (PCE), federal gov’t spending, and state and local gov’t spending that were partly offset by negative contributions from private inventory investment, exports, nonresidential fixed investment, and residential fixed investment. Imports also increased further offsetting gains to real GDP. A second estimate will be released on August 29, 2019.
Durable Goods – Released 7/25 – New orders for manufactured durable goods increased $4.9 billion or 2.0% to $246.0 billion in June. The increase in June follows two consecutive months of decline. Transportation equipment increased 3.1%%, driving the increase by $2.6 billion to $88.8 billion.
New Residential Sales – Released 7/24 – Sales of new single-family homes increased 7.0% to 646k, seasonally adjusted, in June. The median sales price of new homes sold in June was $308k with an average sales price of $310.4k. At the end of June, the seasonally adjusted estimate of new homes for sale was 338k. This represents a supply of 6.3 months at the current sales rate.
Existing Home Sales – Released 7/23 – Existing home sales declined slightly in June. Sales declined 1.7% to a seasonally adjusted rate of 5.27 million. Three of the last four months have seen declines. Sales are currently down 2.2% from one year ago. Housing inventory increased to 4.4 months of inventory and the total housing inventory increased to 1.93 million. The median sales price for all types of homes was $285,700, up 4.3% year/y.
Housing Starts – Released 7/17 – New home starts in June were at a seasonally adjusted rate of 1.253 million; down 0.9% below May and 6.2% above last June’s rate. Building Permits were at a seasonally adjusted rate of 1.220 million, down 6.1% compared to May and down 6.6% over last year.
Industrial Production and Capacity Utilization – Released 7/16 – Industrial production was unchanged in June. For the last two consecutive quarters industrial production has declined at an annual rate of 1.2% . Total capacity utilization decreased 0.2% to 77.9% in June from an unrevised 78.1% in May.
Retail Sales – Released 7/16 – U.S. retail sales for were up 0.4% month/m to 519.9 billion in June.
Consumer Price Index – Released 7/11 – The Consumer Price Index increased 0.1% in June. Core CPI, which excludes food and energy increased 0.3%. The monthly changes left total CPI up 1.6% year-over-year and core CPI up 2.1%.
US Light Vehicle Sales – Released 6/7 – U.S. light vehicle sales were at a seasonally adjusted annual rate (SAAR) of 17.9 million units in May versus a SAAR of 16.9 million units in April.
Next week we get data on the Consumer Price Index, Retail Sales, Industrial Production and Capacity Utilization, and Housing Starts.
Data Sources:
Bureau of Economic Analysis (BEA)
Congressional Budget Office (CBO)
U.S. Bureau of Labor Statistics (BLS)
Federal Reserve Economic Data (FRED Charts)
CME Fed Watch
U.S. Treasury – Yields
U.S. Census Bureau
Institute for Supply Management (ISM)
Weekly DOL Employment Data
BLS Monthly Jobs Report
JOLTS
US Energy Admin (EIA)
BLS Consumer Price Index CPI
BLS Producer Price Index PPI
Atlanta Fed GDPNOW
NY Fed Nowcast GDP
US Census Bureau Housing Starts
Consumer Credit
USCB Retail Sales
Construction Spending
Federal Reserve Dot Plots
NY Empire Index
Philadelphia Federal Reserve
P/E Ratio Data -Yardeni Research
Technical Analysis Info:
StockCharts.com – Financial Charts
Exponential vs Simple moving average
Other Links:
1973 Arab Oil Embargo
Hunt Brothers Silver
Long-Term Capital bailout
Categories:
Tags: