Good Life Advisors – Talking Points – Week 24
The week’s big event was the June FOMC meeting, where the Fed decided to hold rates steady for the first time after a 10-meeting hiking campaign that brought 500bp of tightening. At the same time, the statement and press conference hinted at the possibility of more hikes ahead, should these be necessary. While the 50bp rise in the median 2023 forecast on the dot plot in June’s updated Summary of Economic Projections was more hawkish than expected, the meeting was largely consistent with the incoming consensus for the Fed to “skip” and give more time for the economic backdrop to evolve. Market pricing now reflects expectations for a 25bp hike in July, then a pause through the end of the year, and a first-rate cut at the FOMC’s January 2024 meeting. FedWatch Tool
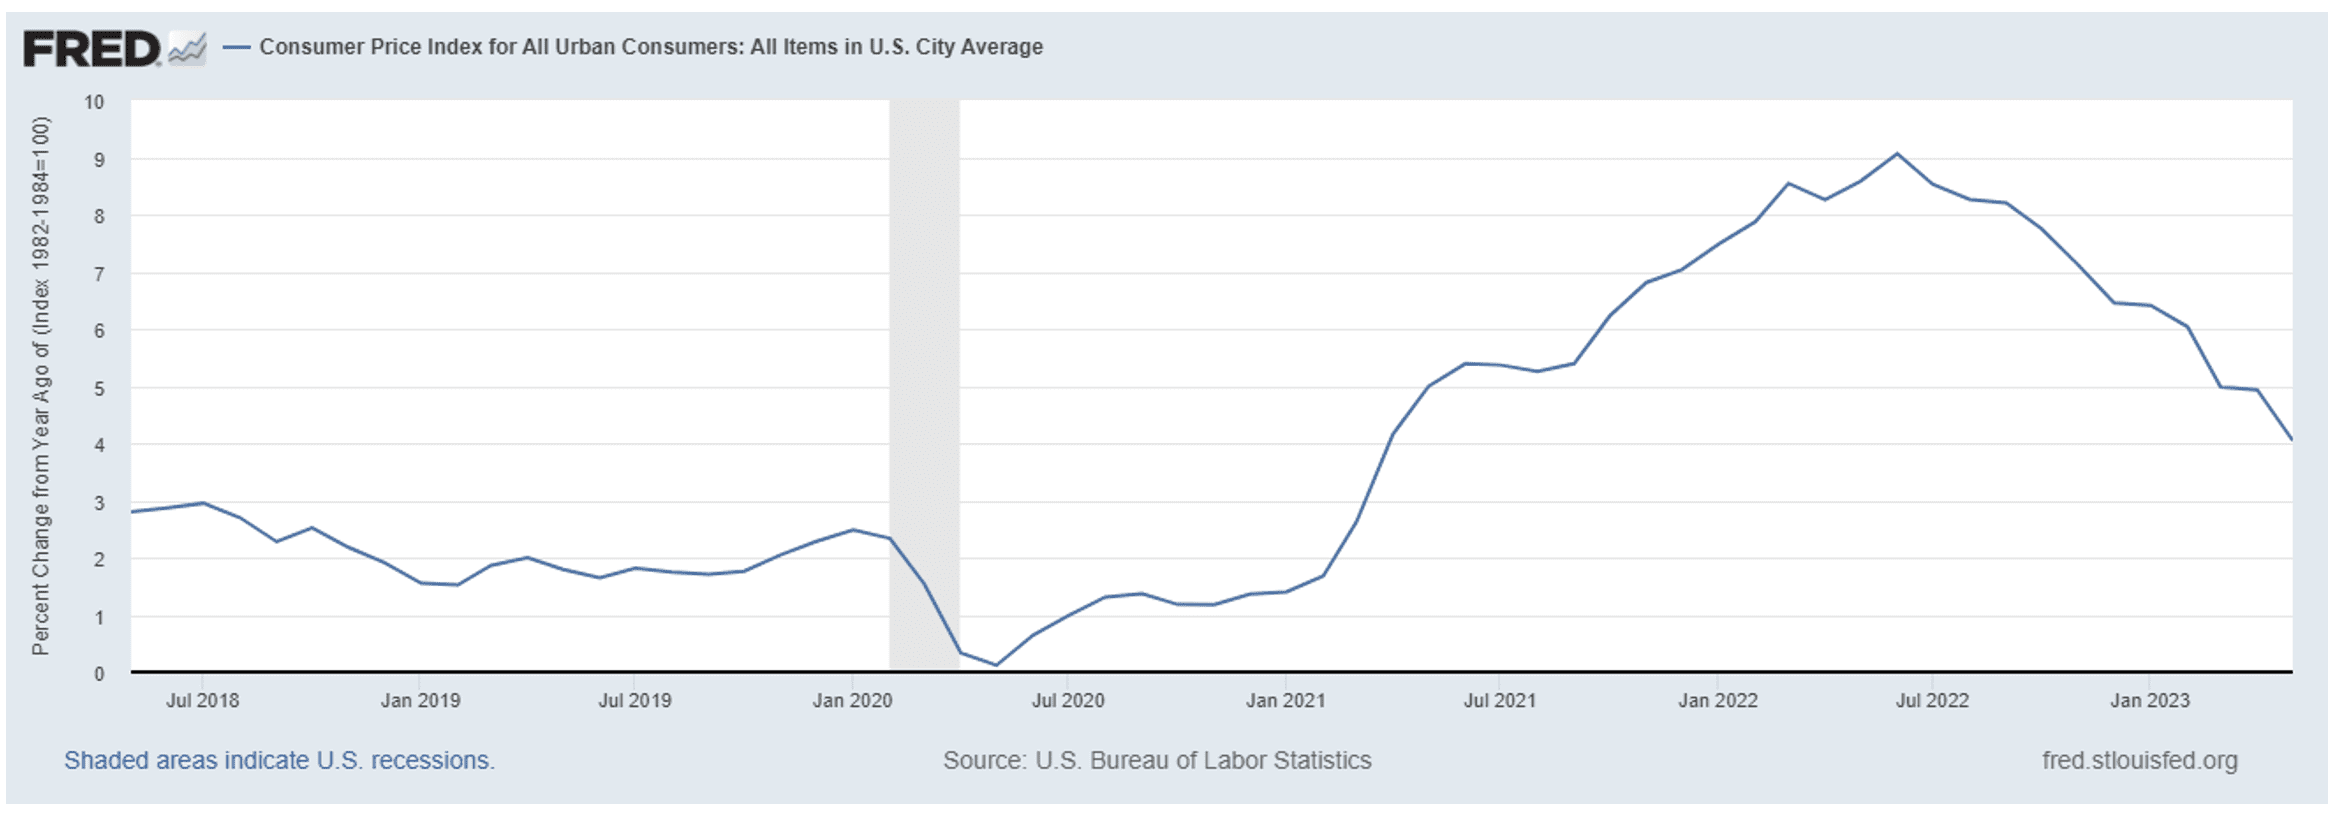
It was also a week thick with economic updates, bringing some support for the disinflation narrative. The May CPI report (which was released the day before the Fed decision) showed a cooler-than-expected headline increase, with the y/y change dropping to just 4.0% (the lowest since March 2021). While some core elements remained elevated (particularly used cars and shelter), analyst takes were relatively optimistic. May PPI also posted a larger-than-expected monthly decline on lower energy prices, with the core largely in line. Disinflation was also reflected in the prices paid/received data from the June NY and Philadelphia Fed manufacturing reports. There was also a big decline in year-ahead inflation expectations in the UMich consumer sentiment report. May’s retail sales report was more mixed, with a consensus-beating headline but control-group sales that came in below forecasts.
The disinflation and soft-landing themes were a notable part of the bullish narrative this week, which also benefitted from some continued FOMO that has driven ~$40B in inflows to US equity funds over the past three weeks. Bulls could also point to a pickup in short covering, improving market breadth, and dissipating liquidity concerns about the rebuild of the Treasury’s general account. But the bearish counterargument was not far to seek, particularly with the Fed building an additional 50bp in potential rate hikes into this year’s pipeline. There were also discussions about dampened sentiment and positioning tailwinds and the risks to corporate earnings from disinflation.
In response, US equities were higher this week, with the S&P logging its fifth consecutive week of gains (the longest streak since Oct-Nov 2021). The Nasdaq Composite was up for the eighth straight week (the best since a 10-week streak into March 2019). Small-caps saw only slim gains compared to their outperformance in the two prior weeks. Semis, software, airlines, autos, apparel, and machinery all outperformed. Banks were largely down, with regionals lagging the larger-caps. Managed care, energy, REITs, and A&D were other areas of weakness.
Treasuries were mostly weaker with the curve flattening. The 2/10 spread moved to its most inverted point since before the banking crisis; this week’s 30Y Treasury auction was very well received. The dollar was notably weaker overall, though the greenback rallied this week against the yen; DXY (1.2%). Gold was down 0.3%. Oil finished higher after two weekly declines. WTI settled up 2.5%, moving farther above $70/barrel.

Fixed Income
Yield Curve
May FOMC Statement March Fed Minutes Balance Sheet Reduction Plan Credit, Liquidity and Balance Sheet Federal Reserve Dot Plots
Treasury.gov yields FOMC Policy Normalization Statement Longer- Run Goals Jan 2022
Foreign Exchange Market
Energy Complex
The Baker Hughes rig count was down by 8 this week. There are 687 oil and gas rigs operating in the US – down 53 over last year.
Metals Complex
Employment Picture
Weekly Unemployment Claims – Released Thursday 6/15/2023 – In the week ending June 10, the advance figure for seasonally adjusted initial claims was 262,000, unchanged from the previous week’s revised level. The 4-week moving average was 246,750 an increase of 9,250 from the previous week’s revised average.
May Jobs Report – BLS Summary – Released 6/2/2023 – The US Economy added 339k nonfarm jobs in May and the Unemployment rate increase 0.3% to 3.7%. Average hourly earnings increased 11 cents to $33.44. Hiring highlights include +48k Leisure and Hospitality, +97k Education and Health Services, +56 Government, and +64k Professional and Business Services.
- Average hourly earnings increased 11 cents/0.3% to $33.44.
- U3 unemployment rate increased 0.3% to 3.7%. U6 unemployment rate increased 0.1% to 6.7%.
- The labor force participation rate was unchanged at 62.6%.
- Average work week declined 0.1 hours to 34.3 hours.
Job Openings & Labor Turnover Survey JOLTS – Released 5/31/2023 – The number of job openings increased to 10.1 million on the last business day of April, the U.S. Bureau of Labor Statistics reported. Over the month the number of hires and total separations changed little at 6.1 million and 5.7 million, respectively. Within separations, quits (3.8 million) changed little and layoffs and discharges (1.6 million) changed little.
Employment Cost Index – Released 4/28/2023 – Compensation costs for civilian workers increased 1.2% for the 3-month period ending in March 2023. The 12-month period ending in March 2023 saw compensation costs increase by 4.8. The 12-month period ending March 2022 increased 4.5%. Wages and salaries increased 5.0 percent over the 12-month March 2023 and increased 4.7 percent for the 12-month period ending in March 2022. Benefit costs increased 4.5 percent over the 12-month period ending March 2023 and increased 4.1 percent for the 12-month period ending in March 2022. This report is published quarterly.
This Week’s Economic Data
Links take you to the data source
Industrial Production and Capacity Utilization – Released 6/15/2023 – Industrial production decreased 0.2% in May. Utilities output fell 1.8%. Manufacturing increased 0.1%. Mining fell 0.4%. Capacity utilization declined to 79.6% in May, 0.1% below the long-run average.
Retail Sales – Released 6/15/2023 – Headline retail sales increased 0.3% in May and are up 1.6% above May 2022.
Producer Price Index – Released 6/14/2023 – The Producer Price Index for final demand declined 0.3 percent in May, seasonally adjusted. Final demand prices rose 0.2 percent in April and fell 0.4 in March. On an unadjusted basis, the index for final demand moved up 1.1 percent for the 12 months ended in May.
Consumer Price Index – Released 6/13/2023 – The Consumer Price Index for All Urban Consumers rose 0.1 percent in May on a seasonally adjusted basis, after increasing 0.4 percent in April. Over the last 12 months, theall items index increased 4.0 percent before seasonal adjustment.
Recent Economic Data
Links take you to the data source
Consumer Credit – Released 6/7/2023 – Consumer credit increased at a seasonally adjusted annual rate of 5.7 percent in April. Revolving credit increased at an annual rate of 13.1 percent, while nonrevolving credit increased at an annual rate of 3.2 percent.
U.S. Trade Balance – Released 6/7/2023 – The U.S. Census Bureau and the U.S. Bureau of Economic Analysis announced that the goods and services deficit was $74.6 billion in April, up $14.0 billion from $60.6 billion in March. April exports were $249.0 billion, $9.2 billion less than March exports. April imports were $323.6 billion, $4.8 billion more than March imports. The April increase in the goods and services deficit reflected a increase in the goods deficit of $14.5 billion to $96.1 billion and a increase in the services surplus of $0.6 billion to $21.6 billion.
PMI Non-Manufacturing Index – Released 6/5/2023 – Economic activity in the services sector expanded in May for the fifth consecutive month as the Services PMI® registered 50.3 percent, 1.6 percentage point lower than April’s reading of 51.9 percent. The composite index indicated growth in May for the fifth consecutive month after a reading of 49.2 percent in December, the first contraction since May 2020.
U.S. Construction Spending – Released 6/1/2023 – Construction spending during April 2023 was estimated at a seasonally adjusted annual rate of $1,908.4 billion, 1.2 percent above the revised March estimate of $1,885.0 billion. The April figure is 7.2 percent above the April 2022 estimate of $1,780.9 billion.
PMI Manufacturing Index – Released 6/1/2023 – The May Manufacturing PMI registered 46.9 percent, 0.2 percentage points lower than the 47.1 percent recorded in April. Regarding the overall economy, this figure indicates a sixth month of contraction after a 30-month period of expansion. The New Orders Index remained in contraction territory at 42.6 percent, 3.1 percentage points lower than the figure of 45.7 percent recorded in April. The Production Index reading of 51.1 percent is a 2.2-percentage point increase compared to April’s figure of 48.9 percent.
Chicago PMI – Released 5/31/2023 – Chicago PMI remained in contraction territory in May crashing to 40.4 points down from 48.6 points in April. This marks nine months in contractionary territory.
Consumer Confidence – Released 5/30/2023 – Consumer Confidence fell in May to 102.3, down from 103.7 in April.
US Light Vehicle Sales – Released 5/26/2023 – U.S. light vehicle sales were at a seasonally adjusted annual rate (SAAR) of 15.915 million units in April.
Personal Income – Released 5/26/2023 – Personal income increased $80.1 billion (0.4 percent at a monthly rate) in April. Disposable personal income (DPI) increased $79.4 billion (0.4 percent). Personal outlays increased $156.0 billion (0.8 percent) and consumer spending increased $151.7 billion (0.8 percent). Personal saving was $802.1 billion and the personal saving rate—personal saving as a percentage of disposable personal income—was 4.1 percent in April.
Durable Goods – Released 5/26/2023 – New orders for manufactured durable goods in April, up two consecutive months, increased $3.1 billion or 1.1 percent to $283.0 billion, the U.S. Census Bureau announced today. This followed a 3.3 percent March increase. Excluding transportation, new orders decreased 0.2 percent. Excluding defense, new orders decreased 0.6 percent. Transportation equipment, also up two consecutive months, drove the increase, $3.5 billion or 3.7 percent to $97.6 billion. Shipments of manufactured durable goods in April, down two of the last three months, decreased $2.0 billion or 0.7 percent to $277.7 billion. This followed a 0.7 percent March increase.
2nd Estimate of 1st Quarter 2023 GDP – Released 5/25/2023 – Real gross domestic product (GDP) increased at an annual rate of 1.3 percent in the first quarter of 2023, according to the “second” estimate released by the Bureau of Economic Analysis. In the fourth quarter, real GDP increased 2.6 percent.
New Residential Sales – Released 5/23/2023 – Sales of new single‐family houses in April 2023 were at a seasonally adjusted annual rate of 683,000, according to estimates released jointly by the U.S. Census Bureau and the Department of Housing and Urban Development.
This is 4.1 percent above the revised March rate of 656,000 and is 11.8 percent above the April 2022 estimate of 611,000. The median sales price of new houses sold in April 2023 was $420,800. The average sales price was $501,000.
Existing Home Sales – Released 5/18/2023 – April 2023 brought 4.28 million in sales, a median sales price of $388,800, and 2.9 months of inventory.
Housing Starts – Released 5/17/2023 – April housing starts came in at a 1401K SAAR, nearly in line with 1400K consensus. Highest monthly pace since June 2022. Better than March’s 1371K, which saw a big downward revision from the original 1420K print. Starts up 2.2% m/m though down 22.3% y/y. Data noted upshift in both single-family and multifamily construction. Biggest increases in West, while all other regions saw decline in single-family starts
Next week we get data on Housing Starts and Existing Home Sales.
Data Sources:
Bureau of Economic Analysis (BEA)
Congressional Budget Office (CBO)
U.S. Bureau of Labor Statistics (BLS)
Federal Reserve Economic Data (FRED Charts)
CME Fed Watch
U.S. Treasury – Yields
U.S. Census Bureau
Institute for Supply Management (ISM)
Weekly DOL Employment Data
BLS Monthly Jobs Report
JOLTS
US Energy Admin (EIA)
BLS Consumer Price Index CPI
BLS Producer Price Index PPI
Atlanta Fed GDPNOW
NY Fed Nowcast GDP
US Census Bureau Housing Starts
Consumer Credit
USCB Retail Sales
Construction Spending
Federal Reserve Dot Plots
NY Empire Index
Philadelphia Federal Reserve
P/E Ratio Data -Yardeni Research
Technical Analysis Info:
StockCharts.com – Financial Charts
Exponential vs Simple moving average
Koyfin.com
Other Links:
1973 Arab Oil Embargo
Hunt Brothers Silver
Long-Term Capital bailout
Asian Contagion


Week 24 Talking Points
Table of Contents
Good Life Advisors – Talking Points – Week 24
The week’s big event was the June FOMC meeting, where the Fed decided to hold rates steady for the first time after a 10-meeting hiking campaign that brought 500bp of tightening. At the same time, the statement and press conference hinted at the possibility of more hikes ahead, should these be necessary. While the 50bp rise in the median 2023 forecast on the dot plot in June’s updated Summary of Economic Projections was more hawkish than expected, the meeting was largely consistent with the incoming consensus for the Fed to “skip” and give more time for the economic backdrop to evolve. Market pricing now reflects expectations for a 25bp hike in July, then a pause through the end of the year, and a first-rate cut at the FOMC’s January 2024 meeting. FedWatch Tool
It was also a week thick with economic updates, bringing some support for the disinflation narrative. The May CPI report (which was released the day before the Fed decision) showed a cooler-than-expected headline increase, with the y/y change dropping to just 4.0% (the lowest since March 2021). While some core elements remained elevated (particularly used cars and shelter), analyst takes were relatively optimistic. May PPI also posted a larger-than-expected monthly decline on lower energy prices, with the core largely in line. Disinflation was also reflected in the prices paid/received data from the June NY and Philadelphia Fed manufacturing reports. There was also a big decline in year-ahead inflation expectations in the UMich consumer sentiment report. May’s retail sales report was more mixed, with a consensus-beating headline but control-group sales that came in below forecasts.
The disinflation and soft-landing themes were a notable part of the bullish narrative this week, which also benefitted from some continued FOMO that has driven ~$40B in inflows to US equity funds over the past three weeks. Bulls could also point to a pickup in short covering, improving market breadth, and dissipating liquidity concerns about the rebuild of the Treasury’s general account. But the bearish counterargument was not far to seek, particularly with the Fed building an additional 50bp in potential rate hikes into this year’s pipeline. There were also discussions about dampened sentiment and positioning tailwinds and the risks to corporate earnings from disinflation.
In response, US equities were higher this week, with the S&P logging its fifth consecutive week of gains (the longest streak since Oct-Nov 2021). The Nasdaq Composite was up for the eighth straight week (the best since a 10-week streak into March 2019). Small-caps saw only slim gains compared to their outperformance in the two prior weeks. Semis, software, airlines, autos, apparel, and machinery all outperformed. Banks were largely down, with regionals lagging the larger-caps. Managed care, energy, REITs, and A&D were other areas of weakness.
Treasuries were mostly weaker with the curve flattening. The 2/10 spread moved to its most inverted point since before the banking crisis; this week’s 30Y Treasury auction was very well received. The dollar was notably weaker overall, though the greenback rallied this week against the yen; DXY (1.2%). Gold was down 0.3%. Oil finished higher after two weekly declines. WTI settled up 2.5%, moving farther above $70/barrel.
Fixed Income
Yield Curve
May FOMC Statement March Fed Minutes Balance Sheet Reduction Plan Credit, Liquidity and Balance Sheet Federal Reserve Dot Plots
Treasury.gov yields FOMC Policy Normalization Statement Longer- Run Goals Jan 2022
Foreign Exchange Market
Energy Complex
The Baker Hughes rig count was down by 8 this week. There are 687 oil and gas rigs operating in the US – down 53 over last year.
Metals Complex
Employment Picture
Weekly Unemployment Claims – Released Thursday 6/15/2023 – In the week ending June 10, the advance figure for seasonally adjusted initial claims was 262,000, unchanged from the previous week’s revised level. The 4-week moving average was 246,750 an increase of 9,250 from the previous week’s revised average.
May Jobs Report – BLS Summary – Released 6/2/2023 – The US Economy added 339k nonfarm jobs in May and the Unemployment rate increase 0.3% to 3.7%. Average hourly earnings increased 11 cents to $33.44. Hiring highlights include +48k Leisure and Hospitality, +97k Education and Health Services, +56 Government, and +64k Professional and Business Services.
Job Openings & Labor Turnover Survey JOLTS – Released 5/31/2023 – The number of job openings increased to 10.1 million on the last business day of April, the U.S. Bureau of Labor Statistics reported. Over the month the number of hires and total separations changed little at 6.1 million and 5.7 million, respectively. Within separations, quits (3.8 million) changed little and layoffs and discharges (1.6 million) changed little.
Employment Cost Index – Released 4/28/2023 – Compensation costs for civilian workers increased 1.2% for the 3-month period ending in March 2023. The 12-month period ending in March 2023 saw compensation costs increase by 4.8. The 12-month period ending March 2022 increased 4.5%. Wages and salaries increased 5.0 percent over the 12-month March 2023 and increased 4.7 percent for the 12-month period ending in March 2022. Benefit costs increased 4.5 percent over the 12-month period ending March 2023 and increased 4.1 percent for the 12-month period ending in March 2022. This report is published quarterly.
This Week’s Economic Data
Links take you to the data source
Industrial Production and Capacity Utilization – Released 6/15/2023 – Industrial production decreased 0.2% in May. Utilities output fell 1.8%. Manufacturing increased 0.1%. Mining fell 0.4%. Capacity utilization declined to 79.6% in May, 0.1% below the long-run average.
Retail Sales – Released 6/15/2023 – Headline retail sales increased 0.3% in May and are up 1.6% above May 2022.
Producer Price Index – Released 6/14/2023 – The Producer Price Index for final demand declined 0.3 percent in May, seasonally adjusted. Final demand prices rose 0.2 percent in April and fell 0.4 in March. On an unadjusted basis, the index for final demand moved up 1.1 percent for the 12 months ended in May.
Consumer Price Index – Released 6/13/2023 – The Consumer Price Index for All Urban Consumers rose 0.1 percent in May on a seasonally adjusted basis, after increasing 0.4 percent in April. Over the last 12 months, theall items index increased 4.0 percent before seasonal adjustment.
Recent Economic Data
Links take you to the data source
Consumer Credit – Released 6/7/2023 – Consumer credit increased at a seasonally adjusted annual rate of 5.7 percent in April. Revolving credit increased at an annual rate of 13.1 percent, while nonrevolving credit increased at an annual rate of 3.2 percent.
U.S. Trade Balance – Released 6/7/2023 – The U.S. Census Bureau and the U.S. Bureau of Economic Analysis announced that the goods and services deficit was $74.6 billion in April, up $14.0 billion from $60.6 billion in March. April exports were $249.0 billion, $9.2 billion less than March exports. April imports were $323.6 billion, $4.8 billion more than March imports. The April increase in the goods and services deficit reflected a increase in the goods deficit of $14.5 billion to $96.1 billion and a increase in the services surplus of $0.6 billion to $21.6 billion.
PMI Non-Manufacturing Index – Released 6/5/2023 – Economic activity in the services sector expanded in May for the fifth consecutive month as the Services PMI® registered 50.3 percent, 1.6 percentage point lower than April’s reading of 51.9 percent. The composite index indicated growth in May for the fifth consecutive month after a reading of 49.2 percent in December, the first contraction since May 2020.
U.S. Construction Spending – Released 6/1/2023 – Construction spending during April 2023 was estimated at a seasonally adjusted annual rate of $1,908.4 billion, 1.2 percent above the revised March estimate of $1,885.0 billion. The April figure is 7.2 percent above the April 2022 estimate of $1,780.9 billion.
PMI Manufacturing Index – Released 6/1/2023 – The May Manufacturing PMI registered 46.9 percent, 0.2 percentage points lower than the 47.1 percent recorded in April. Regarding the overall economy, this figure indicates a sixth month of contraction after a 30-month period of expansion. The New Orders Index remained in contraction territory at 42.6 percent, 3.1 percentage points lower than the figure of 45.7 percent recorded in April. The Production Index reading of 51.1 percent is a 2.2-percentage point increase compared to April’s figure of 48.9 percent.
Chicago PMI – Released 5/31/2023 – Chicago PMI remained in contraction territory in May crashing to 40.4 points down from 48.6 points in April. This marks nine months in contractionary territory.
Consumer Confidence – Released 5/30/2023 – Consumer Confidence fell in May to 102.3, down from 103.7 in April.
US Light Vehicle Sales – Released 5/26/2023 – U.S. light vehicle sales were at a seasonally adjusted annual rate (SAAR) of 15.915 million units in April.
Personal Income – Released 5/26/2023 – Personal income increased $80.1 billion (0.4 percent at a monthly rate) in April. Disposable personal income (DPI) increased $79.4 billion (0.4 percent). Personal outlays increased $156.0 billion (0.8 percent) and consumer spending increased $151.7 billion (0.8 percent). Personal saving was $802.1 billion and the personal saving rate—personal saving as a percentage of disposable personal income—was 4.1 percent in April.
Durable Goods – Released 5/26/2023 – New orders for manufactured durable goods in April, up two consecutive months, increased $3.1 billion or 1.1 percent to $283.0 billion, the U.S. Census Bureau announced today. This followed a 3.3 percent March increase. Excluding transportation, new orders decreased 0.2 percent. Excluding defense, new orders decreased 0.6 percent. Transportation equipment, also up two consecutive months, drove the increase, $3.5 billion or 3.7 percent to $97.6 billion. Shipments of manufactured durable goods in April, down two of the last three months, decreased $2.0 billion or 0.7 percent to $277.7 billion. This followed a 0.7 percent March increase.
2nd Estimate of 1st Quarter 2023 GDP – Released 5/25/2023 – Real gross domestic product (GDP) increased at an annual rate of 1.3 percent in the first quarter of 2023, according to the “second” estimate released by the Bureau of Economic Analysis. In the fourth quarter, real GDP increased 2.6 percent.
New Residential Sales – Released 5/23/2023 – Sales of new single‐family houses in April 2023 were at a seasonally adjusted annual rate of 683,000, according to estimates released jointly by the U.S. Census Bureau and the Department of Housing and Urban Development.
This is 4.1 percent above the revised March rate of 656,000 and is 11.8 percent above the April 2022 estimate of 611,000. The median sales price of new houses sold in April 2023 was $420,800. The average sales price was $501,000.
Existing Home Sales – Released 5/18/2023 – April 2023 brought 4.28 million in sales, a median sales price of $388,800, and 2.9 months of inventory.
Housing Starts – Released 5/17/2023 – April housing starts came in at a 1401K SAAR, nearly in line with 1400K consensus. Highest monthly pace since June 2022. Better than March’s 1371K, which saw a big downward revision from the original 1420K print. Starts up 2.2% m/m though down 22.3% y/y. Data noted upshift in both single-family and multifamily construction. Biggest increases in West, while all other regions saw decline in single-family starts
Next week we get data on Housing Starts and Existing Home Sales.
Data Sources:
Bureau of Economic Analysis (BEA)
Congressional Budget Office (CBO)
U.S. Bureau of Labor Statistics (BLS)
Federal Reserve Economic Data (FRED Charts)
CME Fed Watch
U.S. Treasury – Yields
U.S. Census Bureau
Institute for Supply Management (ISM)
Weekly DOL Employment Data
BLS Monthly Jobs Report
JOLTS
US Energy Admin (EIA)
BLS Consumer Price Index CPI
BLS Producer Price Index PPI
Atlanta Fed GDPNOW
NY Fed Nowcast GDP
US Census Bureau Housing Starts
Consumer Credit
USCB Retail Sales
Construction Spending
Federal Reserve Dot Plots
NY Empire Index
Philadelphia Federal Reserve
P/E Ratio Data -Yardeni Research
Technical Analysis Info:
StockCharts.com – Financial Charts
Exponential vs Simple moving average
Koyfin.com
Other Links:
1973 Arab Oil Embargo
Hunt Brothers Silver
Long-Term Capital bailout
Asian Contagion
Categories:
Tags: