Good Life Advisors – Talking Points – Week 23
It was an extremely quiet week, with the market’s attention pulled ahead to next week’s May CPI report (13-Jun) and the June FOMC meeting decision (14-Jun). Corporate news was very thin at the very tail end of the Q1 earnings season. There were only two economic releases of any note. May’s ISM services index missed, with its employment component shifting into contraction and prices paid continuing to tick lower. There was a notable step up in weekly initial jobless claims, though continuing claims were well below forecasts.
Filling the vacuum was a lot of commentary about the more momentous week to come. May’s headline CPI is expected to soften to a 0.2% m/m rise from April’s 0.4%, with energy prices, lower food inflation, and seasonal factors among the drags. Core prices are seen holding at a 0.4% m/m pace, with analysts seeing higher used-car pricing as a driver. In terms of the Fed, market pricing currently reflects forecasts for the FOMC to hold rates at the 5.00-5.25% level; though consensus expects this to be a “skip” rather than a pause, with Powell next week possibly hinting that a July hike remains a possibility.
The uneventful week also left little scope for change to the broad market narrative. The bull case is still largely underpinned by expected disinflationary progress, the Fed at or near the end of its tightening campaign, soft-landing hopes, earnings optimism, and positioning/technical dynamics with more recently added factors including broadening leadership and a growing sense of FOMO. On the bearish side of the ledger are fears of hawkish central banks (the week saw surprise hikes from the BoC and RBA), a dampened sentiment tailwind, some signs of softening consumer trends, somewhat anemic China reopening momentum, and disinflation bringing dampened pricing power
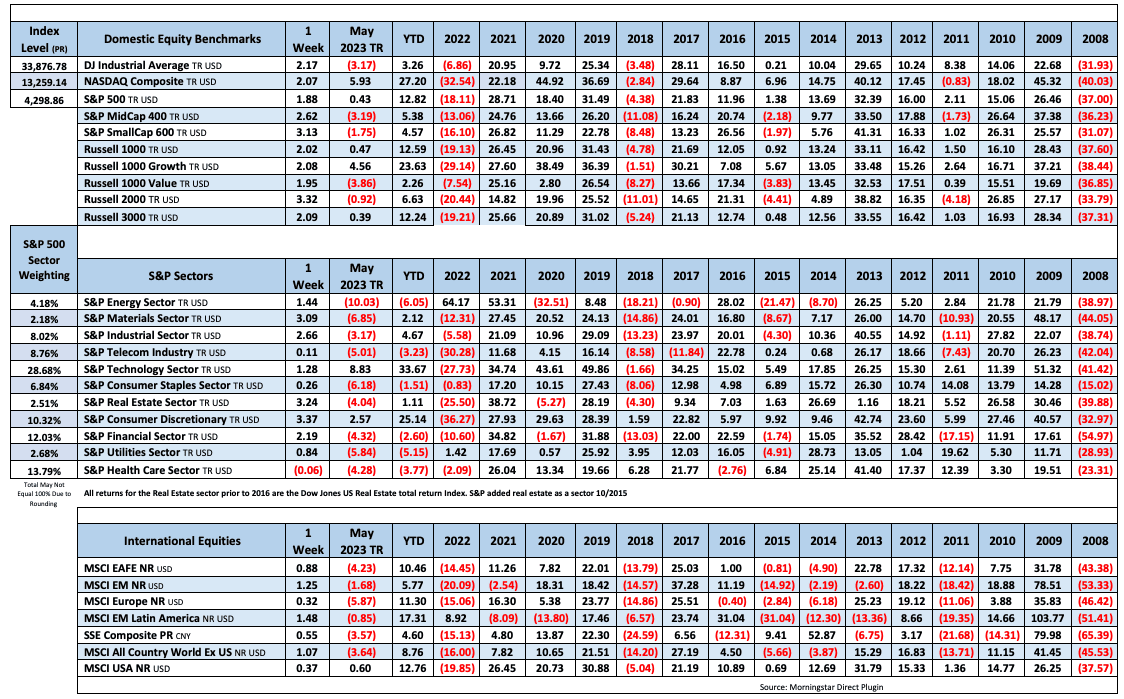
With little new information, equity markets were mostly higher for the week. The S&P logged its fourth straight weekly gain, cresting the 4300 mark at one point and finishing more than 20% above its 52-week low. The Nasdaq Composite notched its seventh consecutive weekly rise, tying its longest streak since Oct-Nov 2019). Small-caps had another good week after lagging for much of the spring. Market leadership continued to broaden beyond Big Tech, with autos, airlines, energy, machinery, building products, A&D, and banks (particularly regionals) all outperforming.
Treasuries were weaker, with some curve flattening, with the 2Y touching its highest levels since before the March banking crisis. The dollar was down on the major crosses, particularly vs sterling. Gold was up 0.4%, its second consecutive weekly gain. Oil was slightly weaker amid a dampened reaction to a 1M bpd Saudi production cut announced last weekend. WTI settled down 2.2% with the grade now having declined for six of the past eight weeks.
Fixed Income

Yield Curve
May FOMC Statement March Fed Minutes Balance Sheet Reduction Plan Credit, Liquidity and Balance Sheet Federal Reserve Dot Plots
Treasury.gov yields FOMC Policy Normalization Statement Longer- Run Goals Jan 2022
Foreign Exchange Market
Energy Complex
The Baker Hughes rig count was down by 1 this week. There are 695 oil and gas rigs operating in the US – down 38 over last year.
Metals Complex
Employment Picture
Weekly Unemployment Claims – Released Thursday 6/8/2023 – In the week ending June 3, the advance figure for seasonally adjusted initial claims was 261,000, an increase of 28,000 from the previous week’s revised level. This is the highest level for initial claims since 10/30/2021. The 4-week moving average was 237,250 an increase of 7,500 from the previous week’s revised average.
May Jobs Report – BLS Summary – Released 6/2/2023 – The US Economy added 339k nonfarm jobs in May and the Unemployment rate increase 0.3% to 3.7%. Average hourly earnings increased 11 cents to $33.44. Hiring highlights include +48k Leisure and Hospitality, +97k Education and Health Services, +56 Government, and +64k Professional and Business Services.
- Average hourly earnings increased 11 cents/0.3% to $33.44.
- U3 unemployment rate increased 0.3% to 3.7%. U6 unemployment rate increased 0.1% to 6.7%.
- The labor force participation rate was unchanged at 62.6%.
- Average work week declined 0.1 hours to 34.3 hours.
Job Openings & Labor Turnover Survey JOLTS – Released 5/31/2023 – The number of job openings increased to 10.1 million on the last business day of April, the U.S. Bureau of Labor Statistics reported. Over the month the number of hires and total separations changed little at 6.1 million and 5.7 million, respectively. Within separations, quits (3.8 million) changed little and layoffs and discharges (1.6 million) changed little.
Employment Cost Index – Released 4/28/2023 – Compensation costs for civilian workers increased 1.2% for the 3-month period ending in March 2023. The 12-month period ending in March 2023 saw compensation costs increase by 4.8. The 12-month period ending March 2022 increased 4.5%. Wages and salaries increased 5.0 percent over the 12-month March 2023 and increased 4.7 percent for the 12-month period ending in March 2022. Benefit costs increased 4.5 percent over the 12-month period ending March 2023 and increased 4.1 percent for the 12-month period ending in March 2022. This report is published quarterly.
This Week’s Economic Data
Links take you to the data source
Consumer Credit – Released 6/7/2023 – Consumer credit increased at a seasonally adjusted annual rate of 5.7 percent in April. Revolving credit increased at an annual rate of 13.1 percent, while nonrevolving credit increased at an annual rate of 3.2 percent.
U.S. Trade Balance – Released 6/7/2023 – The U.S. Census Bureau and the U.S. Bureau of Economic Analysis announced that the goods and services deficit was $74.6 billion in April, up $14.0 billion from $60.6 billion in March. April exports were $249.0 billion, $9.2 billion less than March exports. April imports were $323.6 billion, $4.8 billion more than March imports. The April increase in the goods and services deficit reflected a increase in the goods deficit of $14.5 billion to $96.1 billion and an increase in the services surplus of $0.6 billion to $21.6 billion.
PMI Non-Manufacturing Index – Released 6/5/2023 – Economic activity in the services sector expanded in May for the fifth consecutive month as the Services PMI® registered 50.3 percent, 1.6 percentage point lower than April’s reading of 51.9 percent. The composite index indicated growth in May for the fifth consecutive month after a reading of 49.2 percent in December, the first contraction since May 2020.
Recent Economic Data
Links take you to the data source
U.S. Construction Spending – Released 6/1/2023 – Construction spending during April 2023 was estimated at a seasonally adjusted annual rate of $1,908.4 billion, 1.2 percent above the revised March estimate of $1,885.0 billion. The April figure is 7.2 percent above the April 2022 estimate of $1,780.9 billion.
PMI Manufacturing Index – Released 6/1/2023 – The May Manufacturing PMI registered 46.9 percent, 0.2 percentage points lower than the 47.1 percent recorded in April. Regarding the overall economy, this figure indicates a sixth month of contraction after a 30-month period of expansion. The New Orders Index remained in contraction territory at 42.6 percent, 3.1 percentage points lower than the figure of 45.7 percent recorded in April. The Production Index reading of 51.1 percent is a 2.2-percentage point increase compared to April’s figure of 48.9 percent.
Chicago PMI – Released 5/31/2023 – Chicago PMI remained in contraction territory in May crashing to 40.4 points down from 48.6 points in April. This marks nine months in contractionary territory.
Consumer Confidence – Released 5/30/2023 – Consumer Confidence fell in May to 102.3, down from 103.7 in April.
US Light Vehicle Sales – Released 5/26/2023 – U.S. light vehicle sales were at a seasonally adjusted annual rate (SAAR) of 15.915 million units in April.
Personal Income – Released 5/26/2023 – Personal income increased $80.1 billion (0.4 percent at a monthly rate) in April. Disposable personal income (DPI) increased $79.4 billion (0.4 percent). Personal outlays increased $156.0 billion (0.8 percent) and consumer spending increased $151.7 billion (0.8 percent). Personal saving was $802.1 billion and the personal saving rate—personal saving as a percentage of disposable personal income—was 4.1 percent in April.
Durable Goods – Released 5/26/2023 – New orders for manufactured durable goods in April, up two consecutive months, increased $3.1 billion or 1.1 percent to $283.0 billion, the U.S. Census Bureau announced today. This followed a 3.3 percent March increase. Excluding transportation, new orders decreased 0.2 percent. Excluding defense, new orders decreased 0.6 percent. Transportation equipment, also up two consecutive months, drove the increase, $3.5 billion or 3.7 percent to $97.6 billion. Shipments of manufactured durable goods in April, down two of the last three months, decreased $2.0 billion or 0.7 percent to $277.7 billion. This followed a 0.7 percent March increase.
2nd Estimate of 1st Quarter 2023 GDP – Released 5/25/2023 – Real gross domestic product (GDP) increased at an annual rate of 1.3 percent in the first quarter of 2023, according to the “second” estimate released by the Bureau of Economic Analysis. In the fourth quarter, real GDP increased 2.6 percent.
New Residential Sales – Released 5/23/2023 – Sales of new single‐family houses in April 2023 were at a seasonally adjusted annual rate of 683,000, according to estimates released jointly by the U.S. Census Bureau and the Department of Housing and Urban Development.
This is 4.1 percent above the revised March rate of 656,000 and is 11.8 percent above the April 2022 estimate of 611,000. The median sales price of new houses sold in April 2023 was $420,800. The average sales price was $501,000.
Existing Home Sales – Released 5/18/2023 – April 2023 brought 4.28 million in sales, a median sales price of $388,800, and 2.9 months of inventory.
Housing Starts – Released 5/17/2023 – April housing starts came in at a 1401K SAAR, nearly in line with 1400K consensus. Highest monthly pace since June 2022. Better than March’s 1371K, which saw a big downward revision from the original 1420K print. Starts up 2.2% m/m though down 22.3% y/y. Data noted upshift in both single-family and multifamily construction. Biggest increases in West, while all other regions saw decline in single-family starts
Industrial Production and Capacity Utilization – Released 5/16/2023 – Industrial production increased 0.5% in April (0.0% including revisions to prior months) versus a consensus expected 0.0%. Utilities output fell 3.1% in April, Overall capacity utilization rose to 79.7% in April from 79.4% in March.
Manufacturing capacity utilization increased to 78.3% in April from 77.6% while mining rose 0.6%.
Retail Sales – Released 5/16/2023 – Headline retail sales up 0.4% m/m, missing consensus for 0.8% growth, though March revised up to -0.7% from initial 1.0% decline. Retail sales ex-autos of 0.4% below 0.5% consensus, while March also revised up 0.4pp to a 0.5% decline. Retail sales ex-autos and fuel of 0.6% beat 0.3% consensus, reversing last month’s 0.5% decline.
Producer Price Index – Released 5/11/2023 – The Producer Price Index for final demand advanced 0.2 percent in April, seasonally adjusted, Final demand prices fell 0.4 percent in March and were unchanged in February. On an unadjusted basis, the index for final demand moved up 2.3 percent for the 12 months ended in April.
Consumer Price Index – Released 5/10/2023 – The Consumer Price Index for All Urban Consumers rose 0.4 percent in April on a seasonally adjusted basis after increasing 0.1 percent in March. Over the last 12 months, the all-items index increased 4.9 percent before seasonal adjustment. This was the smallest 12-month increase since the period ending April 2021. The index for all items less food and energy rose 0.4 percent in April, as it did in March. Indexes that increased in April include shelter, used cars and trucks, motor vehicle insurance, recreation, household furnishings and operations, and personal care.
Next week we get data on CPI, PPI, Retail Sales, and Industrial Production and Capacity Utilization.
Data Sources:
Bureau of Economic Analysis (BEA)
Congressional Budget Office (CBO)
U.S. Bureau of Labor Statistics (BLS)
Federal Reserve Economic Data (FRED Charts)
CME Fed Watch
U.S. Treasury – Yields
U.S. Census Bureau
Institute for Supply Management (ISM)
Weekly DOL Employment Data
BLS Monthly Jobs Report
JOLTS
US Energy Admin (EIA)
BLS Consumer Price Index CPI
BLS Producer Price Index PPI
Atlanta Fed GDPNOW
NY Fed Nowcast GDP
US Census Bureau Housing Starts
Consumer Credit
USCB Retail Sales
Construction Spending
Federal Reserve Dot Plots
NY Empire Index
Philadelphia Federal Reserve
P/E Ratio Data -Yardeni Research
Technical Analysis Info:
StockCharts.com – Financial Charts
Exponential vs Simple moving average
Koyfin.com
Other Links:
1973 Arab Oil Embargo
Hunt Brothers Silver
Long-Term Capital bailout
Asian Contagion


Week 23 Talking Points
Table of Contents
Good Life Advisors – Talking Points – Week 23
It was an extremely quiet week, with the market’s attention pulled ahead to next week’s May CPI report (13-Jun) and the June FOMC meeting decision (14-Jun). Corporate news was very thin at the very tail end of the Q1 earnings season. There were only two economic releases of any note. May’s ISM services index missed, with its employment component shifting into contraction and prices paid continuing to tick lower. There was a notable step up in weekly initial jobless claims, though continuing claims were well below forecasts.
Filling the vacuum was a lot of commentary about the more momentous week to come. May’s headline CPI is expected to soften to a 0.2% m/m rise from April’s 0.4%, with energy prices, lower food inflation, and seasonal factors among the drags. Core prices are seen holding at a 0.4% m/m pace, with analysts seeing higher used-car pricing as a driver. In terms of the Fed, market pricing currently reflects forecasts for the FOMC to hold rates at the 5.00-5.25% level; though consensus expects this to be a “skip” rather than a pause, with Powell next week possibly hinting that a July hike remains a possibility.
The uneventful week also left little scope for change to the broad market narrative. The bull case is still largely underpinned by expected disinflationary progress, the Fed at or near the end of its tightening campaign, soft-landing hopes, earnings optimism, and positioning/technical dynamics with more recently added factors including broadening leadership and a growing sense of FOMO. On the bearish side of the ledger are fears of hawkish central banks (the week saw surprise hikes from the BoC and RBA), a dampened sentiment tailwind, some signs of softening consumer trends, somewhat anemic China reopening momentum, and disinflation bringing dampened pricing power
With little new information, equity markets were mostly higher for the week. The S&P logged its fourth straight weekly gain, cresting the 4300 mark at one point and finishing more than 20% above its 52-week low. The Nasdaq Composite notched its seventh consecutive weekly rise, tying its longest streak since Oct-Nov 2019). Small-caps had another good week after lagging for much of the spring. Market leadership continued to broaden beyond Big Tech, with autos, airlines, energy, machinery, building products, A&D, and banks (particularly regionals) all outperforming.
Treasuries were weaker, with some curve flattening, with the 2Y touching its highest levels since before the March banking crisis. The dollar was down on the major crosses, particularly vs sterling. Gold was up 0.4%, its second consecutive weekly gain. Oil was slightly weaker amid a dampened reaction to a 1M bpd Saudi production cut announced last weekend. WTI settled down 2.2% with the grade now having declined for six of the past eight weeks.
Fixed Income
Yield Curve
May FOMC Statement March Fed Minutes Balance Sheet Reduction Plan Credit, Liquidity and Balance Sheet Federal Reserve Dot Plots
Treasury.gov yields FOMC Policy Normalization Statement Longer- Run Goals Jan 2022
Foreign Exchange Market
Energy Complex
The Baker Hughes rig count was down by 1 this week. There are 695 oil and gas rigs operating in the US – down 38 over last year.
Metals Complex
Employment Picture
Weekly Unemployment Claims – Released Thursday 6/8/2023 – In the week ending June 3, the advance figure for seasonally adjusted initial claims was 261,000, an increase of 28,000 from the previous week’s revised level. This is the highest level for initial claims since 10/30/2021. The 4-week moving average was 237,250 an increase of 7,500 from the previous week’s revised average.
May Jobs Report – BLS Summary – Released 6/2/2023 – The US Economy added 339k nonfarm jobs in May and the Unemployment rate increase 0.3% to 3.7%. Average hourly earnings increased 11 cents to $33.44. Hiring highlights include +48k Leisure and Hospitality, +97k Education and Health Services, +56 Government, and +64k Professional and Business Services.
Job Openings & Labor Turnover Survey JOLTS – Released 5/31/2023 – The number of job openings increased to 10.1 million on the last business day of April, the U.S. Bureau of Labor Statistics reported. Over the month the number of hires and total separations changed little at 6.1 million and 5.7 million, respectively. Within separations, quits (3.8 million) changed little and layoffs and discharges (1.6 million) changed little.
Employment Cost Index – Released 4/28/2023 – Compensation costs for civilian workers increased 1.2% for the 3-month period ending in March 2023. The 12-month period ending in March 2023 saw compensation costs increase by 4.8. The 12-month period ending March 2022 increased 4.5%. Wages and salaries increased 5.0 percent over the 12-month March 2023 and increased 4.7 percent for the 12-month period ending in March 2022. Benefit costs increased 4.5 percent over the 12-month period ending March 2023 and increased 4.1 percent for the 12-month period ending in March 2022. This report is published quarterly.
This Week’s Economic Data
Links take you to the data source
Consumer Credit – Released 6/7/2023 – Consumer credit increased at a seasonally adjusted annual rate of 5.7 percent in April. Revolving credit increased at an annual rate of 13.1 percent, while nonrevolving credit increased at an annual rate of 3.2 percent.
U.S. Trade Balance – Released 6/7/2023 – The U.S. Census Bureau and the U.S. Bureau of Economic Analysis announced that the goods and services deficit was $74.6 billion in April, up $14.0 billion from $60.6 billion in March. April exports were $249.0 billion, $9.2 billion less than March exports. April imports were $323.6 billion, $4.8 billion more than March imports. The April increase in the goods and services deficit reflected a increase in the goods deficit of $14.5 billion to $96.1 billion and an increase in the services surplus of $0.6 billion to $21.6 billion.
PMI Non-Manufacturing Index – Released 6/5/2023 – Economic activity in the services sector expanded in May for the fifth consecutive month as the Services PMI® registered 50.3 percent, 1.6 percentage point lower than April’s reading of 51.9 percent. The composite index indicated growth in May for the fifth consecutive month after a reading of 49.2 percent in December, the first contraction since May 2020.
Recent Economic Data
Links take you to the data source
U.S. Construction Spending – Released 6/1/2023 – Construction spending during April 2023 was estimated at a seasonally adjusted annual rate of $1,908.4 billion, 1.2 percent above the revised March estimate of $1,885.0 billion. The April figure is 7.2 percent above the April 2022 estimate of $1,780.9 billion.
PMI Manufacturing Index – Released 6/1/2023 – The May Manufacturing PMI registered 46.9 percent, 0.2 percentage points lower than the 47.1 percent recorded in April. Regarding the overall economy, this figure indicates a sixth month of contraction after a 30-month period of expansion. The New Orders Index remained in contraction territory at 42.6 percent, 3.1 percentage points lower than the figure of 45.7 percent recorded in April. The Production Index reading of 51.1 percent is a 2.2-percentage point increase compared to April’s figure of 48.9 percent.
Chicago PMI – Released 5/31/2023 – Chicago PMI remained in contraction territory in May crashing to 40.4 points down from 48.6 points in April. This marks nine months in contractionary territory.
Consumer Confidence – Released 5/30/2023 – Consumer Confidence fell in May to 102.3, down from 103.7 in April.
US Light Vehicle Sales – Released 5/26/2023 – U.S. light vehicle sales were at a seasonally adjusted annual rate (SAAR) of 15.915 million units in April.
Personal Income – Released 5/26/2023 – Personal income increased $80.1 billion (0.4 percent at a monthly rate) in April. Disposable personal income (DPI) increased $79.4 billion (0.4 percent). Personal outlays increased $156.0 billion (0.8 percent) and consumer spending increased $151.7 billion (0.8 percent). Personal saving was $802.1 billion and the personal saving rate—personal saving as a percentage of disposable personal income—was 4.1 percent in April.
Durable Goods – Released 5/26/2023 – New orders for manufactured durable goods in April, up two consecutive months, increased $3.1 billion or 1.1 percent to $283.0 billion, the U.S. Census Bureau announced today. This followed a 3.3 percent March increase. Excluding transportation, new orders decreased 0.2 percent. Excluding defense, new orders decreased 0.6 percent. Transportation equipment, also up two consecutive months, drove the increase, $3.5 billion or 3.7 percent to $97.6 billion. Shipments of manufactured durable goods in April, down two of the last three months, decreased $2.0 billion or 0.7 percent to $277.7 billion. This followed a 0.7 percent March increase.
2nd Estimate of 1st Quarter 2023 GDP – Released 5/25/2023 – Real gross domestic product (GDP) increased at an annual rate of 1.3 percent in the first quarter of 2023, according to the “second” estimate released by the Bureau of Economic Analysis. In the fourth quarter, real GDP increased 2.6 percent.
New Residential Sales – Released 5/23/2023 – Sales of new single‐family houses in April 2023 were at a seasonally adjusted annual rate of 683,000, according to estimates released jointly by the U.S. Census Bureau and the Department of Housing and Urban Development.
This is 4.1 percent above the revised March rate of 656,000 and is 11.8 percent above the April 2022 estimate of 611,000. The median sales price of new houses sold in April 2023 was $420,800. The average sales price was $501,000.
Existing Home Sales – Released 5/18/2023 – April 2023 brought 4.28 million in sales, a median sales price of $388,800, and 2.9 months of inventory.
Housing Starts – Released 5/17/2023 – April housing starts came in at a 1401K SAAR, nearly in line with 1400K consensus. Highest monthly pace since June 2022. Better than March’s 1371K, which saw a big downward revision from the original 1420K print. Starts up 2.2% m/m though down 22.3% y/y. Data noted upshift in both single-family and multifamily construction. Biggest increases in West, while all other regions saw decline in single-family starts
Industrial Production and Capacity Utilization – Released 5/16/2023 – Industrial production increased 0.5% in April (0.0% including revisions to prior months) versus a consensus expected 0.0%. Utilities output fell 3.1% in April, Overall capacity utilization rose to 79.7% in April from 79.4% in March.
Manufacturing capacity utilization increased to 78.3% in April from 77.6% while mining rose 0.6%.
Retail Sales – Released 5/16/2023 – Headline retail sales up 0.4% m/m, missing consensus for 0.8% growth, though March revised up to -0.7% from initial 1.0% decline. Retail sales ex-autos of 0.4% below 0.5% consensus, while March also revised up 0.4pp to a 0.5% decline. Retail sales ex-autos and fuel of 0.6% beat 0.3% consensus, reversing last month’s 0.5% decline.
Producer Price Index – Released 5/11/2023 – The Producer Price Index for final demand advanced 0.2 percent in April, seasonally adjusted, Final demand prices fell 0.4 percent in March and were unchanged in February. On an unadjusted basis, the index for final demand moved up 2.3 percent for the 12 months ended in April.
Consumer Price Index – Released 5/10/2023 – The Consumer Price Index for All Urban Consumers rose 0.4 percent in April on a seasonally adjusted basis after increasing 0.1 percent in March. Over the last 12 months, the all-items index increased 4.9 percent before seasonal adjustment. This was the smallest 12-month increase since the period ending April 2021. The index for all items less food and energy rose 0.4 percent in April, as it did in March. Indexes that increased in April include shelter, used cars and trucks, motor vehicle insurance, recreation, household furnishings and operations, and personal care.
Next week we get data on CPI, PPI, Retail Sales, and Industrial Production and Capacity Utilization.
Data Sources:
Bureau of Economic Analysis (BEA)
Congressional Budget Office (CBO)
U.S. Bureau of Labor Statistics (BLS)
Federal Reserve Economic Data (FRED Charts)
CME Fed Watch
U.S. Treasury – Yields
U.S. Census Bureau
Institute for Supply Management (ISM)
Weekly DOL Employment Data
BLS Monthly Jobs Report
JOLTS
US Energy Admin (EIA)
BLS Consumer Price Index CPI
BLS Producer Price Index PPI
Atlanta Fed GDPNOW
NY Fed Nowcast GDP
US Census Bureau Housing Starts
Consumer Credit
USCB Retail Sales
Construction Spending
Federal Reserve Dot Plots
NY Empire Index
Philadelphia Federal Reserve
P/E Ratio Data -Yardeni Research
Technical Analysis Info:
StockCharts.com – Financial Charts
Exponential vs Simple moving average
Koyfin.com
Other Links:
1973 Arab Oil Embargo
Hunt Brothers Silver
Long-Term Capital bailout
Asian Contagion
Categories:
Tags: