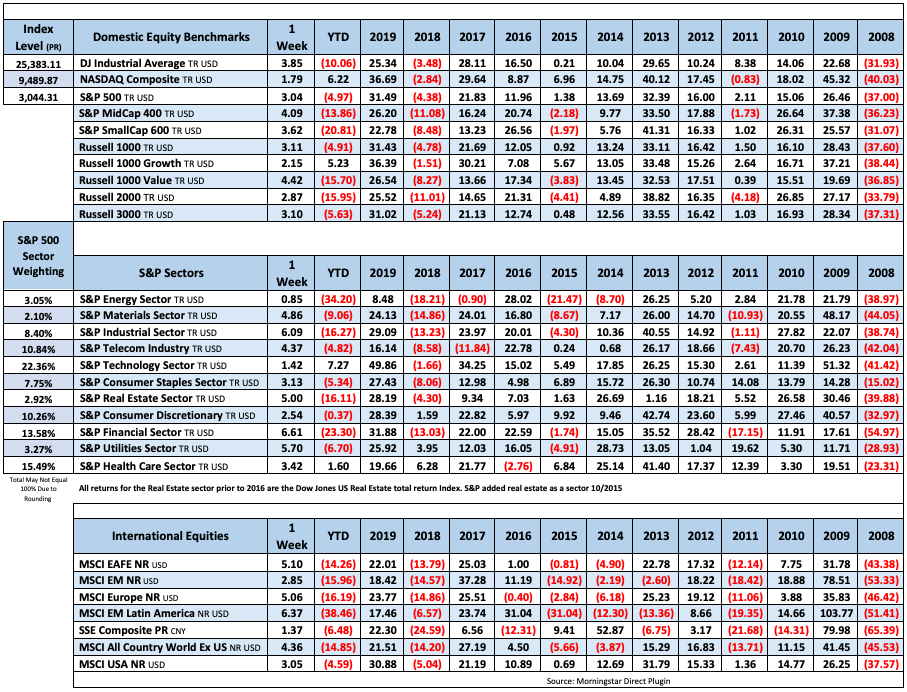
Equity markets gained for the second week in a row leaving May with a 4.53% return. Continued optimism about an economic recovery and a fear of missing out on further gains appear to be the main causes. Although all 11 sectors were positive for the week, there was a noticeable rotation into value, which more than doubled growth, 4.42% over 2.15%. Industrials, financials and utilities lead, while tech was “only” up 1.42%. The market’s leadership has shifted over the past two weeks, and the latest leg of the rebound has been underpinned by shares of companies that were considered laggards just weeks ago.
Obviously there are many reasons to proceed with caution here; the S&P, according to FactSet, is trading at 21.8x forward twelve-month earnings, (a 44% premium to 10-yr average) at a time when more than 40 million people have lost their jobs, politics are getting nasty again, and the coronavirus still does not have a vaccine. Additionally, uncertainty is growing regarding U.S.- China relations after China approved legislation to tighten its control over Hong Kong. President Trump said the U.S. will eliminate special treatment for Hong Kong, study practices of Chinese companies on U.S. exchanges, and terminate its relationship with the World Health Organization. We’ll see how the phase one trade deal continues to play out.

Fixed Income
3/15/2020 Statement
FOMC December Statement Federal Reserve Dot Plots US Debt Measurement US Corporate Debt Tops $6 Trillion Treasury.gov yields
FOMC Policy Normalization Statement
Global Bond Yields
The Fed has been busy buying back all sorts of assets during COVID-19. The total fed holdings are just under seven trillion this week.
We can add the United Kingdom to the negative interest rate club.
Daily US Treasury Yields
Foreign Exchange Market
Energy Complex
The Baker Hughes rig count was down 17 this week. There are 301 oil and gas rigs operating in the US – down 683 over last year.
- Brent Crude Oil gained 6.11% this week closing at $37.84/bbl
- WTI Crude Oil gained 6.74% this week to close at $35.49/bbl
- Heating Oil gained 1.65% this week closing at $1.04/gallon
- Natural Gas lost 1.70% this week closing at $1.85 per million BTUs
- Unleaded Gas gained 2.54% this week closing at $1.08/gallon
Metals Complex
- Gold gained 0.93% this week closing at $1751.70/oz
- Silver gained 4.56% on the week closing at $18.50/oz
- Palladium declined 0.21% this week closing at $1972.90/oz
- Platinum declined 1.32% this week closing at $874.60/oz
- Copper gained 1.63% this week closing at $2.43/lb
Employment Picture
Weekly Unemployment Claims – Released Thursday 5/28/2020 – In the week ending May 23rd, initial claims were 2,123,000, a decrease of 323,000 from the previous week’s revised level. The 4-week moving average was 2,608,000 a decrease of 436,000 from the previous week’s revised average.
Job Openings & Labor Turnover Survey JOLTS – Released 5/15/2020 – The U.S. Bureau of Labor Statistics reported the number and rate of job openings declined to 6.2 million on the last business day of March. Over the month, hires declined to 5.2 million and separations increased by 8.9 million to 14.5 million. Within separations, the quits rate declined to 1.8%. The layoffs and discharges rates increased to 7.5%.
May Jobs Report – BLS Summary – Released 5/8/2020 – The US Economy lost 20.5 million nonfarm jobs in April and the Unemployment rate increased to 14.7%. Average hourly earnings increased by $1.34. Hiring highlights include Leisure and Hospitality -7.7 million, Education and Health Services -2.5 million, Retail Trade -2.1 million, Manufacturing -1.3 million.
- Average hourly earnings increased by $1.34 in April to $30.01.
- U3 unemployment rate increased to 14.7%. U6 unemployment rate increased to 22.8%.
- The labor force participation rate declined by 2.5% to 60.2%.
- Average workweek increased by 0.1 hours to 34.2 hours.
Employment Cost Index – Released 4/30/2020 – Compensation costs for civilian workers increased 0.8% for the 3-month period ending in March 2020. The 12 month period ending in March 2020 saw compensation costs increase by 2.8%, same as the 12 month period ending March 2019. Wages and salaries increased 3.1 percent over the year and increased 2.9 percent for the 12-month period ending in March 2019. Benefit costs increased 2.1 percent for the 12-month period ending in March 2020. In March 2019, the increase was 2.6 percent. This report is published quarterly.
This Week’s Economic Data
Links take you to the data source
Chicago PMI – Released 5/29 – Chicago PMI declined 3.1 points decreasing to 32.3. This marks ten consecutive months in contraction and the lowest level since March 1982.
Personal Income – Released 5/29 – Personal income increased $1.97 trillion or 10.5 percent in April according to estimates released today by the Bureau of Economic Analysis. Disposable personal income (DPI) increased $2.13 trillion or 12.9 percent and personal consumption expenditures (PCE) decreased $1.89 trillion or 13.6 percent.
Second Estimate of 1st Quarter 2020 GDP – Released 5/28 – Real gross domestic product (GDP) decreased at an annual rate of 5.0 percent in the first quarter of 2020, according to the second estimate released by the Bureau of Economic Analysis. In the fourth quarter of 2019, real GDP increased 2.1 percent. This second GDP estimate is based on more complete source data than were available for the “advance” estimate issued last month. In the advance estimate, the decrease in real GDP was 4.8 percent. With the second estimate, a downward revision to private inventory investment was partly offset by upward revisions to personal consumption expenditures (PCE) and nonresidential fixed investment. The decrease in real GDP in the first quarter reflected negative contributions from personal consumption expenditures (PCE), nonresidential fixed investment, exports, and private inventory investment that were partly offset by positive contributions from residential fixed investment, federal government spending, and state and local government spending.
Durable Goods – Released 5/28 – New orders for manufactured durable goods decreased $35.4billion or 17.2% in April. Down three of the last four months.
Consumer Confidence – Released 5/26 – The Consumer confidence index increased slightly by 0.9% in May following a sharp decline in April. The Index now shows a reading of 86.6, up from 85.7 in April.
New Residential Sales – Released 5/26 – Sales of new single-family homes increased 0.6% to 623k, seasonally adjusted, in April. The median sales price of new homes sold in April was $309,900 with an average sales price of $364,500. At the end of April the seasonally adjusted estimate of new homes for sale was 325k. This represents a supply of 6.3 months at the current sales rate.
Recent Economic Data
Links take you to the data source
Existing Home Sales – Released 5/21 – Existing home sales declined in April. Sales declined 17.8% to a seasonally adjusted rate of 4.33 million. Sales are currently down 17.2% from one year ago. Housing inventory sits at 1.47 million units. Down 1.3% over last month. Down 19.7% over last year. Unsold inventory sits at a 4.1 month supply.
Housing Starts – Released 5/19 – New home starts in April were at a seasonally adjusted annual rate of 891k; down 30.2% below March and 29.7% below last April’s rate. Building Permits were at a seasonally adjusted annual rate of 1.074 million, down 20.8% compared to March and down 19.2% over last year.
Industrial Production and Capacity Utilization – Released 5/15 – In April Industrial production declined 11.2%. Manufacturing declined 13.7%, its largest decline on record. The output of motor vehicles and parts is down more than 70 percent. Industrial production was 92.6% of its 2012 average which is 15.0% lower than a year ago. Total capacity utilization declined 8.3% to 64.9% in April which is 14.9% below its long-run average.
Retail Sales – Released 5/15 – U.S. retail sales for April declined 16.4% to $403.9 billion. U.S. retail sales are down 21.6% year/y.
Producer Price Index – Released 5/13 – The Producer Price Index for final demand declined 1.3% in April. Core PPI was down 0.4%. Year over year the index for final demand declined 1.2%.
Consumer Price Index – Released 5/12 – The Consumer Price Index declined 0.8% in April. Core CPI, which excludes food and energy declined 0.4%. The monthly changes left total CPI up 0.3% year-over-year and core CPI up 1.4%.
Consumer Credit – Released 5/7 – Consumer credit increased at a seasonally adjusted annual rate of 1.75% in March. Revolving and nonrevolving credit decreased at annual rates of 10.25% and increased 6.0% respectively. Total Outstanding consumer credit is currently at $4.2093 trillion.
PMI Non-Manufacturing Index (ISM Services) – Released 5/5 – Economic activity in the non-manufacturing sector contracted in April for the first time since December 2009 ending 122 months of growth. ISM Non-Manufacturing registered 41.8 percent, which is 10.7 percentage points below the adjusted March reading of 52.5 percent. This represents contraction in the non-manufacturing sector and marks the lowest reading since March 2009.
U.S. Trade Balance – Released 5/5 – According to the U.S. Census Bureau of Economic Analysis, the goods and services deficit increased in March $4.6 billion to $44.4 billion. March exports were $187.7 billion, $20.0 billion less than February exports. March imports were $232.2 billion, $15.4 billion less than February imports. The goods and services deficit decreased $28.1 billion or 17.8% year/y. Year – over – year exports and imports decreased $21.7 billion or 3.5% and decreased $49.7 billion or 6.4% respectively.
PMI Manufacturing ISM Index – Released 5/1 – April PMI declined 7.6% to 41.5% from March’s reading of 49.1%. The New Orders Index was down 15.1% from March’s reading of 42.2% to 27.1%. The Production Index registered 27.5%, down 20.2%.
U.S. Construction Spending – Released 5/1 – Construction spending increased 0.9% in March measuring at a seasonally adjusted annual rate of $1,360.5billion. The March figure is 4.7% above the March 2019 estimate. Private construction spending was 0.7% above the revised February estimate at $1,005.8 billion. Public construction spending was 1.6% above the revised February estimate at $348.0 billion.
US Light Vehicle Sales – Released 2/28 – U.S. light vehicle sales were at a seasonally adjusted annual rate (SAAR) of 16.81 million units in January.
Next week we get data on U.S. Construction Spending, ISM Services, Consumer Credit, the PMI Manufacturing ISM Index, the U.S. Trade Balance, and the May Jobs Report.
Data Sources:
Bureau of Economic Analysis (BEA)
Congressional Budget Office (CBO)
U.S. Bureau of Labor Statistics (BLS)
Federal Reserve Economic Data (FRED Charts)
CME Fed Watch
U.S. Treasury – Yields
U.S. Census Bureau
Institute for Supply Management (ISM)
Weekly DOL Employment Data
BLS Monthly Jobs Report
JOLTS
US Energy Admin (EIA)
BLS Consumer Price Index CPI
BLS Producer Price Index PPI
Atlanta Fed GDPNOW
NY Fed Nowcast GDP
US Census Bureau Housing Starts
Consumer Credit
USCB Retail Sales
Construction Spending
Federal Reserve Dot Plots
NY Empire Index
Philadelphia Federal Reserve
P/E Ratio Data -Yardeni Research
Technical Analysis Info:
StockCharts.com – Financial Charts
Exponential vs Simple moving average
Other Links:
1973 Arab Oil Embargo
Hunt Brothers Silver
Long-Term Capital bailout


Week 22 Talking Points
Equity markets gained for the second week in a row leaving May with a 4.53% return. Continued optimism about an economic recovery and a fear of missing out on further gains appear to be the main causes. Although all 11 sectors were positive for the week, there was a noticeable rotation into value, which more than doubled growth, 4.42% over 2.15%. Industrials, financials and utilities lead, while tech was “only” up 1.42%. The market’s leadership has shifted over the past two weeks, and the latest leg of the rebound has been underpinned by shares of companies that were considered laggards just weeks ago.
Obviously there are many reasons to proceed with caution here; the S&P, according to FactSet, is trading at 21.8x forward twelve-month earnings, (a 44% premium to 10-yr average) at a time when more than 40 million people have lost their jobs, politics are getting nasty again, and the coronavirus still does not have a vaccine. Additionally, uncertainty is growing regarding U.S.- China relations after China approved legislation to tighten its control over Hong Kong. President Trump said the U.S. will eliminate special treatment for Hong Kong, study practices of Chinese companies on U.S. exchanges, and terminate its relationship with the World Health Organization. We’ll see how the phase one trade deal continues to play out.
Table of Contents
Fixed Income
3/15/2020 Statement
FOMC December Statement Federal Reserve Dot Plots US Debt Measurement US Corporate Debt Tops $6 Trillion Treasury.gov yields
FOMC Policy Normalization Statement
Global Bond Yields
The Fed has been busy buying back all sorts of assets during COVID-19. The total fed holdings are just under seven trillion this week.
We can add the United Kingdom to the negative interest rate club.
Daily US Treasury Yields
Foreign Exchange Market
Energy Complex
The Baker Hughes rig count was down 17 this week. There are 301 oil and gas rigs operating in the US – down 683 over last year.
Metals Complex
Employment Picture
Weekly Unemployment Claims – Released Thursday 5/28/2020 – In the week ending May 23rd, initial claims were 2,123,000, a decrease of 323,000 from the previous week’s revised level. The 4-week moving average was 2,608,000 a decrease of 436,000 from the previous week’s revised average.
Job Openings & Labor Turnover Survey JOLTS – Released 5/15/2020 – The U.S. Bureau of Labor Statistics reported the number and rate of job openings declined to 6.2 million on the last business day of March. Over the month, hires declined to 5.2 million and separations increased by 8.9 million to 14.5 million. Within separations, the quits rate declined to 1.8%. The layoffs and discharges rates increased to 7.5%.
May Jobs Report – BLS Summary – Released 5/8/2020 – The US Economy lost 20.5 million nonfarm jobs in April and the Unemployment rate increased to 14.7%. Average hourly earnings increased by $1.34. Hiring highlights include Leisure and Hospitality -7.7 million, Education and Health Services -2.5 million, Retail Trade -2.1 million, Manufacturing -1.3 million.
Employment Cost Index – Released 4/30/2020 – Compensation costs for civilian workers increased 0.8% for the 3-month period ending in March 2020. The 12 month period ending in March 2020 saw compensation costs increase by 2.8%, same as the 12 month period ending March 2019. Wages and salaries increased 3.1 percent over the year and increased 2.9 percent for the 12-month period ending in March 2019. Benefit costs increased 2.1 percent for the 12-month period ending in March 2020. In March 2019, the increase was 2.6 percent. This report is published quarterly.
This Week’s Economic Data
Links take you to the data source
Chicago PMI – Released 5/29 – Chicago PMI declined 3.1 points decreasing to 32.3. This marks ten consecutive months in contraction and the lowest level since March 1982.
Personal Income – Released 5/29 – Personal income increased $1.97 trillion or 10.5 percent in April according to estimates released today by the Bureau of Economic Analysis. Disposable personal income (DPI) increased $2.13 trillion or 12.9 percent and personal consumption expenditures (PCE) decreased $1.89 trillion or 13.6 percent.
Second Estimate of 1st Quarter 2020 GDP – Released 5/28 – Real gross domestic product (GDP) decreased at an annual rate of 5.0 percent in the first quarter of 2020, according to the second estimate released by the Bureau of Economic Analysis. In the fourth quarter of 2019, real GDP increased 2.1 percent. This second GDP estimate is based on more complete source data than were available for the “advance” estimate issued last month. In the advance estimate, the decrease in real GDP was 4.8 percent. With the second estimate, a downward revision to private inventory investment was partly offset by upward revisions to personal consumption expenditures (PCE) and nonresidential fixed investment. The decrease in real GDP in the first quarter reflected negative contributions from personal consumption expenditures (PCE), nonresidential fixed investment, exports, and private inventory investment that were partly offset by positive contributions from residential fixed investment, federal government spending, and state and local government spending.
Durable Goods – Released 5/28 – New orders for manufactured durable goods decreased $35.4billion or 17.2% in April. Down three of the last four months.
Consumer Confidence – Released 5/26 – The Consumer confidence index increased slightly by 0.9% in May following a sharp decline in April. The Index now shows a reading of 86.6, up from 85.7 in April.
New Residential Sales – Released 5/26 – Sales of new single-family homes increased 0.6% to 623k, seasonally adjusted, in April. The median sales price of new homes sold in April was $309,900 with an average sales price of $364,500. At the end of April the seasonally adjusted estimate of new homes for sale was 325k. This represents a supply of 6.3 months at the current sales rate.
Recent Economic Data
Links take you to the data source
Existing Home Sales – Released 5/21 – Existing home sales declined in April. Sales declined 17.8% to a seasonally adjusted rate of 4.33 million. Sales are currently down 17.2% from one year ago. Housing inventory sits at 1.47 million units. Down 1.3% over last month. Down 19.7% over last year. Unsold inventory sits at a 4.1 month supply.
Housing Starts – Released 5/19 – New home starts in April were at a seasonally adjusted annual rate of 891k; down 30.2% below March and 29.7% below last April’s rate. Building Permits were at a seasonally adjusted annual rate of 1.074 million, down 20.8% compared to March and down 19.2% over last year.
Industrial Production and Capacity Utilization – Released 5/15 – In April Industrial production declined 11.2%. Manufacturing declined 13.7%, its largest decline on record. The output of motor vehicles and parts is down more than 70 percent. Industrial production was 92.6% of its 2012 average which is 15.0% lower than a year ago. Total capacity utilization declined 8.3% to 64.9% in April which is 14.9% below its long-run average.
Retail Sales – Released 5/15 – U.S. retail sales for April declined 16.4% to $403.9 billion. U.S. retail sales are down 21.6% year/y.
Producer Price Index – Released 5/13 – The Producer Price Index for final demand declined 1.3% in April. Core PPI was down 0.4%. Year over year the index for final demand declined 1.2%.
Consumer Price Index – Released 5/12 – The Consumer Price Index declined 0.8% in April. Core CPI, which excludes food and energy declined 0.4%. The monthly changes left total CPI up 0.3% year-over-year and core CPI up 1.4%.
Consumer Credit – Released 5/7 – Consumer credit increased at a seasonally adjusted annual rate of 1.75% in March. Revolving and nonrevolving credit decreased at annual rates of 10.25% and increased 6.0% respectively. Total Outstanding consumer credit is currently at $4.2093 trillion.
PMI Non-Manufacturing Index (ISM Services) – Released 5/5 – Economic activity in the non-manufacturing sector contracted in April for the first time since December 2009 ending 122 months of growth. ISM Non-Manufacturing registered 41.8 percent, which is 10.7 percentage points below the adjusted March reading of 52.5 percent. This represents contraction in the non-manufacturing sector and marks the lowest reading since March 2009.
U.S. Trade Balance – Released 5/5 – According to the U.S. Census Bureau of Economic Analysis, the goods and services deficit increased in March $4.6 billion to $44.4 billion. March exports were $187.7 billion, $20.0 billion less than February exports. March imports were $232.2 billion, $15.4 billion less than February imports. The goods and services deficit decreased $28.1 billion or 17.8% year/y. Year – over – year exports and imports decreased $21.7 billion or 3.5% and decreased $49.7 billion or 6.4% respectively.
PMI Manufacturing ISM Index – Released 5/1 – April PMI declined 7.6% to 41.5% from March’s reading of 49.1%. The New Orders Index was down 15.1% from March’s reading of 42.2% to 27.1%. The Production Index registered 27.5%, down 20.2%.
U.S. Construction Spending – Released 5/1 – Construction spending increased 0.9% in March measuring at a seasonally adjusted annual rate of $1,360.5billion. The March figure is 4.7% above the March 2019 estimate. Private construction spending was 0.7% above the revised February estimate at $1,005.8 billion. Public construction spending was 1.6% above the revised February estimate at $348.0 billion.
US Light Vehicle Sales – Released 2/28 – U.S. light vehicle sales were at a seasonally adjusted annual rate (SAAR) of 16.81 million units in January.
Next week we get data on U.S. Construction Spending, ISM Services, Consumer Credit, the PMI Manufacturing ISM Index, the U.S. Trade Balance, and the May Jobs Report.
Data Sources:
Bureau of Economic Analysis (BEA)
Congressional Budget Office (CBO)
U.S. Bureau of Labor Statistics (BLS)
Federal Reserve Economic Data (FRED Charts)
CME Fed Watch
U.S. Treasury – Yields
U.S. Census Bureau
Institute for Supply Management (ISM)
Weekly DOL Employment Data
BLS Monthly Jobs Report
JOLTS
US Energy Admin (EIA)
BLS Consumer Price Index CPI
BLS Producer Price Index PPI
Atlanta Fed GDPNOW
NY Fed Nowcast GDP
US Census Bureau Housing Starts
Consumer Credit
USCB Retail Sales
Construction Spending
Federal Reserve Dot Plots
NY Empire Index
Philadelphia Federal Reserve
P/E Ratio Data -Yardeni Research
Technical Analysis Info:
StockCharts.com – Financial Charts
Exponential vs Simple moving average
Other Links:
1973 Arab Oil Embargo
Hunt Brothers Silver
Long-Term Capital bailout
Categories:
Tags: