US equities were higher for the week, seeing gains from much of the FANMAG complex and small-caps logging a solid weekly performance.
Treasuries were firmer with some curve steepening. The dollar was down on the euro and sterling crosses, but notably better vs the yen. Gold was higher for the fourth consecutive week, rising 1.5%. Oil broke a five-day streak of gains on Friday but finished the week up 4.3%.
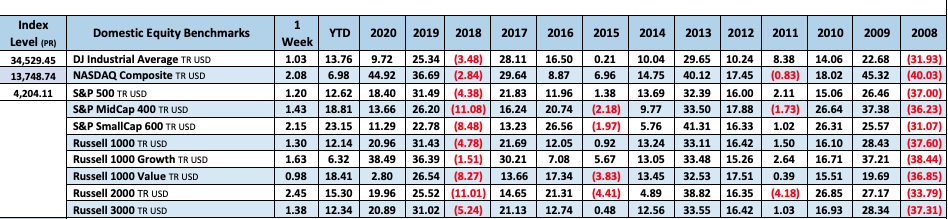
Growth outperformed value this week but values still leads ytd by 1200bps. Communication services led on strong results from internets and media. Consumer discretionary was helped by autos and retailers. Airlines and multis were better in industrials. Semis were among the better performers in tech, though the hardware space was mixed. Financials lagged, seeing some scattered weakness among regional banks and life insurers. Paper/packaging firms weighed on materials. Refiners and integrators were some of the drags on energy. Pharma and biotech were generally lower in healthcare. Utilities was the week’s big decliner.
Overall, it was a very uneventful week ahead of Monday’s Memorial Day holiday, with the headlines doing little to advance the narratives of greatest interest to the market. Indeed, the broader market has largely been in a holding pattern this month, with May’s absolute movement in the S&P 500 (up 0.55%) the lowest since January 2020 (when it was down just 0.16%). There was a dearth of catalysts, with Q1 earnings season effectively over, fiscal stimulus progress coming slowly, economic reopening and domestic Covid trends improving as expected, and concerns about the Fed tapering its asset-purchase program focused on the 16-Jun FOMC meeting.
Fed officials continued talking about talking about tapering. Fed officials this week continued musing about an eventual taper to the bank’s $120B/m asset-purchase plan. There was some minor progress on a bipartisan infrastructure plan this week, with GOP senators unveiling a $928B counterproposal to President Biden’s latest $1.7T offer. Biden said he would continue negotiating next week, beyond his original self-imposed deadline of Memorial Day. There were also headlines about another Republican “Plan B” in the works. But despite movement in the top line, expectations are limited given the parties still remain far apart on the pay-fors (with the GOP continuing to suggest EV user fees and unspent Covid relief funds, an approach the White House has rejected).
There was a mix of economic data this week, though nothing to greatly shift the narrative of a generally improving economy facing well-understood price and supply pressures. April new home sales and pending home sales were both light of consensus. April’s core PCE price index came in at 3.6%, ahead of forecasts and the highest level since June 2008. May consumer confidence was a bit light, but with another big gain in the labor market differential (jobs plentiful vs hard to get). Initial jobless claims posted another weekly drop, hitting their lowest level since mid-March 2020.

Fixed Income
4/28/21 FOMC Statement FOMC Minutes Credit, Liquidity and Balance Sheet Federal Reserve Dot Plots
US Corporate Debt Tops 7 Trillion. Treasury.gov yields FOMC Policy Normalization Statement Longer Run Goals August 2020
Global Bond Yields
Daily US Treasury Yields
Foreign Exchange Market
Energy Complex
The Baker Hughes rig count gained 2 this week. There are 457 oil and gas rigs operating in the US – Up 156 over last year.
- Brent Crude Oil gained 4.02% this week closing at $69.02/bbl
- WTI Crude Oil gained 4.31% this week to close at $66.32/bbl
- Heating Oil gained 2.55% this week closing at $2.04/gallon
- Natural Gas gained 0.30% this week closing at $2.99 per million BTUs
- Unleaded Gas gained 3.19% this week closing at $2.14/gallon
Metals Complex
- Gold gained 1.52% this week closing at $1905.30/oz
- Silver gained 1.92% on the week closing at $28.01/oz
- Palladium gained 1.63% this week closing at $2830.10/oz
- Platinum gained 1.11% this week closing at $1182.40/oz
- Copper gained 4.39% this week closing at $4.68/lb
Employment Picture
Weekly Unemployment Claims – Released Thursday 5/27/2021 – Initial jobless claims for the week ending May 22nd decreased 38k to 406k. The 4-week moving average was 459k, a decrease of 46k. This is the lowest level for this average since 3/14/2020 when the average was 225.5k.
Job Openings & Labor Turnover Survey JOLTS – Released 5/11/2021 – The U.S. Bureau of Labor Statistics reported the number and rate of job openings increased to 8.1 million on the last business day of March. Over the month, hires were little changed at 6.0 million and separations was little changed at 5.3 million. Within separations, the quits rate was unchanged at 2.4%. The layoffs and discharges rates decreased to 1.0%.
April Jobs Report – BLS Summary – Released 5/7/2021 – The US Economy added 266k nonfarm jobs in April and the Unemployment rate was little changed at 6.1%. Average hourly earnings increased by 21 cents to $30.17. Hiring highlights include +331k Leisure and Hospitality, +48k Government, -79k Professional and Business Services.
Economists noted the historic miss in payroll employment did not stem from technical issues such as seasonal adjustment and indicated that outside of leisure and hospitality, hiring all but stalled in April. The US economy still has 8.2M fewer jobs than Feb-20. However, the workweek and wages rose unexpectedly, which more than made up for the miss in hiring. As a result, private income growth appeared to pick up in April from the already strong pace seen last quarter. There were some indications that labor supply is adjusting, however. The labor force participation rate increased, signaling more workers made their services available during the month. Perhaps not surprisingly, the gains were made up largely by young people while older adults continued to stay away. One interpretation of today’s somewhat muddled report is that the economy is going through a short-term imbalance between labor demand and supply as Covid fears, lack of childcare, and generous fiscal support serve to delay workers from taking jobs. These impacts may diminish through the year, allowing further recovery in hiring. Input materials are another constraint which may be longer lived. For example, semiconductor shortages continued to weigh on automobile manufacturing in April.
- Average hourly earnings increased by 21 cents to $30.17.
- U3 unemployment rate was little changed at 6.1%. U6 unemployment rate declined to 10.4%.
- The labor force participation rate was little changed at 61.7%.
- Average work week increased by 0.1 hour to 35.0 hours.
Employment Cost Index – Released 4/30/2021 – Compensation costs for civilian workers increased 0.9% for the 3-month period ending in March 2021. The 12-month period ending in March 2021 saw compensation costs increase by 2.6%. The 12-month period ending March 2020 increased 2.8%. Wages and salaries increased 2.7 percent over the year and increased 3.1 percent for the 12-month period ending in March 2020. Benefit costs increased 2.5 percent over the year and increased 2.1 percent for the 12-month period ending in March 2020. This report is published quarterly.
This Week’s Economic Data
Links take you to the data source
Chicago PMI – Released 5/28/2021 – Chicago PMI increased to 75.2 points in May. This marks 11 consecutive months above the 50-mark following a full year under it. Among the main five indicators, New Orders and Order Backlogs saw the largest gains, while Employment recorded the only decline.
Personal Income – Released 5/28/2021 – Personal income decreased $3.21 trillion or 13.1 percent in April according to estimates released today by the Bureau of Economic Analysis. Disposable personal income (DPI) decreased $3.22 trillion or 14.6 percent and personal consumption expenditures (PCE) increased $80.3 billion or 0.5 percent.
Second Estimate of 1st Quarter 2021 GDP – Released 5/27/2021 – Real gross domestic product (GDP) increased at an annual rate of 6.4 percent in the first quarter of 2021, according to the second estimate released by the Bureau of Economic Analysis. The fourth quarter of 2020 saw an increase of 4.3 percent in real GDP. The increase in real GDP in the first quarter reflected increases in personal consumption expenditures (PCE), nonresidential fixed investment, federal government spending, residential fixed investment, and state and local government spending that were partly offset by decreases in private inventory investment and exports. Imports, which are a subtraction in the calculation of GDP, increased. The second estimate is based on more complete source data than were available for the “advance” estimate issued last month. In the advance estimate, the increase in real GDP was also 6.4 percent. Upward revisions to consumer spending and nonresidential fixed investment were offset by downward revisions to exports and private inventory investment. Imports, which are a subtraction in the calculation of GDP, were revised up
Durable Goods – Released 5/27/2021 – New orders for manufactured durable goods in April increased $3.2 billion or 1.3% to $246.2 billion. Transportation equipment led the decrease declining $4.9 billion or 6.7% to $68.9 billion.
Consumer Confidence – Released 5/25/2021 – The Consumer confidence index increased 11.7% in April following a sharp increase in March. The Index now shows its highest reading in a year of 121.7, up from 109.0 in March.
New Residential Sales – Released 5/25/2021 – Sales of new single-family homes decreased 5.9% to 863,000, seasonally adjusted, in April. The median sales price of new homes sold in April was $372,400 with an average sales price of $435,400. At the end of April, the seasonally adjusted estimate of new homes for sale was 316k. This represents a supply of 4.4 months at the current sales rate.
Recent Economic Data
Links take you to the data source
Existing Home Sales – Released 5/21/2021 – Existing home sales decreased in April following two months of declines. Sales decreased 2.7% to a seasonally adjusted rate of 5.85 million in April. Sales are currently up 33.9% from one year ago. Housing inventory sits at 1.16 million units. Up 10.5% from March’s inventory. Down 20.5% over last year. Unsold inventory sits at a 2.4-month supply. The median existing home price for all housing types was $341,600.
Housing Starts – Released 5/18/2021 – New home starts in April were at a seasonally adjusted annual rate of 1.569 million; down 9.5% below March, but 67.3% above last April’s rate. Building Permits were at a seasonally adjusted annual rate of 1.760 million, up 0.3% compared to March and up 60.9% over last year.
Retail Sales – Released 5/14/2021 – U.S. retail sales for April were nearly identical to the prior month at $619.9 billion. U.S. retail sales are up 51.2% year/y.
Industrial Production and Capacity Utilization – Released 5/14/2021 – In April Industrial production increased 0.7%. Mining increased 0.7%. Utilities output increased 2.6%. Total industrial production was 106.3% of its 2012 average which is 16.5% higher in April than a year ago, but still 2.7% below its pre-pandemic level. Total capacity utilization increased 0.5% to 74.9% in April which is 4.7% below its long run average.
Producer Price Index – Released 5/13/2021 – The Producer Price Index for final demand increased 0.6% in April. PPI less food and energy increased 1.0% in April.
Consumer Price Index – Released 5/12/2021 – The Consumer Price Index increased 0.8% in April. Core CPI, which excludes food and energy was up 0.9%. The monthly changes left total CPI up 4.2% year-over-year and core CPI up 3.0%.
Consumer Credit – Released 5/7/2021 – Consumer credit increased at a seasonally adjusted annual rate of 5.1 percent during the first quarter. Revolving credit increased at an annual rate of 2.4 percent, while nonrevolving credit increased at an annual rate of 5.9 percent. In March, consumer credit increased at an annual rate of 7.4 percent
PMI Non-Manufacturing Index – Released 5/5/2021 – Economic activity in the non-manufacturing sector grew in April for the 11th consecutive month. ISM Non-Manufacturing registered 62.7 percent, which is 1.0 percentage point below the adjusted March reading of 63.7 percent.
US Light Vehicle Sales – Released 5/5/2021 – U.S. light vehicle sales were at a seasonally adjusted annual rate (SAAR) of 18.507 million units in April.
U.S. Trade Balance – Released 5/4/2021 – According to the U.S. Census Bureau of Economic Analysis the goods and services deficit increased in March by $3.9 billion to $74.4 billion. March exports were $200.0 billion, $12.4 billion more than February exports. March imports were $274.5 billion, $16.4 billion more than February imports. Year to date the goods and services deficit increased $83.2 billion or 64.2%, from the same period in 2020. Year to date exports and imports decreased $21.0 billion or 3.5% and increased $62.2 billion or 8.5% respectively.
PMI Manufacturing Index – Released 5/3/2021 – April PMI declined 4.0% to 60.7% from March’s reading of 64.7%. The New Orders Index was down 3.7% from March’s reading of 68.0% to 64.3%. The Production Index registered 62.5%, down 5.6%.
U.S. Construction Spending – Released 5/3/2021 – Construction spending increased 0.2% in March measuring at a seasonally adjusted annual rate of $1,513.1 billion. The March figure is 5.3% above the March 2020 estimate. Private construction spending was 0.7% above the revised February estimate at $1,160.9 billion. Public construction spending was 1.5% below the revised February estimate at $343.9 billion.
Next week we get data on U.S. Construction Spending, PMI Manufacturing, PMI Services, and the May Jobs Report.
Data Sources:
Bureau of Economic Analysis (BEA)
Congressional Budget Office (CBO)
U.S. Bureau of Labor Statistics (BLS)
Federal Reserve Economic Data (FRED Charts)
CME Fed Watch
U.S. Treasury – Yields
U.S. Census Bureau
Institute for Supply Management (ISM)
Weekly DOL Employment Data
BLS Monthly Jobs Report
JOLTS
US Energy Admin (EIA)
BLS Consumer Price Index CPI
BLS Producer Price Index PPI
Atlanta Fed GDPNOW
NY Fed Nowcast GDP
US Census Bureau Housing Starts
Consumer Credit
USCB Retail Sales
Construction Spending
Federal Reserve Dot Plots
NY Empire Index
Philadelphia Federal Reserve
P/E Ratio Data -Yardeni Research
Technical Analysis Info:
StockCharts.com – Financial Charts
Exponential vs Simple moving average
Other Links:
1973 Arab Oil Embargo
Hunt Brothers Silver
Long-Term Capital bailout


Week 21 Talking Points
US equities were higher for the week, seeing gains from much of the FANMAG complex and small-caps logging a solid weekly performance.
Treasuries were firmer with some curve steepening. The dollar was down on the euro and sterling crosses, but notably better vs the yen. Gold was higher for the fourth consecutive week, rising 1.5%. Oil broke a five-day streak of gains on Friday but finished the week up 4.3%.
Growth outperformed value this week but values still leads ytd by 1200bps. Communication services led on strong results from internets and media. Consumer discretionary was helped by autos and retailers. Airlines and multis were better in industrials. Semis were among the better performers in tech, though the hardware space was mixed. Financials lagged, seeing some scattered weakness among regional banks and life insurers. Paper/packaging firms weighed on materials. Refiners and integrators were some of the drags on energy. Pharma and biotech were generally lower in healthcare. Utilities was the week’s big decliner.
Overall, it was a very uneventful week ahead of Monday’s Memorial Day holiday, with the headlines doing little to advance the narratives of greatest interest to the market. Indeed, the broader market has largely been in a holding pattern this month, with May’s absolute movement in the S&P 500 (up 0.55%) the lowest since January 2020 (when it was down just 0.16%). There was a dearth of catalysts, with Q1 earnings season effectively over, fiscal stimulus progress coming slowly, economic reopening and domestic Covid trends improving as expected, and concerns about the Fed tapering its asset-purchase program focused on the 16-Jun FOMC meeting.
Fed officials continued talking about talking about tapering. Fed officials this week continued musing about an eventual taper to the bank’s $120B/m asset-purchase plan. There was some minor progress on a bipartisan infrastructure plan this week, with GOP senators unveiling a $928B counterproposal to President Biden’s latest $1.7T offer. Biden said he would continue negotiating next week, beyond his original self-imposed deadline of Memorial Day. There were also headlines about another Republican “Plan B” in the works. But despite movement in the top line, expectations are limited given the parties still remain far apart on the pay-fors (with the GOP continuing to suggest EV user fees and unspent Covid relief funds, an approach the White House has rejected).
There was a mix of economic data this week, though nothing to greatly shift the narrative of a generally improving economy facing well-understood price and supply pressures. April new home sales and pending home sales were both light of consensus. April’s core PCE price index came in at 3.6%, ahead of forecasts and the highest level since June 2008. May consumer confidence was a bit light, but with another big gain in the labor market differential (jobs plentiful vs hard to get). Initial jobless claims posted another weekly drop, hitting their lowest level since mid-March 2020.
Table of Contents
Fixed Income
4/28/21 FOMC Statement FOMC Minutes Credit, Liquidity and Balance Sheet Federal Reserve Dot Plots
US Corporate Debt Tops 7 Trillion. Treasury.gov yields FOMC Policy Normalization Statement Longer Run Goals August 2020
Global Bond Yields
Daily US Treasury Yields
Foreign Exchange Market
Energy Complex
The Baker Hughes rig count gained 2 this week. There are 457 oil and gas rigs operating in the US – Up 156 over last year.
Metals Complex
Employment Picture
Weekly Unemployment Claims – Released Thursday 5/27/2021 – Initial jobless claims for the week ending May 22nd decreased 38k to 406k. The 4-week moving average was 459k, a decrease of 46k. This is the lowest level for this average since 3/14/2020 when the average was 225.5k.
Job Openings & Labor Turnover Survey JOLTS – Released 5/11/2021 – The U.S. Bureau of Labor Statistics reported the number and rate of job openings increased to 8.1 million on the last business day of March. Over the month, hires were little changed at 6.0 million and separations was little changed at 5.3 million. Within separations, the quits rate was unchanged at 2.4%. The layoffs and discharges rates decreased to 1.0%.
April Jobs Report – BLS Summary – Released 5/7/2021 – The US Economy added 266k nonfarm jobs in April and the Unemployment rate was little changed at 6.1%. Average hourly earnings increased by 21 cents to $30.17. Hiring highlights include +331k Leisure and Hospitality, +48k Government, -79k Professional and Business Services.
Economists noted the historic miss in payroll employment did not stem from technical issues such as seasonal adjustment and indicated that outside of leisure and hospitality, hiring all but stalled in April. The US economy still has 8.2M fewer jobs than Feb-20. However, the workweek and wages rose unexpectedly, which more than made up for the miss in hiring. As a result, private income growth appeared to pick up in April from the already strong pace seen last quarter. There were some indications that labor supply is adjusting, however. The labor force participation rate increased, signaling more workers made their services available during the month. Perhaps not surprisingly, the gains were made up largely by young people while older adults continued to stay away. One interpretation of today’s somewhat muddled report is that the economy is going through a short-term imbalance between labor demand and supply as Covid fears, lack of childcare, and generous fiscal support serve to delay workers from taking jobs. These impacts may diminish through the year, allowing further recovery in hiring. Input materials are another constraint which may be longer lived. For example, semiconductor shortages continued to weigh on automobile manufacturing in April.
Employment Cost Index – Released 4/30/2021 – Compensation costs for civilian workers increased 0.9% for the 3-month period ending in March 2021. The 12-month period ending in March 2021 saw compensation costs increase by 2.6%. The 12-month period ending March 2020 increased 2.8%. Wages and salaries increased 2.7 percent over the year and increased 3.1 percent for the 12-month period ending in March 2020. Benefit costs increased 2.5 percent over the year and increased 2.1 percent for the 12-month period ending in March 2020. This report is published quarterly.
This Week’s Economic Data
Links take you to the data source
Chicago PMI – Released 5/28/2021 – Chicago PMI increased to 75.2 points in May. This marks 11 consecutive months above the 50-mark following a full year under it. Among the main five indicators, New Orders and Order Backlogs saw the largest gains, while Employment recorded the only decline.
Personal Income – Released 5/28/2021 – Personal income decreased $3.21 trillion or 13.1 percent in April according to estimates released today by the Bureau of Economic Analysis. Disposable personal income (DPI) decreased $3.22 trillion or 14.6 percent and personal consumption expenditures (PCE) increased $80.3 billion or 0.5 percent.
Second Estimate of 1st Quarter 2021 GDP – Released 5/27/2021 – Real gross domestic product (GDP) increased at an annual rate of 6.4 percent in the first quarter of 2021, according to the second estimate released by the Bureau of Economic Analysis. The fourth quarter of 2020 saw an increase of 4.3 percent in real GDP. The increase in real GDP in the first quarter reflected increases in personal consumption expenditures (PCE), nonresidential fixed investment, federal government spending, residential fixed investment, and state and local government spending that were partly offset by decreases in private inventory investment and exports. Imports, which are a subtraction in the calculation of GDP, increased. The second estimate is based on more complete source data than were available for the “advance” estimate issued last month. In the advance estimate, the increase in real GDP was also 6.4 percent. Upward revisions to consumer spending and nonresidential fixed investment were offset by downward revisions to exports and private inventory investment. Imports, which are a subtraction in the calculation of GDP, were revised up
Durable Goods – Released 5/27/2021 – New orders for manufactured durable goods in April increased $3.2 billion or 1.3% to $246.2 billion. Transportation equipment led the decrease declining $4.9 billion or 6.7% to $68.9 billion.
Consumer Confidence – Released 5/25/2021 – The Consumer confidence index increased 11.7% in April following a sharp increase in March. The Index now shows its highest reading in a year of 121.7, up from 109.0 in March.
New Residential Sales – Released 5/25/2021 – Sales of new single-family homes decreased 5.9% to 863,000, seasonally adjusted, in April. The median sales price of new homes sold in April was $372,400 with an average sales price of $435,400. At the end of April, the seasonally adjusted estimate of new homes for sale was 316k. This represents a supply of 4.4 months at the current sales rate.
Recent Economic Data
Links take you to the data source
Existing Home Sales – Released 5/21/2021 – Existing home sales decreased in April following two months of declines. Sales decreased 2.7% to a seasonally adjusted rate of 5.85 million in April. Sales are currently up 33.9% from one year ago. Housing inventory sits at 1.16 million units. Up 10.5% from March’s inventory. Down 20.5% over last year. Unsold inventory sits at a 2.4-month supply. The median existing home price for all housing types was $341,600.
Housing Starts – Released 5/18/2021 – New home starts in April were at a seasonally adjusted annual rate of 1.569 million; down 9.5% below March, but 67.3% above last April’s rate. Building Permits were at a seasonally adjusted annual rate of 1.760 million, up 0.3% compared to March and up 60.9% over last year.
Retail Sales – Released 5/14/2021 – U.S. retail sales for April were nearly identical to the prior month at $619.9 billion. U.S. retail sales are up 51.2% year/y.
Industrial Production and Capacity Utilization – Released 5/14/2021 – In April Industrial production increased 0.7%. Mining increased 0.7%. Utilities output increased 2.6%. Total industrial production was 106.3% of its 2012 average which is 16.5% higher in April than a year ago, but still 2.7% below its pre-pandemic level. Total capacity utilization increased 0.5% to 74.9% in April which is 4.7% below its long run average.
Producer Price Index – Released 5/13/2021 – The Producer Price Index for final demand increased 0.6% in April. PPI less food and energy increased 1.0% in April.
Consumer Price Index – Released 5/12/2021 – The Consumer Price Index increased 0.8% in April. Core CPI, which excludes food and energy was up 0.9%. The monthly changes left total CPI up 4.2% year-over-year and core CPI up 3.0%.
Consumer Credit – Released 5/7/2021 – Consumer credit increased at a seasonally adjusted annual rate of 5.1 percent during the first quarter. Revolving credit increased at an annual rate of 2.4 percent, while nonrevolving credit increased at an annual rate of 5.9 percent. In March, consumer credit increased at an annual rate of 7.4 percent
PMI Non-Manufacturing Index – Released 5/5/2021 – Economic activity in the non-manufacturing sector grew in April for the 11th consecutive month. ISM Non-Manufacturing registered 62.7 percent, which is 1.0 percentage point below the adjusted March reading of 63.7 percent.
US Light Vehicle Sales – Released 5/5/2021 – U.S. light vehicle sales were at a seasonally adjusted annual rate (SAAR) of 18.507 million units in April.
U.S. Trade Balance – Released 5/4/2021 – According to the U.S. Census Bureau of Economic Analysis the goods and services deficit increased in March by $3.9 billion to $74.4 billion. March exports were $200.0 billion, $12.4 billion more than February exports. March imports were $274.5 billion, $16.4 billion more than February imports. Year to date the goods and services deficit increased $83.2 billion or 64.2%, from the same period in 2020. Year to date exports and imports decreased $21.0 billion or 3.5% and increased $62.2 billion or 8.5% respectively.
PMI Manufacturing Index – Released 5/3/2021 – April PMI declined 4.0% to 60.7% from March’s reading of 64.7%. The New Orders Index was down 3.7% from March’s reading of 68.0% to 64.3%. The Production Index registered 62.5%, down 5.6%.
U.S. Construction Spending – Released 5/3/2021 – Construction spending increased 0.2% in March measuring at a seasonally adjusted annual rate of $1,513.1 billion. The March figure is 5.3% above the March 2020 estimate. Private construction spending was 0.7% above the revised February estimate at $1,160.9 billion. Public construction spending was 1.5% below the revised February estimate at $343.9 billion.
Next week we get data on U.S. Construction Spending, PMI Manufacturing, PMI Services, and the May Jobs Report.
Data Sources:
Bureau of Economic Analysis (BEA)
Congressional Budget Office (CBO)
U.S. Bureau of Labor Statistics (BLS)
Federal Reserve Economic Data (FRED Charts)
CME Fed Watch
U.S. Treasury – Yields
U.S. Census Bureau
Institute for Supply Management (ISM)
Weekly DOL Employment Data
BLS Monthly Jobs Report
JOLTS
US Energy Admin (EIA)
BLS Consumer Price Index CPI
BLS Producer Price Index PPI
Atlanta Fed GDPNOW
NY Fed Nowcast GDP
US Census Bureau Housing Starts
Consumer Credit
USCB Retail Sales
Construction Spending
Federal Reserve Dot Plots
NY Empire Index
Philadelphia Federal Reserve
P/E Ratio Data -Yardeni Research
Technical Analysis Info:
StockCharts.com – Financial Charts
Exponential vs Simple moving average
Other Links:
1973 Arab Oil Embargo
Hunt Brothers Silver
Long-Term Capital bailout
Categories:
Tags: