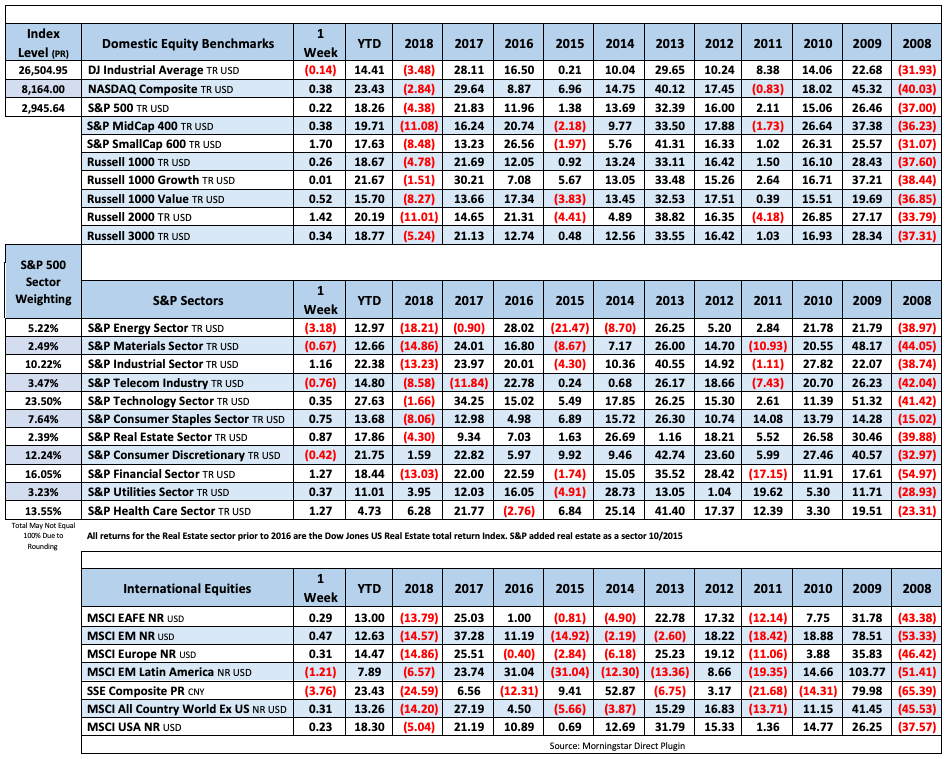
The S&P and Nasdaq both closed this week at new all-time highs while the Dow is still 320 points off its October high. Equity markets sold off mid-week after Fed chair Powell signaled that they would not be lowering rates. He attributed the recent weakening of the PCE index (the Feds preferred inflation gauge) to “transitory factors” and would need to see more downward pressure before taking any action to lower rates. You can read the Fed press release here or the Fed chairs own words where he discusses the “transitory” pressures here. The economic data releases this week were mixed, with declines in manufacturing PMI, construction spending, Chicago PMI and a weak personal income number. The week was saved by a stellar Jobs report showing the economy created 263k jobs in April and the unemployment rate fell to 3.6%, down from 3.8% in March.
In the week ahead, trade talks come front and center again as China’s vice premier will be in Washington for what could be the final round of negotiations. The Whitehouse has signaled that they would accept a watered-down security pledge in an attempt for a quick trade deal. The pace of earning report is slowing with 60 S&P500 companies reporting this week, including AIG, Anheuser-Busch Inbev, Honda, McKesson, Disney and Cardinal Health to name the biggies. We get more inflation data Thursday and Friday as the PPI and CPI number are released.
Fixed Income

FOMC March Statement Federal Reserve Dot Plots Dec 18 US Debt Measurement March Meeting Minutes US Corporate Debt Tops $6 Trillion Treasury.gov yields
FOMC Policy Normalization Statement
Global Bond Yields
Foreign Exchange Market
Energy Complex
The Baker Hughes rig count lost 1 this week. There are 990 oil and gas rigs operating in the US – Down 42 over last year.
- Brent Crude Oil lost 1.09% this week closing at $70.85/bbl
- WTI Crude Oil lost 2.15% this week to close at $61.94/bbl
- Heating Oil gained 0.88% this week closing at $2.07/gallon
- Natural Gas lost 0.50% this week closing at $2.57 per million BTUs
- Unleaded Gas lost 0.97% this week closing at $2.03/gallon
Metals Complex
- Gold lost 0.58% this week closing at $1281.30/oz
- Silver lost 0.18% on the week closing at $14.98/oz
- Palladium lost 6.16% this week closing at $1358.00/oz
- Platinum lost 3.19% this week closing at $874.80/oz
- Copper lost 2.59% this week closing at $2.82/lb
Employment Picture
April Jobs Report – BLS Summary – Released 5/3 – The US Economy added 263k nonfarm jobs in April and the Unemployment rate declined by 0.2% to 3.6%. Unemployment has reached its lowest level since December 1969. April’s 263k increase and March’s 189k increase in nonfarm jobs has stifled concerns over a recession and provided relief from concerns that had developed after February’s small 20k increase. The March report was revised down 7k. Average hourly earnings increased by 4 cents. Hiring highlights include Education and Health Services +62k, Professional and Business Services +76k, Leisure and Hospitality +34k, Construction +33k, and Retail Trade -12k.
- Average hourly earnings increased by 6 cents/ 0.22% in April y/y hourly earnings are up 3.2%.
- U3 unemployment declined by 0.2% to 3.6%. U6 unemployment rate also held steady at 7.3%.
- The labor force participation rate declined slightly by 0.2% to 62.8% (Unchanged year to year).
- Average workweek decreased slightly by 0.1 hours to 34.4 hours.
Weekly Unemployment Claims – Released Thursday 5/2 – In the week ending April 27th, initial claims were 230,000 unchanged from the previous week’s unrevised level. The 4-week moving average was 212,500, an increase of 6,500 from the previous week’s unrevised average.
Employment Cost Index – Released 4/30/19 – Compensation costs for civilian workers increased 0.7% for the 3-month period ending in March 2019. The 12 month period ending in March 2019 saw compensation costs increase by 2.8% versus 2.7% in March 2018. Wages and salaries were up 2.9% for the 12-month period ending March 2019, versus 2.7% for the 12-month period ending March 2018. Benefit costs increased 2.6% for the 12-month period ending March 2019. For private industry workers, compensation costs increased 2.8% year-over-year, versus 2.8% for the 12 months ending March 2018. Wages and salaries increased 3.0% year-over-year, versus 2.9% for the 12 months ending March 2018. Benefit costs increased by 2.4%, versus 2.5% for the 12 months ending March 2018. This report is published quarterly.
Job Openings & Labor Turnover Survey JOLTS – Released Tuesday 4/9 – The U.S. Bureau of Labor Statistics reported the number of job openings declined from 7.6 million to 7.1 million on the last business day of February. Over the month, hires and separations were little changed at 5.7 million and 5.6 million, respectively. Within separations, the quits rate remained unchanged at 2.3% at a level of 3.5 million. The layoffs and discharges rates were little changed at 1.2%.
This Week’s Economic Data
Links take you to the data source
PMI Non-Manufacturing Index (ISM Services) – Released 5/3 – Economic activity in the non-manufacturing sector grew in April for the 11th consecutive month. ISM Non-Manufacturing registered 55.5 percent, which is 0.6 percentage points lower than the March reading of 56.1 percent. This represents continued growth in the non-manufacturing sector, at a slightly slower rate.
PMI Manufacturing ISM Index – Released 5/1 – April PMI decreased 2.5% to 52.8% from March’s reading of 55.3%. The New Orders Index was down 5.7% from March’s reading of 57.4% to 51.7% for April. The Production Index registered 52.3% down 3.5%.
U.S. Construction Spending – Released 5/1 – Construction spending declined by 0.9% in March measuring at a seasonally adjusted annual rate of $1,282.2 billion. The March figure is 0.8% below the March 2018 estimate. Private construction spending was 0.7% below the revised February estimate at $961.5 billion. Public construction spending was 1.3% below the revised February estimate at $324.7 billion.
Chicago PMI – Released 4/30 – Chicago PMI declined by 6.1 points in April falling to 52.6, down from 58.7 in March. This marks the lowest level since January 2017. Factory gate prices declined dramatically reaching the lowest level since March 2016 and experiencing the largest decline for the indicator since December 2008. Most Barometer components have dived below their respective 12-month averages, pointing towards greater business uncertainty among firms. Four of five barometer components declined with only order backlogs increasing on the previous month’s reading. A unsatisfying start to the second quarter with more firms cutting back on both production and employment.
Consumer Confidence – Released 4/30 – The Consumer confidence index increased in April after declining in March. The Index now shows a reading of 129.2 up from 124.2 in March. In recent months worries of a global economic slowdown have moderated consumer confidence, but confidence levels rebounded in April. Consumer confidence levels suggest consumers expect the economy to continue to expand at a solid pace into the summer months supporting consumer spending in the near term. Consumers continue to view both business and labor market conditions favorably.
Personal Income – Released 4/29 – Personal Income increased 0.1% in March after seeing a 0.2% increase in February according to the BEA. The majority of the increase in March was due to increases in compensation of employees and government social benefits. The increase was partially offset by decreases in personal interest income and farm proprietor’s income. Real PCE (the Feds preferred inflation gauge) increased 0.7% in March. Real disposable personal income decreased 0.2% in March.
Recent Economic Data
Links take you to the data source
Advance Estimate of 1st Quarter GDP – Released 4/26 – According to the advance estimate released by the Bureau of Economic Analysis, Real Gross Domestic Product (Real GDP) increased at an annual rate of 3.2% in the first quarter of 2019. The advance estimate is based on source data that is either incomplete or subject to further review. The first quarter increase in real GDP observed positive contributions from personal consumption expenditures (PCE), private industry investment, exports, accelerations in state and local gov’t spending, and nonresidential fixed income. Also, imports decreased in the first quarter further increasing gains to real GDP. Positive contributions were partly offset by a decrease in residential investment. A second estimate for first quarter GDP growth will be released on May 30, 2019.
Durable Goods – Released 4/25 – New orders for manufactured durable goods increased $6.8 billion or 2.7% to $258.5 billion in March. The increase in March follows a 1.1% decline in February, but four of the last five months have seen new orders increases. Transportation equipment, up 7.0%, drove the increase by $6.1 billion to $93.8 billion.
New Residential Sales – Released 4/23 – Sales of new single-family homes increased 4.5% to 692k, seasonally adjusted, in March. The median sales price of new homes sold in March was $302.7k with an average sales price of $376k. At the end of March, the seasonally adjusted estimate of new homes for sale was 344k. This represents a supply of 6.0 months at the current sales rate.
Existing Home Sales – Released 4/22 – Existing home sales declined by 4.9% in March. Sales declined to a seasonally adjusted rate of 5.21 million. Sales are currently down 5.4% from one year ago. Housing inventory increased to 3.9 months of inventory and the existing homes for sale increased to 1.68 million. The median sales price for all types of homes was $259,400, up 3.8% year/y.
Housing Starts – Released 4/19 – New home starts in March were at a seasonally adjusted rate of 1.139 million; down 0.3% below February and 14.2% below last March’s rate. Building Permits were at a seasonally adjusted rate of 1.269 million, down 1.7% compared to February and down 7.8% over last year.
Retail Sales – Released 4/18 – U.S. retail sales for March 2019, were $514.1 billion, an increase of 1.6% from the previous month. Retail sales are up 3.6% year to year.
U.S. Trade Balance – Released 4/17 – The U.S. Trade deficit was $49.4 billion in February, down $1.8 billion from $51.1 billion in January. February exports were $209.7 billion, $2.3 billion more than January exports. February imports were $259.1 billion, $0.6 billion more than January imports. The goods and services deficit decreased $8.3 billion year to date. Year to date exports and imports increased $11.1 billion or 2.7% and $2.8 billion or 0.5% respectively.
Industrial Production and Capacity Utilization – Released 4/16 – Industrial production declined slightly down 0.1% in March following a 0.1% increase in February. Manufacturing output was unchanged for March following two months of decline. Capacity utilization declined 0.2% to 78.8%. Utilization is 1.0% below its long-run (1972-2018) average.
Producer Price Index – Released 4/11– The Producer Price Index for final demand increased 0.6% in March. Core PPI (less food and energy) increased by 0.2%. Year over year the index for final demand rose 2.2%.
Consumer Price Index – Released 4/10 – The Consumer Price Index increased by 0.4% in March. Core CPI, which excludes food and energy increased 0.1%. The monthly changes left total CPI up 1.9% year-over-year and core CPI up 2.0%.
Consumer Credit – Released 4/5 – Consumer credit increased at a seasonally adjusted annual rate of 4.5% in February. Revolving and nonrevolving credit increased by 3.25% and 5.0% respectively. Total Outstanding consumer credit is currently at $4.046 trillion.
US Light Vehicle Sales – Released 4/3 – U.S. light vehicle sales were at a seasonally adjusted annual rate (SAAR) of 18.01 million units in March versus a SAAR of 17.04 million units in February. The March run rate was up 1.7% from the SAAR of 17.71 million units for March 2018.
Next week we get data on Consumer Credit, JOLTS, the Consumer Price Index, the Producer Price Index, and the U.S. Trade Balance.
Data Sources:
Bureau of Economic Analysis (BEA)
Congressional Budget Office (CBO)
U.S. Bureau of Labor Statistics (BLS)
Federal Reserve Economic Data (FRED Charts)
CME Fed Watch
U.S. Treasury – Yields
U.S. Census Bureau
Institute for Supply Management (ISM)
Weekly DOL Employment Data
BLS Monthly Jobs Report
JOLTS
US Energy Admin (EIA)
BLS Consumer Price Index CPI
BLS Producer Price Index PPI
Atlanta Fed GDPNOW
NY Fed Nowcast GDP
US Census Bureau Housing Starts
Consumer Credit
USCB Retail Sales
Construction Spending
Federal Reserve Dot Plots
NY Empire Index
Philadelphia Federal Reserve
P/E Ratio Data -Yardeni Research
Technical Analysis Info:
StockCharts.com – Financial Charts
Exponential vs Simple moving average
Other Links:
1973 Arab Oil Embargo
Hunt Brothers Silver
Long-Term Capital bailout


Week 18 Talking Points #14
The S&P and Nasdaq both closed this week at new all-time highs while the Dow is still 320 points off its October high. Equity markets sold off mid-week after Fed chair Powell signaled that they would not be lowering rates. He attributed the recent weakening of the PCE index (the Feds preferred inflation gauge) to “transitory factors” and would need to see more downward pressure before taking any action to lower rates. You can read the Fed press release here or the Fed chairs own words where he discusses the “transitory” pressures here. The economic data releases this week were mixed, with declines in manufacturing PMI, construction spending, Chicago PMI and a weak personal income number. The week was saved by a stellar Jobs report showing the economy created 263k jobs in April and the unemployment rate fell to 3.6%, down from 3.8% in March.
In the week ahead, trade talks come front and center again as China’s vice premier will be in Washington for what could be the final round of negotiations. The Whitehouse has signaled that they would accept a watered-down security pledge in an attempt for a quick trade deal. The pace of earning report is slowing with 60 S&P500 companies reporting this week, including AIG, Anheuser-Busch Inbev, Honda, McKesson, Disney and Cardinal Health to name the biggies. We get more inflation data Thursday and Friday as the PPI and CPI number are released.
Table of Contents
Fixed Income
FOMC March Statement Federal Reserve Dot Plots Dec 18 US Debt Measurement March Meeting Minutes US Corporate Debt Tops $6 Trillion Treasury.gov yields
FOMC Policy Normalization Statement
Global Bond Yields
Foreign Exchange Market
Energy Complex
The Baker Hughes rig count lost 1 this week. There are 990 oil and gas rigs operating in the US – Down 42 over last year.
Metals Complex
Employment Picture
April Jobs Report – BLS Summary – Released 5/3 – The US Economy added 263k nonfarm jobs in April and the Unemployment rate declined by 0.2% to 3.6%. Unemployment has reached its lowest level since December 1969. April’s 263k increase and March’s 189k increase in nonfarm jobs has stifled concerns over a recession and provided relief from concerns that had developed after February’s small 20k increase. The March report was revised down 7k. Average hourly earnings increased by 4 cents. Hiring highlights include Education and Health Services +62k, Professional and Business Services +76k, Leisure and Hospitality +34k, Construction +33k, and Retail Trade -12k.
Weekly Unemployment Claims – Released Thursday 5/2 – In the week ending April 27th, initial claims were 230,000 unchanged from the previous week’s unrevised level. The 4-week moving average was 212,500, an increase of 6,500 from the previous week’s unrevised average.
Employment Cost Index – Released 4/30/19 – Compensation costs for civilian workers increased 0.7% for the 3-month period ending in March 2019. The 12 month period ending in March 2019 saw compensation costs increase by 2.8% versus 2.7% in March 2018. Wages and salaries were up 2.9% for the 12-month period ending March 2019, versus 2.7% for the 12-month period ending March 2018. Benefit costs increased 2.6% for the 12-month period ending March 2019. For private industry workers, compensation costs increased 2.8% year-over-year, versus 2.8% for the 12 months ending March 2018. Wages and salaries increased 3.0% year-over-year, versus 2.9% for the 12 months ending March 2018. Benefit costs increased by 2.4%, versus 2.5% for the 12 months ending March 2018. This report is published quarterly.
Job Openings & Labor Turnover Survey JOLTS – Released Tuesday 4/9 – The U.S. Bureau of Labor Statistics reported the number of job openings declined from 7.6 million to 7.1 million on the last business day of February. Over the month, hires and separations were little changed at 5.7 million and 5.6 million, respectively. Within separations, the quits rate remained unchanged at 2.3% at a level of 3.5 million. The layoffs and discharges rates were little changed at 1.2%.
This Week’s Economic Data
Links take you to the data source
PMI Non-Manufacturing Index (ISM Services) – Released 5/3 – Economic activity in the non-manufacturing sector grew in April for the 11th consecutive month. ISM Non-Manufacturing registered 55.5 percent, which is 0.6 percentage points lower than the March reading of 56.1 percent. This represents continued growth in the non-manufacturing sector, at a slightly slower rate.
PMI Manufacturing ISM Index – Released 5/1 – April PMI decreased 2.5% to 52.8% from March’s reading of 55.3%. The New Orders Index was down 5.7% from March’s reading of 57.4% to 51.7% for April. The Production Index registered 52.3% down 3.5%.
U.S. Construction Spending – Released 5/1 – Construction spending declined by 0.9% in March measuring at a seasonally adjusted annual rate of $1,282.2 billion. The March figure is 0.8% below the March 2018 estimate. Private construction spending was 0.7% below the revised February estimate at $961.5 billion. Public construction spending was 1.3% below the revised February estimate at $324.7 billion.
Chicago PMI – Released 4/30 – Chicago PMI declined by 6.1 points in April falling to 52.6, down from 58.7 in March. This marks the lowest level since January 2017. Factory gate prices declined dramatically reaching the lowest level since March 2016 and experiencing the largest decline for the indicator since December 2008. Most Barometer components have dived below their respective 12-month averages, pointing towards greater business uncertainty among firms. Four of five barometer components declined with only order backlogs increasing on the previous month’s reading. A unsatisfying start to the second quarter with more firms cutting back on both production and employment.
Consumer Confidence – Released 4/30 – The Consumer confidence index increased in April after declining in March. The Index now shows a reading of 129.2 up from 124.2 in March. In recent months worries of a global economic slowdown have moderated consumer confidence, but confidence levels rebounded in April. Consumer confidence levels suggest consumers expect the economy to continue to expand at a solid pace into the summer months supporting consumer spending in the near term. Consumers continue to view both business and labor market conditions favorably.
Personal Income – Released 4/29 – Personal Income increased 0.1% in March after seeing a 0.2% increase in February according to the BEA. The majority of the increase in March was due to increases in compensation of employees and government social benefits. The increase was partially offset by decreases in personal interest income and farm proprietor’s income. Real PCE (the Feds preferred inflation gauge) increased 0.7% in March. Real disposable personal income decreased 0.2% in March.
Recent Economic Data
Links take you to the data source
Advance Estimate of 1st Quarter GDP – Released 4/26 – According to the advance estimate released by the Bureau of Economic Analysis, Real Gross Domestic Product (Real GDP) increased at an annual rate of 3.2% in the first quarter of 2019. The advance estimate is based on source data that is either incomplete or subject to further review. The first quarter increase in real GDP observed positive contributions from personal consumption expenditures (PCE), private industry investment, exports, accelerations in state and local gov’t spending, and nonresidential fixed income. Also, imports decreased in the first quarter further increasing gains to real GDP. Positive contributions were partly offset by a decrease in residential investment. A second estimate for first quarter GDP growth will be released on May 30, 2019.
Durable Goods – Released 4/25 – New orders for manufactured durable goods increased $6.8 billion or 2.7% to $258.5 billion in March. The increase in March follows a 1.1% decline in February, but four of the last five months have seen new orders increases. Transportation equipment, up 7.0%, drove the increase by $6.1 billion to $93.8 billion.
New Residential Sales – Released 4/23 – Sales of new single-family homes increased 4.5% to 692k, seasonally adjusted, in March. The median sales price of new homes sold in March was $302.7k with an average sales price of $376k. At the end of March, the seasonally adjusted estimate of new homes for sale was 344k. This represents a supply of 6.0 months at the current sales rate.
Existing Home Sales – Released 4/22 – Existing home sales declined by 4.9% in March. Sales declined to a seasonally adjusted rate of 5.21 million. Sales are currently down 5.4% from one year ago. Housing inventory increased to 3.9 months of inventory and the existing homes for sale increased to 1.68 million. The median sales price for all types of homes was $259,400, up 3.8% year/y.
Housing Starts – Released 4/19 – New home starts in March were at a seasonally adjusted rate of 1.139 million; down 0.3% below February and 14.2% below last March’s rate. Building Permits were at a seasonally adjusted rate of 1.269 million, down 1.7% compared to February and down 7.8% over last year.
Retail Sales – Released 4/18 – U.S. retail sales for March 2019, were $514.1 billion, an increase of 1.6% from the previous month. Retail sales are up 3.6% year to year.
U.S. Trade Balance – Released 4/17 – The U.S. Trade deficit was $49.4 billion in February, down $1.8 billion from $51.1 billion in January. February exports were $209.7 billion, $2.3 billion more than January exports. February imports were $259.1 billion, $0.6 billion more than January imports. The goods and services deficit decreased $8.3 billion year to date. Year to date exports and imports increased $11.1 billion or 2.7% and $2.8 billion or 0.5% respectively.
Industrial Production and Capacity Utilization – Released 4/16 – Industrial production declined slightly down 0.1% in March following a 0.1% increase in February. Manufacturing output was unchanged for March following two months of decline. Capacity utilization declined 0.2% to 78.8%. Utilization is 1.0% below its long-run (1972-2018) average.
Producer Price Index – Released 4/11– The Producer Price Index for final demand increased 0.6% in March. Core PPI (less food and energy) increased by 0.2%. Year over year the index for final demand rose 2.2%.
Consumer Price Index – Released 4/10 – The Consumer Price Index increased by 0.4% in March. Core CPI, which excludes food and energy increased 0.1%. The monthly changes left total CPI up 1.9% year-over-year and core CPI up 2.0%.
Consumer Credit – Released 4/5 – Consumer credit increased at a seasonally adjusted annual rate of 4.5% in February. Revolving and nonrevolving credit increased by 3.25% and 5.0% respectively. Total Outstanding consumer credit is currently at $4.046 trillion.
US Light Vehicle Sales – Released 4/3 – U.S. light vehicle sales were at a seasonally adjusted annual rate (SAAR) of 18.01 million units in March versus a SAAR of 17.04 million units in February. The March run rate was up 1.7% from the SAAR of 17.71 million units for March 2018.
Next week we get data on Consumer Credit, JOLTS, the Consumer Price Index, the Producer Price Index, and the U.S. Trade Balance.
Data Sources:
Bureau of Economic Analysis (BEA)
Congressional Budget Office (CBO)
U.S. Bureau of Labor Statistics (BLS)
Federal Reserve Economic Data (FRED Charts)
CME Fed Watch
U.S. Treasury – Yields
U.S. Census Bureau
Institute for Supply Management (ISM)
Weekly DOL Employment Data
BLS Monthly Jobs Report
JOLTS
US Energy Admin (EIA)
BLS Consumer Price Index CPI
BLS Producer Price Index PPI
Atlanta Fed GDPNOW
NY Fed Nowcast GDP
US Census Bureau Housing Starts
Consumer Credit
USCB Retail Sales
Construction Spending
Federal Reserve Dot Plots
NY Empire Index
Philadelphia Federal Reserve
P/E Ratio Data -Yardeni Research
Technical Analysis Info:
StockCharts.com – Financial Charts
Exponential vs Simple moving average
Other Links:
1973 Arab Oil Embargo
Hunt Brothers Silver
Long-Term Capital bailout
Categories:
Tags: