Disappointing earnings from 3M, Intel and Exxon Mobil left the Dow in negative territory but upbeat guidance from Microsoft, Facebook and Amazon drove the Nasdaq and the S&P 500 to new all-time closing highs on Friday. U.S. economic data this week showed healthy pickups in new home sales and durable goods orders for March. The advance estimate for first quarter GDP also topped expectations, increasing 3.2%. Upbeat data, tame inflation, and strong earnings results from mega-cap companies helped contribute to gains in most sectors. The health care sector (+3.7%) led the pace, bouncing back from last week’s 4.4% decline.
The narrative overseas, however, remains gloomy. 3M and Intel each called attention to a slowdown in demand from China while foreign economic data corroborated slowing growth expectations. South Korea’s first quarter GDP contracted by 0.3%, and Germany’s Business Climate Index remained on the decline. The Bank of Japan also expects rates to be kept at extremely low levels until at least the spring of 2020.
Oil prices started the week on a higher note after the U.S. decided to end its waivers for countries to import oil from Iran. Prices reeled in following President Trump telling OPEC to keep fuel costs down on Friday.
U.S. Treasuries finished higher in a curve-steepening trade, driven by muted inflation and dovish monetary policy from central banks. The U.S. Dollar Index rose 0.6% to 98.03
Ahead this week – On Friday we will see US payroll numbers.
This Wednesday the Emperor of Japan will abdicate the throne. The country is taking an unprecedented 10-day holiday to celebrate the new emperor which could possibly result in a services slowdown there. Monday and Tuesday the Federal Reserve holds its next scheduled meeting. The CME FedWatch Tool shows a 97% of no move either way. Some big earnings coming this week – we will hear from Alphabet, Apple, GM, GE, BP, CVS, Royal Dutch Shell, Met Life, Fiat Chrysler, and DowDuPont just to name a few of the largest.

Fixed Income
FOMC March Statement Federal Reserve Dot Plots Dec 18 US Debt Measurement March Meeting Minutes US Corporate Debt Tops $6 Trillion
Global Bond Yields
Foreign Exchange Market
Energy Complex
The Baker Hughes rig count lost 21 this week. There are 991 oil and gas rigs operating in the US – down 30 over last year.
- Brent Crude Oil lost 0.47% this week closing at $71.63/bbl
- WTI Crude Oil lost 1.20% this week to close at $63.30/bbl
- Heating Oil lost 1.05% this week closing at $2.05/gallon
- Natural Gas gained 3.61% this week closing at $2.58 per million BTUs
- Unleaded Gas gained 0.68% this week closing at $2.05/gallon
Metals Complex
- Gold gained 1.00% this week closing at $1288.80/oz
- Silver gained 0.33% on the week closing at $15.01/oz
- Palladium gained 3.48% this week closing at $1447.20/oz
- Platinum lost 0.01% this week closing at $903.60/oz
- Copper lost 0.89% this week closing at $2.89/lb
Employment Picture
Weekly Unemployment Claims – Released Thursday 4/25 – In the week ending April 20th, initial claims were 230,000 an increase of 37,000 from the previous week’s revised level. The 4-week moving average was 206,000, an increase of 4,500 from the previous week’s revised average.
Job Openings & Labor Turnover Survey JOLTS – Released Tuesday 4/9 – The U.S. Bureau of Labor Statistics reported the number of job openings declined from 7.6 million to 7.1 million on the last business day of February. Over the month, hires and separations were little changed at 5.7 million and 5.6 million, respectively. Within separations, the quits rate remained unchanged at 2.3% at a level of 3.5 million. The layoffs and discharges rates were little changed at 1.2%.
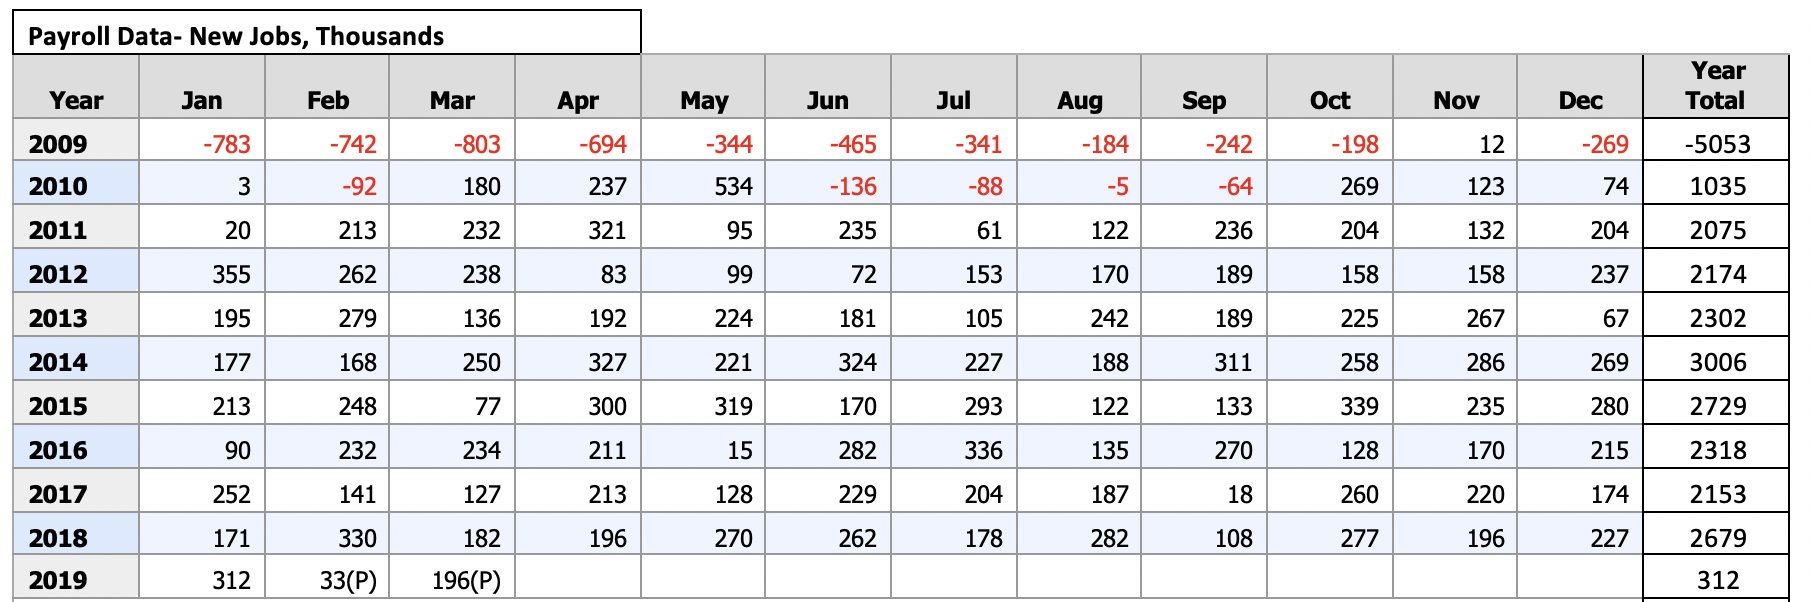
March Jobs Report – BLS Summary – Released 4/5 – The US Economy added 196k nonfarm jobs in March and the Unemployment rate remained at 3.8%. March’s 196k increase in nonfarm jobs has stifled concerns over a recession and provided relief from concerns that had developed after February’s small 20k increase. The February report was revised up 13k. Average hourly earnings increased by 4 cents. Hiring highlights include Education and Health Services +70k, Professional and Business Services +37k, Leisure and Hospitality +33k, and Retail Trade -12k.
- Average hourly earnings increased by 4 cents/ 0.14% in March y/y hourly earnings are up 3.2%.
- U3 unemployment held steady at 3.8%. U6 unemployment rate also held steady at 7.3%.
- The labor force participation rate declined slightly by 0.2% to 63.0%.
- Average workweek increased slightly by 0.1 hour to 34.5 hours.
Employment Cost Index – Released 1/31/19 – Compensation costs for civilian workers increased by 2.9% for the 12-month period ending in December 2018 compared with a compensation costs increase of 2.6% in December 2017. Wages and salaries were up 3.1%, versus 2.5% for the 12-month period ending December 2017. Benefit costs increased by 2.8%, versus 2.5% in December 2017. For private industry workers, compensation costs increased 3.0% year-over-year, versus 2.6% for the 12 months ending December 2017. Wages and salaries increased 3.1% year-over-year, versus 2.8% for the 12 months ending December 2017. Benefit costs increased by 2.6%, versus 2.3% for the 12 months ending December 2017. This report is published quarterly.
This Week’s Economic Data
Links take you to the data source
Advance Estimate of 1st Quarter GDP – Released 4/26 – According to the advance estimate released by the Bureau of Economic Analysis, Real Gross Domestic Product (Real GDP) increased at an annual rate of 3.2% in the first quarter of 2019. The advance estimate is based on source data that is either incomplete or subject to further review. The first quarter increase in real GDP observed positive contributions from personal consumption expenditures (PCE), private industry investment, exports, accelerations in state and local gov’t spending, and nonresidential fixed income. Also, imports decreased in the first quarter further increasing gains to real GDP. Positive contributions were partly offset by a decrease in residential investment. A second estimate for first quarter GDP growth will be released on May 30, 2019.
Durable Goods – Released 4/25 – New orders for manufactured durable goods increased $6.8 billion or 2.7% to $258.5 billion in March. The increase in March follows a 1.1% decline in February, but four of the last five months have seen new orders increases. Transportation equipment, up 7.0%, drove the increase by $6.1 billion to $93.8 billion.
New Residential Sales – Released 4/23 – Sales of new single-family homes increased 4.5% to 692k, seasonally adjusted, in March. The median sales price of new homes sold in March was $302.7k with an average sales price of $376k. At the end of March, the seasonally adjusted estimate of new homes for sale was 344k. This represents a supply of 6.0 months at the current sales rate.
Existing Home Sales – Released 4/22 – Existing home sales declined by 4.9% in March. Sales declined to a seasonally adjusted rate of 5.21 million. Sales are currently down 5.4% from one year ago. Housing inventory increased to 3.9 months of inventory and the existing homes for sale increased to 1.68 million. The median sales price for all types of homes was $259,400, up 3.8% year/y.
Recent Economic Data
Links take you to the data source
Housing Starts – Released 4/19 – New home starts in March were at a seasonally adjusted rate of 1.139 million; down 0.3% below February and 14.2% below last March’s rate. Building Permits were at a seasonally adjusted rate of 1.269 million, down 1.7% compared to February and down 7.8% over last year.
Retail Sales – Released 4/18 – U.S. retail sales for March 2019, were $514.1 billion, an increase of 1.6% from the previous month. Retail sales are up 3.6% year to year.
U.S. Trade Balance – Released 4/17 – The U.S. Trade deficit was $49.4 billion in February, down $1.8 billion from $51.1 billion in January. February exports were $209.7 billion, $2.3 billion more than January exports. February imports were $259.1 billion, $0.6 billion more than January imports. The goods and services deficit decreased $8.3 billion year to date. Year to date exports and imports increased $11.1 billion or 2.7% and $2.8 billion or 0.5% respectively.
Industrial Production and Capacity Utilization – Released 4/16 – Industrial production declined slightly down 0.1% in March following a 0.1% increase in February. Manufacturing output was unchanged for March following two months of decline. Capacity utilization declined 0.2% to 78.8%. Utilization is 1.0% below its long-run (1972-2018) average.
Producer Price Index – Released 4/11 – The Producer Price Index for final demand increased 0.6% in March. Core PPI (less food and energy) increased by 0.2%. Year over year the index for final demand rose 2.2%.
Consumer Price Index – Released 4/10 – The Consumer Price Index increased by 0.4% in March. Core CPI, which excludes food and energy increased 0.1%. The monthly changes left total CPI up 1.9% year-over-year and core CPI up 2.0%.
Consumer Credit – Released 4/5 – Consumer credit increased at a seasonally adjusted annual rate of 4.5% in February. Revolving and nonrevolving credit increased by 3.25% and 5.0% respectively. Total Outstanding consumer credit is currently at $4.046 trillion.
US Light Vehicle Sales – Released 4/3 – U.S. light vehicle sales were at a seasonally adjusted annual rate (SAAR) of 18.01 million units in March versus a SAAR of 17.04 million units in February. The March run rate was up 1.7% from the SAAR of 17.71 million units for March 2018.
PMI Non-Manufacturing Index (ISM Services) – Released 4/3 – Economic activity in the non-manufacturing sector grew in March for the 110th consecutive month. ISM Non-Manufacturing registered 56.1 percent, which is 3.6 percentage points lower than the February reading of 59.7 percent. This represents continued growth in the non-manufacturing sector, at a slower rate.
PMI Manufacturing ISM Index – Released 4/1 – March PMI increased 1.1% to 55.3% from February’s reading of 54.2%. The New Orders Index was up 1.9% from February’s reading of 55.5% to 57.4% for March. The Production Index registered 55.8% up 1.0%.
U.S. Construction Spending – Released 4/1 – Construction spending increased by 1.0% in February measuring at a seasonally adjusted annual rate of $1,320.3 billion. The February figure is 1.1% above the February 2018 estimate. Private construction spending was 0.2% above the revised January estimate at $994.5 billion.
Personal Income – Released 3/29 – Personal Income increased 0.2% in February after seeing a 0.1% decline in January according to the BEA. The majority of the increase in February was due to increases in wages and salaries, government social benefits, and proprietor’s income. The decrease in January was primarily reflected by decreases in personal dividend income, farm proprietors’ income, and personal interest income. Real PCE (the Feds preferred inflation gauge) increased 0.1% in January. Real disposable personal income decreased 0.2% for January.
Chicago PMI – Released 3/29 – Chicago PMI declined by 6 points in March falling to 58.7, down from 64.7 in February. The Prices Paid indicator experienced its biggest decline in the past 17 months hitting its lowest level since August 2017. Although the Chicago Business Barometer has remained above the 50 – neutral level for more than two years, survey evidence suggests a slight slowdown since last year.
Consumer Confidence – Released 3/26 – The Consumer confidence index declined in March. The Index now shows a reading of 124.1 down from 131.4 in February. Expectations in recent months had declined due to financial market volatility, the government shutdown, and a poor Jobs report in February. Worries of a global economic slowdown have moderated consumer confidence. Consumer confidence levels suggest consumers still expect the economy to continue to expand as consumers continue to view both business and labor market conditions favorably. The pace of expansion of the economy is expected to moderate in 2019 however; especially as confidence softens.
Next week we get data on Consumer Confidence, Chicago PMI, Personal Income, U.S. Construction Spending, the PMI Manufacturing ISM Index, ISM Services, The April Jobs Report, and the Employment Cost Index.
Data Sources:
Bureau of Economic Analysis (BEA)
Congressional Budget Office (CBO)
U.S. Bureau of Labor Statistics (BLS)
Federal Reserve Economic Data (FRED Charts)
CME Fed Watch
U.S. Treasury – Yields
U.S. Census Bureau
Institute for Supply Management (ISM)
Weekly DOL Employment Data
BLS Monthly Jobs Report
JOLTS
US Energy Admin (EIA)
BLS Consumer Price Index CPI
BLS Producer Price Index PPI
Atlanta Fed GDPNOW
NY Fed Nowcast GDP
US Census Bureau Housing Starts
Consumer Credit
USCB Retail Sales
Construction Spending
Federal Reserve Dot Plots
NY Empire Index
Philadelphia Federal Reserve
P/E Ratio Data -Yardeni Research
Technical Analysis Info:
StockCharts.com – Financial Charts
Exponential vs Simple moving average
Other Links:
1973 Arab Oil Embargo
Hunt Brothers Silver
Long-Term Capital bailout


Week 17 Talking Points #13
Disappointing earnings from 3M, Intel and Exxon Mobil left the Dow in negative territory but upbeat guidance from Microsoft, Facebook and Amazon drove the Nasdaq and the S&P 500 to new all-time closing highs on Friday. U.S. economic data this week showed healthy pickups in new home sales and durable goods orders for March. The advance estimate for first quarter GDP also topped expectations, increasing 3.2%. Upbeat data, tame inflation, and strong earnings results from mega-cap companies helped contribute to gains in most sectors. The health care sector (+3.7%) led the pace, bouncing back from last week’s 4.4% decline.
The narrative overseas, however, remains gloomy. 3M and Intel each called attention to a slowdown in demand from China while foreign economic data corroborated slowing growth expectations. South Korea’s first quarter GDP contracted by 0.3%, and Germany’s Business Climate Index remained on the decline. The Bank of Japan also expects rates to be kept at extremely low levels until at least the spring of 2020.
Oil prices started the week on a higher note after the U.S. decided to end its waivers for countries to import oil from Iran. Prices reeled in following President Trump telling OPEC to keep fuel costs down on Friday.
U.S. Treasuries finished higher in a curve-steepening trade, driven by muted inflation and dovish monetary policy from central banks. The U.S. Dollar Index rose 0.6% to 98.03
Ahead this week – On Friday we will see US payroll numbers.
This Wednesday the Emperor of Japan will abdicate the throne. The country is taking an unprecedented 10-day holiday to celebrate the new emperor which could possibly result in a services slowdown there. Monday and Tuesday the Federal Reserve holds its next scheduled meeting. The CME FedWatch Tool shows a 97% of no move either way. Some big earnings coming this week – we will hear from Alphabet, Apple, GM, GE, BP, CVS, Royal Dutch Shell, Met Life, Fiat Chrysler, and DowDuPont just to name a few of the largest.
Table of Contents
Fixed Income
FOMC March Statement Federal Reserve Dot Plots Dec 18 US Debt Measurement March Meeting Minutes US Corporate Debt Tops $6 Trillion
Global Bond Yields
Foreign Exchange Market
Energy Complex
The Baker Hughes rig count lost 21 this week. There are 991 oil and gas rigs operating in the US – down 30 over last year.
Metals Complex
Employment Picture
Weekly Unemployment Claims – Released Thursday 4/25 – In the week ending April 20th, initial claims were 230,000 an increase of 37,000 from the previous week’s revised level. The 4-week moving average was 206,000, an increase of 4,500 from the previous week’s revised average.
Job Openings & Labor Turnover Survey JOLTS – Released Tuesday 4/9 – The U.S. Bureau of Labor Statistics reported the number of job openings declined from 7.6 million to 7.1 million on the last business day of February. Over the month, hires and separations were little changed at 5.7 million and 5.6 million, respectively. Within separations, the quits rate remained unchanged at 2.3% at a level of 3.5 million. The layoffs and discharges rates were little changed at 1.2%.
March Jobs Report – BLS Summary – Released 4/5 – The US Economy added 196k nonfarm jobs in March and the Unemployment rate remained at 3.8%. March’s 196k increase in nonfarm jobs has stifled concerns over a recession and provided relief from concerns that had developed after February’s small 20k increase. The February report was revised up 13k. Average hourly earnings increased by 4 cents. Hiring highlights include Education and Health Services +70k, Professional and Business Services +37k, Leisure and Hospitality +33k, and Retail Trade -12k.
Employment Cost Index – Released 1/31/19 – Compensation costs for civilian workers increased by 2.9% for the 12-month period ending in December 2018 compared with a compensation costs increase of 2.6% in December 2017. Wages and salaries were up 3.1%, versus 2.5% for the 12-month period ending December 2017. Benefit costs increased by 2.8%, versus 2.5% in December 2017. For private industry workers, compensation costs increased 3.0% year-over-year, versus 2.6% for the 12 months ending December 2017. Wages and salaries increased 3.1% year-over-year, versus 2.8% for the 12 months ending December 2017. Benefit costs increased by 2.6%, versus 2.3% for the 12 months ending December 2017. This report is published quarterly.
This Week’s Economic Data
Links take you to the data source
Advance Estimate of 1st Quarter GDP – Released 4/26 – According to the advance estimate released by the Bureau of Economic Analysis, Real Gross Domestic Product (Real GDP) increased at an annual rate of 3.2% in the first quarter of 2019. The advance estimate is based on source data that is either incomplete or subject to further review. The first quarter increase in real GDP observed positive contributions from personal consumption expenditures (PCE), private industry investment, exports, accelerations in state and local gov’t spending, and nonresidential fixed income. Also, imports decreased in the first quarter further increasing gains to real GDP. Positive contributions were partly offset by a decrease in residential investment. A second estimate for first quarter GDP growth will be released on May 30, 2019.
Durable Goods – Released 4/25 – New orders for manufactured durable goods increased $6.8 billion or 2.7% to $258.5 billion in March. The increase in March follows a 1.1% decline in February, but four of the last five months have seen new orders increases. Transportation equipment, up 7.0%, drove the increase by $6.1 billion to $93.8 billion.
New Residential Sales – Released 4/23 – Sales of new single-family homes increased 4.5% to 692k, seasonally adjusted, in March. The median sales price of new homes sold in March was $302.7k with an average sales price of $376k. At the end of March, the seasonally adjusted estimate of new homes for sale was 344k. This represents a supply of 6.0 months at the current sales rate.
Existing Home Sales – Released 4/22 – Existing home sales declined by 4.9% in March. Sales declined to a seasonally adjusted rate of 5.21 million. Sales are currently down 5.4% from one year ago. Housing inventory increased to 3.9 months of inventory and the existing homes for sale increased to 1.68 million. The median sales price for all types of homes was $259,400, up 3.8% year/y.
Recent Economic Data
Links take you to the data source
Housing Starts – Released 4/19 – New home starts in March were at a seasonally adjusted rate of 1.139 million; down 0.3% below February and 14.2% below last March’s rate. Building Permits were at a seasonally adjusted rate of 1.269 million, down 1.7% compared to February and down 7.8% over last year.
Retail Sales – Released 4/18 – U.S. retail sales for March 2019, were $514.1 billion, an increase of 1.6% from the previous month. Retail sales are up 3.6% year to year.
U.S. Trade Balance – Released 4/17 – The U.S. Trade deficit was $49.4 billion in February, down $1.8 billion from $51.1 billion in January. February exports were $209.7 billion, $2.3 billion more than January exports. February imports were $259.1 billion, $0.6 billion more than January imports. The goods and services deficit decreased $8.3 billion year to date. Year to date exports and imports increased $11.1 billion or 2.7% and $2.8 billion or 0.5% respectively.
Industrial Production and Capacity Utilization – Released 4/16 – Industrial production declined slightly down 0.1% in March following a 0.1% increase in February. Manufacturing output was unchanged for March following two months of decline. Capacity utilization declined 0.2% to 78.8%. Utilization is 1.0% below its long-run (1972-2018) average.
Producer Price Index – Released 4/11 – The Producer Price Index for final demand increased 0.6% in March. Core PPI (less food and energy) increased by 0.2%. Year over year the index for final demand rose 2.2%.
Consumer Price Index – Released 4/10 – The Consumer Price Index increased by 0.4% in March. Core CPI, which excludes food and energy increased 0.1%. The monthly changes left total CPI up 1.9% year-over-year and core CPI up 2.0%.
Consumer Credit – Released 4/5 – Consumer credit increased at a seasonally adjusted annual rate of 4.5% in February. Revolving and nonrevolving credit increased by 3.25% and 5.0% respectively. Total Outstanding consumer credit is currently at $4.046 trillion.
US Light Vehicle Sales – Released 4/3 – U.S. light vehicle sales were at a seasonally adjusted annual rate (SAAR) of 18.01 million units in March versus a SAAR of 17.04 million units in February. The March run rate was up 1.7% from the SAAR of 17.71 million units for March 2018.
PMI Non-Manufacturing Index (ISM Services) – Released 4/3 – Economic activity in the non-manufacturing sector grew in March for the 110th consecutive month. ISM Non-Manufacturing registered 56.1 percent, which is 3.6 percentage points lower than the February reading of 59.7 percent. This represents continued growth in the non-manufacturing sector, at a slower rate.
PMI Manufacturing ISM Index – Released 4/1 – March PMI increased 1.1% to 55.3% from February’s reading of 54.2%. The New Orders Index was up 1.9% from February’s reading of 55.5% to 57.4% for March. The Production Index registered 55.8% up 1.0%.
U.S. Construction Spending – Released 4/1 – Construction spending increased by 1.0% in February measuring at a seasonally adjusted annual rate of $1,320.3 billion. The February figure is 1.1% above the February 2018 estimate. Private construction spending was 0.2% above the revised January estimate at $994.5 billion.
Personal Income – Released 3/29 – Personal Income increased 0.2% in February after seeing a 0.1% decline in January according to the BEA. The majority of the increase in February was due to increases in wages and salaries, government social benefits, and proprietor’s income. The decrease in January was primarily reflected by decreases in personal dividend income, farm proprietors’ income, and personal interest income. Real PCE (the Feds preferred inflation gauge) increased 0.1% in January. Real disposable personal income decreased 0.2% for January.
Chicago PMI – Released 3/29 – Chicago PMI declined by 6 points in March falling to 58.7, down from 64.7 in February. The Prices Paid indicator experienced its biggest decline in the past 17 months hitting its lowest level since August 2017. Although the Chicago Business Barometer has remained above the 50 – neutral level for more than two years, survey evidence suggests a slight slowdown since last year.
Consumer Confidence – Released 3/26 – The Consumer confidence index declined in March. The Index now shows a reading of 124.1 down from 131.4 in February. Expectations in recent months had declined due to financial market volatility, the government shutdown, and a poor Jobs report in February. Worries of a global economic slowdown have moderated consumer confidence. Consumer confidence levels suggest consumers still expect the economy to continue to expand as consumers continue to view both business and labor market conditions favorably. The pace of expansion of the economy is expected to moderate in 2019 however; especially as confidence softens.
Next week we get data on Consumer Confidence, Chicago PMI, Personal Income, U.S. Construction Spending, the PMI Manufacturing ISM Index, ISM Services, The April Jobs Report, and the Employment Cost Index.
Data Sources:
Bureau of Economic Analysis (BEA)
Congressional Budget Office (CBO)
U.S. Bureau of Labor Statistics (BLS)
Federal Reserve Economic Data (FRED Charts)
CME Fed Watch
U.S. Treasury – Yields
U.S. Census Bureau
Institute for Supply Management (ISM)
Weekly DOL Employment Data
BLS Monthly Jobs Report
JOLTS
US Energy Admin (EIA)
BLS Consumer Price Index CPI
BLS Producer Price Index PPI
Atlanta Fed GDPNOW
NY Fed Nowcast GDP
US Census Bureau Housing Starts
Consumer Credit
USCB Retail Sales
Construction Spending
Federal Reserve Dot Plots
NY Empire Index
Philadelphia Federal Reserve
P/E Ratio Data -Yardeni Research
Technical Analysis Info:
StockCharts.com – Financial Charts
Exponential vs Simple moving average
Other Links:
1973 Arab Oil Embargo
Hunt Brothers Silver
Long-Term Capital bailout
Categories:
Tags: