Post COVID-19 economic data is starting to roll in, as expected it’s not good.
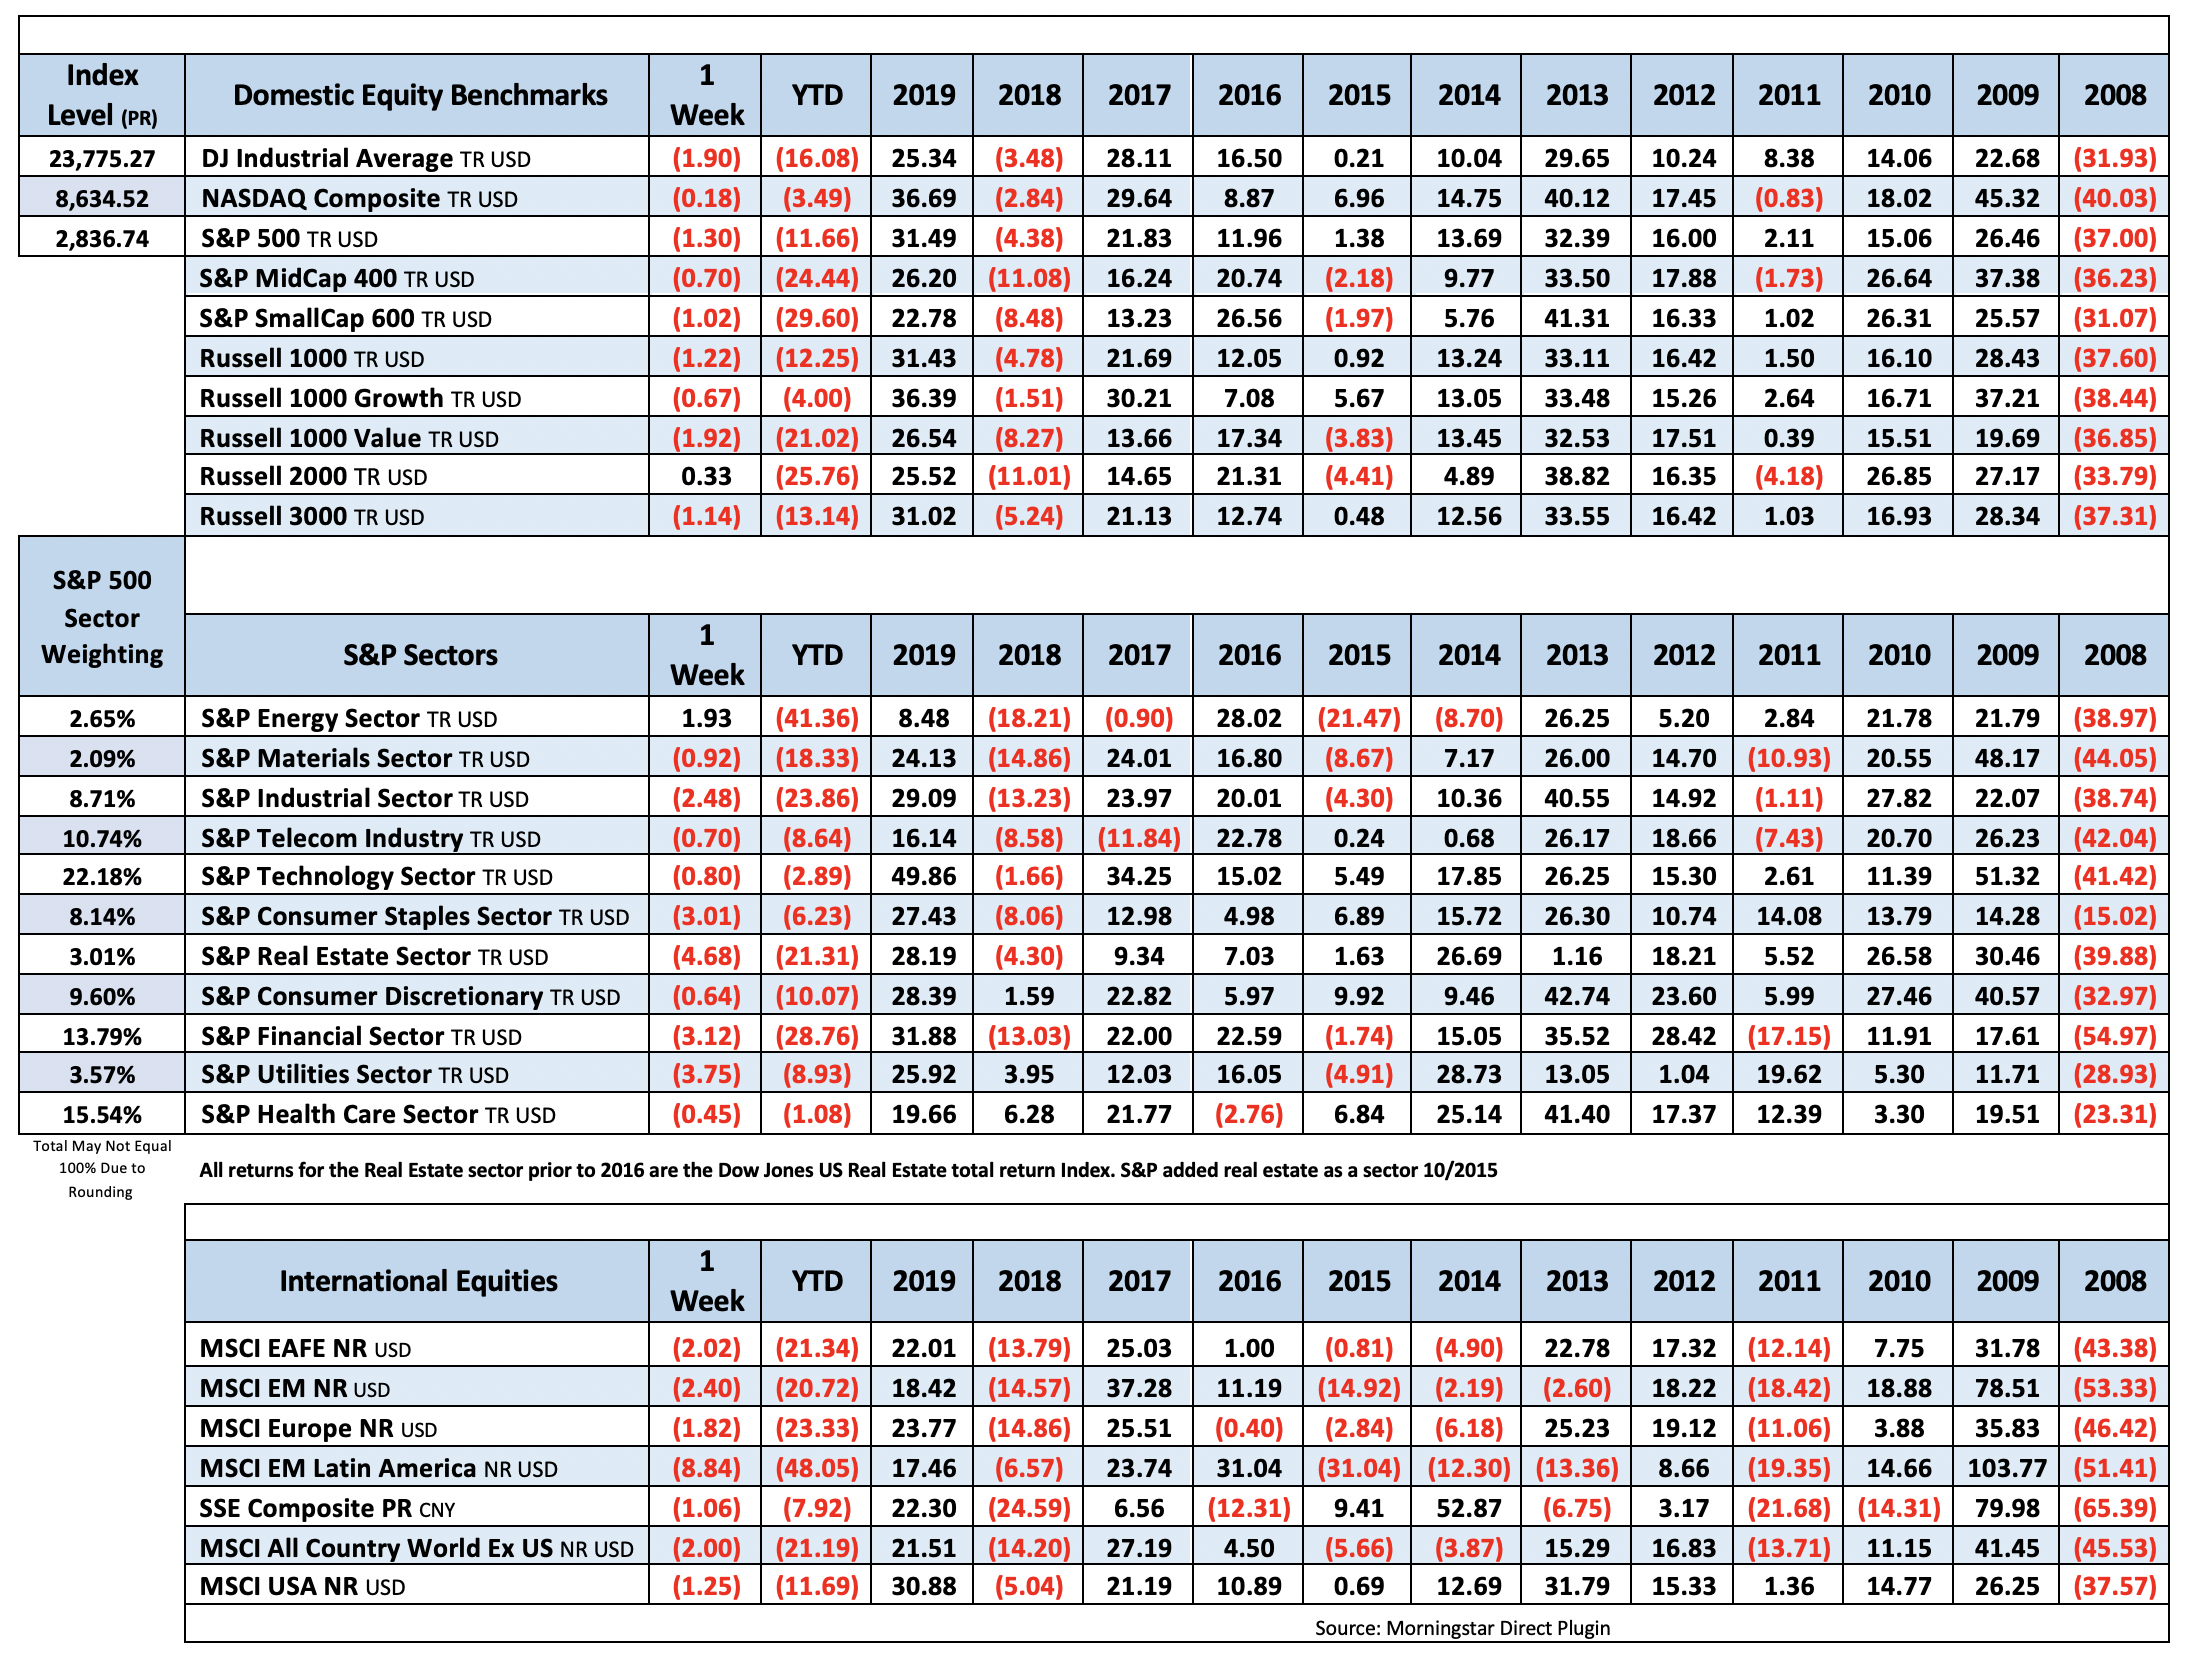
This week another 4.4 million people filed for initial unemployment benefits, bringing the five-week total to 26.5 million. March existing home sales were down -8.5% while new home sales were off -15.4%. While the broad stock markets declined 1– 2%, for the first time in history oil traded below zero. The May WTI futures contract collapsed to negative -$37.63/bbl on Monday, as no one wanted to take physical delivery given the well-documented storage constraints and lack of demand. The contract expired at $10.01/bbl on Tuesday. In the end the $WTIC continuous contract fell 32% for the week, bring the ytd decline to -74.7%.

Fixed Income
3/15/2020 Statement
FOMC December Statement Federal Reserve Dot Plots US Debt Measurement US Corporate Debt Tops $6 Trillion Treasury.gov yields
FOMC Policy Normalization Statement
Global Bond Yields
Daily US Treasury Yields
Foreign Exchange Market
Energy Complex
The Baker Hughes rig count was down 64 this week. There are 465 oil and gas rigs operating in the US – down 526 over last year.
- Brent Crude Oil lost 11.65% this week closing at $24.81/bbl
- WTI Crude Oil fell 32.32% this week to close at $16.94/bbl
- Heating Oil lost 25.22% this week closing at $0.73/gallon
- Natural Gas gained 8.10% this week closing at $1.89 per million BTUs
- Unleaded Gas lost 8.44% this week closing at $0.70/ gallon
Metals Complex
- Gold gained 2.17% this week closing at $1735.60/oz
- Silver lost 0.21% on the week closing at $15.26/oz
- Palladium lost 6.83% this week closing at $1985.30/oz
- Platinum lost 1.46% this week closing at $773.80/oz
- Copper lost 0.32% this week closing at $2.34/lb
Employment Picture
Weekly Unemployment Claims – Released Thursday 4/23/2020 – In the week ending April 18th, initial claims were 4,427,000, a decrease of 810,000 from the previous week’s revised level. The 4-week moving average was 5,786,500 an increase of 280,000 from the previous week’s revised average.
Job Openings & Labor Turnover Survey JOLTS – Released 4/7/2020 – The U.S. Bureau of Labor Statistics reported the number of job openings was little changed at 6.9 million on the last business day of February. Over the month, hires and separations were little changed at 5.9 million and 5.6 million, respectively. Within separations, the quits rate was unchanged at 2.3%. The layoffs and discharges rate was little changed at 1.2%.
March Jobs Report – BLS Summary – Released 4/3/2020 – The US Economy lost 701k nonfarm jobs in March and the Unemployment rate increased to 4.4%. Average hourly earnings increased by 11 cents. Hiring highlights include Education and Health Services -76k, Professional and Business Services -52k, Retail Trade -46k, and Construction -29k.
- Average hourly earnings increased by 11 cents in March, y/y hourly earnings are up 3.1%.
- U3 unemployment rate increased to 4.4%. U6 unemployment rate increased 24.3% to 8.7%.
- The labor force participation rate declined by 0.7% to 62.7%.
- Average workweek decreased by 0.2 hours to 34.2 hours.
Employment Cost Index – Released 1/31/2020 – Compensation costs for civilian workers increased 0.7% for the 3-month period ending in December 2019. The 12 month period ending on December 2019 saw compensation costs increase by 2.7%, 0.2% less than the 12 month period ending December 2018. Wages and salaries were up 2.9% for the 12-month period ending December 2019 compared to 3.1% for the 12 month period ending December 2018. Benefit costs increased 2.2% for the 12-month period ending December 2019. For private industry workers, compensation costs increased 2.7% year-over-year, versus 3.0% for the 12 months ending December 2018. This report is published quarterly.
This Week’s Economic Data
Links take you to the data source
Durable Goods – Released 4/24 – New orders for manufactured durable goods decreased $36.0 billion or 14.4% in March. Down following three months of increase.
New Residential Sales – Released 4/24 – Sales of new single-family homes declined 15.4% to 627k, seasonally adjusted, in March. The median sales price of new homes sold in March was $321,400 with an average sales price of $375,300. At the end of March, the seasonally adjusted estimate of new homes for sale was 333k. This represents a supply of 6.4 months at the current sales rate.
Existing Home Sales – Released 4/21 – Existing home sales decline in March. Sales declined 8.5% to a seasonally adjusted rate of 5.27 million. Sales are currently up 0.8% from one year ago. Housing inventory sits at 1.50 million units. Up 2.7% over last month. Down 10.2% over last year. Unsold inventory sits at a 3.4 month supply.
Recent Economic Data
Links take you to the data source
Housing Starts – Released 4/16 – New home starts in March were at a seasonally adjusted annual rate of 1.216 million; down 22.3% below February but 1.4% above last March’s rate. Building Permits were at a seasonally adjusted annual rate of 1.353 million, down 6.8% compared to February and up 5.0% over last year.
Industrial Production and Capacity Utilization – Released 4/15 – In March Industrial production declined 5.4%. Manufacturing declined 6.3% and mining declined 2.0%. Industrial production was 103.7% of its 2012 average which is 5.5% lower than a year ago. Total capacity utilization declined 4.3% to 72.7% in March which is 7.1% below its long-run average.
Retail Sales – Released 4/15 – U.S. retail sales for March declined 8.7% to $483.1 billion. U.S. retail sales are down 6.2% year/y.
Consumer Price Index – Released 4/10 – The Consumer Price Index declined 0.4% in March. Core CPI, which excludes food and energy declined 0.1%. The monthly changes left total CPI up 1.5% year-over-year and core CPI up 2.1%.
Producer Price Index – Released 4/9 – The Producer Price Index for final demand declined 0.2% in March. Core PPI was up 0.2%. Year over year the index for final demand rose 0.7%.
Consumer Credit – Released 4/7 – Consumer credit increased at a seasonally adjusted annual rate of 6.50% in February. Revolving and nonrevolving credit increased at annual rates of 4.50% and increased 7.0% respectively. Total Outstanding consumer credit is currently at $4.2255 trillion.
PMI Non-Manufacturing Index (ISM Services) – Released 4/3 – Economic activity in the non-manufacturing sector grew in February for the 122th consecutive month. ISM Non-Manufacturing registered 52.5 percent, which is 4.8 percentage points below the adjusted February reading of 57.3 percent. This represents continued growth in the non-manufacturing sector, at a slower rate.
U.S. Trade Balance – Released 4/2 – According to the U.S. Census Bureau of Economic Analysis the goods and services deficit declined in February $5.5 billion. February exports were $207.5 billion, $0.8 billion less than January exports. February imports were $247.5 billion, $6.3 billion less than January imports. The goods and services deficit decreased $19.7 billion or 18.7% year/y. Year – over – year exports and imports increased $1.1 billion or 0.3% and decreased $18.6 billion or 3.6% respectively.
PMI Manufacturing ISM Index – Released 4/1 – March PMI declined 1.0% to 49.1% from February’s reading of 50.1%. The New Orders Index was down 7.6% from February’s reading of 49.8% to 42.2%. The Production Index registered 47.7%, down 2.6%.
U.S. Construction Spending – Released 4/1 – Construction spending declined 1.3% in February measuring at a seasonally adjusted annual rate of $1,366.7billion. The February figure is 6.0% above the February 2019 estimate. Private construction spending was 1.2% below the revised January estimate at $1,038.5 billion. Public construction spending was 1.5% below the revised January estimate at $340.9 billion.
Chicago PMI – Released 3/31 – Chicago PMI declined 1.1 points decreasing to 47.8, marking nine consecutive months in contraction..
Consumer Confidence – Released 3/31 – The Consumer confidence index declined sharply in March following an increase in February. The Index now shows a reading of 120.0 which is down from 132.6 in February.
Personal Income – Released 3/27 – Personal Income increased 0.6% in February according to the BEA. The majority of the increase in February was due to increases in compensation of employees and increases in farm proprietor’s income. Real PCE (the Feds preferred inflation gauge) increased 0.1% in February. Real disposable personal income increased 0.4% in February.
Third Estimate of 4th Quarter and Year 2019 GDP – Released 3/26 – According to the Third Estimate released by the Bureau of Economic Analysis, Real Gross Domestic Product (Real GDP) increased at an annual rate of 2.1% in the fourth quarter of 2019. The third estimate is based on data that are more complete than were available for the advance estimate. The third estimate saw a positive revision to PCE that was largely offset by a negative revision to federal gov’t spending and nonresidential fixed investment. The fourth quarter increase in real GDP observed positive contributions from personal consumption expenditures (PCE), federal gov’t spending, state and local gov’t spending, residential fixed investment, and exports that were partly offset by negative contributions from private inventory investment, nonresidential fixed investment, and imports (which decreased). The Advance Estimate of first quarter GDP growth for 2020 will be released on April 29, 2020.
US Light Vehicle Sales – Released 2/28 – U.S. light vehicle sales were at a seasonally adjusted annual rate (SAAR) of 16.81 million units in January.
Next week we get data on The U.S. Trade Balance, Personal Income, Consumer Confidence, Chicago PMI, Construction Spending, the PMI Manufacturing ISM Index, and the Employment Cost Index.
Data Sources:
Bureau of Economic Analysis (BEA)
Congressional Budget Office (CBO)
U.S. Bureau of Labor Statistics (BLS)
Federal Reserve Economic Data (FRED Charts)
CME Fed Watch
U.S. Treasury – Yields
U.S. Census Bureau
Institute for Supply Management (ISM)
Weekly DOL Employment Data
BLS Monthly Jobs Report
JOLTS
US Energy Admin (EIA)
BLS Consumer Price Index CPI
BLS Producer Price Index PPI
Atlanta Fed GDPNOW
NY Fed Nowcast GDP
US Census Bureau Housing Starts
Consumer Credit
USCB Retail Sales
Construction Spending
Federal Reserve Dot Plots
NY Empire Index
Philadelphia Federal Reserve
P/E Ratio Data -Yardeni Research
Technical Analysis Info:
StockCharts.com – Financial Charts
Exponential vs Simple moving average
Other Links:
1973 Arab Oil Embargo
Hunt Brothers Silver
Long-Term Capital bailout


Week 17 Talking Points
Post COVID-19 economic data is starting to roll in, as expected it’s not good.
This week another 4.4 million people filed for initial unemployment benefits, bringing the five-week total to 26.5 million. March existing home sales were down -8.5% while new home sales were off -15.4%. While the broad stock markets declined 1– 2%, for the first time in history oil traded below zero. The May WTI futures contract collapsed to negative -$37.63/bbl on Monday, as no one wanted to take physical delivery given the well-documented storage constraints and lack of demand. The contract expired at $10.01/bbl on Tuesday. In the end the $WTIC continuous contract fell 32% for the week, bring the ytd decline to -74.7%.
Table of Contents
Fixed Income
3/15/2020 Statement
FOMC December Statement Federal Reserve Dot Plots US Debt Measurement US Corporate Debt Tops $6 Trillion Treasury.gov yields
FOMC Policy Normalization Statement
Global Bond Yields
Daily US Treasury Yields
Foreign Exchange Market
Energy Complex
The Baker Hughes rig count was down 64 this week. There are 465 oil and gas rigs operating in the US – down 526 over last year.
Metals Complex
Employment Picture
Weekly Unemployment Claims – Released Thursday 4/23/2020 – In the week ending April 18th, initial claims were 4,427,000, a decrease of 810,000 from the previous week’s revised level. The 4-week moving average was 5,786,500 an increase of 280,000 from the previous week’s revised average.
Job Openings & Labor Turnover Survey JOLTS – Released 4/7/2020 – The U.S. Bureau of Labor Statistics reported the number of job openings was little changed at 6.9 million on the last business day of February. Over the month, hires and separations were little changed at 5.9 million and 5.6 million, respectively. Within separations, the quits rate was unchanged at 2.3%. The layoffs and discharges rate was little changed at 1.2%.
March Jobs Report – BLS Summary – Released 4/3/2020 – The US Economy lost 701k nonfarm jobs in March and the Unemployment rate increased to 4.4%. Average hourly earnings increased by 11 cents. Hiring highlights include Education and Health Services -76k, Professional and Business Services -52k, Retail Trade -46k, and Construction -29k.
Employment Cost Index – Released 1/31/2020 – Compensation costs for civilian workers increased 0.7% for the 3-month period ending in December 2019. The 12 month period ending on December 2019 saw compensation costs increase by 2.7%, 0.2% less than the 12 month period ending December 2018. Wages and salaries were up 2.9% for the 12-month period ending December 2019 compared to 3.1% for the 12 month period ending December 2018. Benefit costs increased 2.2% for the 12-month period ending December 2019. For private industry workers, compensation costs increased 2.7% year-over-year, versus 3.0% for the 12 months ending December 2018. This report is published quarterly.
This Week’s Economic Data
Links take you to the data source
Durable Goods – Released 4/24 – New orders for manufactured durable goods decreased $36.0 billion or 14.4% in March. Down following three months of increase.
New Residential Sales – Released 4/24 – Sales of new single-family homes declined 15.4% to 627k, seasonally adjusted, in March. The median sales price of new homes sold in March was $321,400 with an average sales price of $375,300. At the end of March, the seasonally adjusted estimate of new homes for sale was 333k. This represents a supply of 6.4 months at the current sales rate.
Existing Home Sales – Released 4/21 – Existing home sales decline in March. Sales declined 8.5% to a seasonally adjusted rate of 5.27 million. Sales are currently up 0.8% from one year ago. Housing inventory sits at 1.50 million units. Up 2.7% over last month. Down 10.2% over last year. Unsold inventory sits at a 3.4 month supply.
Recent Economic Data
Links take you to the data source
Housing Starts – Released 4/16 – New home starts in March were at a seasonally adjusted annual rate of 1.216 million; down 22.3% below February but 1.4% above last March’s rate. Building Permits were at a seasonally adjusted annual rate of 1.353 million, down 6.8% compared to February and up 5.0% over last year.
Industrial Production and Capacity Utilization – Released 4/15 – In March Industrial production declined 5.4%. Manufacturing declined 6.3% and mining declined 2.0%. Industrial production was 103.7% of its 2012 average which is 5.5% lower than a year ago. Total capacity utilization declined 4.3% to 72.7% in March which is 7.1% below its long-run average.
Retail Sales – Released 4/15 – U.S. retail sales for March declined 8.7% to $483.1 billion. U.S. retail sales are down 6.2% year/y.
Consumer Price Index – Released 4/10 – The Consumer Price Index declined 0.4% in March. Core CPI, which excludes food and energy declined 0.1%. The monthly changes left total CPI up 1.5% year-over-year and core CPI up 2.1%.
Producer Price Index – Released 4/9 – The Producer Price Index for final demand declined 0.2% in March. Core PPI was up 0.2%. Year over year the index for final demand rose 0.7%.
Consumer Credit – Released 4/7 – Consumer credit increased at a seasonally adjusted annual rate of 6.50% in February. Revolving and nonrevolving credit increased at annual rates of 4.50% and increased 7.0% respectively. Total Outstanding consumer credit is currently at $4.2255 trillion.
PMI Non-Manufacturing Index (ISM Services) – Released 4/3 – Economic activity in the non-manufacturing sector grew in February for the 122th consecutive month. ISM Non-Manufacturing registered 52.5 percent, which is 4.8 percentage points below the adjusted February reading of 57.3 percent. This represents continued growth in the non-manufacturing sector, at a slower rate.
U.S. Trade Balance – Released 4/2 – According to the U.S. Census Bureau of Economic Analysis the goods and services deficit declined in February $5.5 billion. February exports were $207.5 billion, $0.8 billion less than January exports. February imports were $247.5 billion, $6.3 billion less than January imports. The goods and services deficit decreased $19.7 billion or 18.7% year/y. Year – over – year exports and imports increased $1.1 billion or 0.3% and decreased $18.6 billion or 3.6% respectively.
PMI Manufacturing ISM Index – Released 4/1 – March PMI declined 1.0% to 49.1% from February’s reading of 50.1%. The New Orders Index was down 7.6% from February’s reading of 49.8% to 42.2%. The Production Index registered 47.7%, down 2.6%.
U.S. Construction Spending – Released 4/1 – Construction spending declined 1.3% in February measuring at a seasonally adjusted annual rate of $1,366.7billion. The February figure is 6.0% above the February 2019 estimate. Private construction spending was 1.2% below the revised January estimate at $1,038.5 billion. Public construction spending was 1.5% below the revised January estimate at $340.9 billion.
Chicago PMI – Released 3/31 – Chicago PMI declined 1.1 points decreasing to 47.8, marking nine consecutive months in contraction..
Consumer Confidence – Released 3/31 – The Consumer confidence index declined sharply in March following an increase in February. The Index now shows a reading of 120.0 which is down from 132.6 in February.
Personal Income – Released 3/27 – Personal Income increased 0.6% in February according to the BEA. The majority of the increase in February was due to increases in compensation of employees and increases in farm proprietor’s income. Real PCE (the Feds preferred inflation gauge) increased 0.1% in February. Real disposable personal income increased 0.4% in February.
Third Estimate of 4th Quarter and Year 2019 GDP – Released 3/26 – According to the Third Estimate released by the Bureau of Economic Analysis, Real Gross Domestic Product (Real GDP) increased at an annual rate of 2.1% in the fourth quarter of 2019. The third estimate is based on data that are more complete than were available for the advance estimate. The third estimate saw a positive revision to PCE that was largely offset by a negative revision to federal gov’t spending and nonresidential fixed investment. The fourth quarter increase in real GDP observed positive contributions from personal consumption expenditures (PCE), federal gov’t spending, state and local gov’t spending, residential fixed investment, and exports that were partly offset by negative contributions from private inventory investment, nonresidential fixed investment, and imports (which decreased). The Advance Estimate of first quarter GDP growth for 2020 will be released on April 29, 2020.
US Light Vehicle Sales – Released 2/28 – U.S. light vehicle sales were at a seasonally adjusted annual rate (SAAR) of 16.81 million units in January.
Next week we get data on The U.S. Trade Balance, Personal Income, Consumer Confidence, Chicago PMI, Construction Spending, the PMI Manufacturing ISM Index, and the Employment Cost Index.
Data Sources:
Bureau of Economic Analysis (BEA)
Congressional Budget Office (CBO)
U.S. Bureau of Labor Statistics (BLS)
Federal Reserve Economic Data (FRED Charts)
CME Fed Watch
U.S. Treasury – Yields
U.S. Census Bureau
Institute for Supply Management (ISM)
Weekly DOL Employment Data
BLS Monthly Jobs Report
JOLTS
US Energy Admin (EIA)
BLS Consumer Price Index CPI
BLS Producer Price Index PPI
Atlanta Fed GDPNOW
NY Fed Nowcast GDP
US Census Bureau Housing Starts
Consumer Credit
USCB Retail Sales
Construction Spending
Federal Reserve Dot Plots
NY Empire Index
Philadelphia Federal Reserve
P/E Ratio Data -Yardeni Research
Technical Analysis Info:
StockCharts.com – Financial Charts
Exponential vs Simple moving average
Other Links:
1973 Arab Oil Embargo
Hunt Brothers Silver
Long-Term Capital bailout
Categories:
Tags: