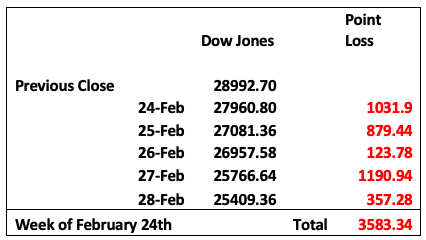
This week’s slaughter occurred more than a month after the virus really gained attention. Initially, the market traded like the virus would be contained to China but that is not the case anymore. In eight trading days, the S&P has fallen 12.76% from all-time highs. Markets have been rattled by the worsening Coronavirus outbreak around the world. At the time of this writing, the first confirmed death in the US has been reported and there are 62 confirmed cases in the States. There are 58 countries that have confirmed cases. This is a link to the WHO dashboard that shows the total cases and locations.

Fixed Income
FOMC December Statement Federal Reserve Dot Plots US Debt Measurement US Corporate Debt Tops $6 Trillion Treasury.gov yields
FOMC Policy Normalization Statement
Global Bond Yields
US Treasuries under one year are inverted with the one-year, two-year, and five-year yields.
Daily US Treasury Yields
Foreign Exchange Market
Energy Complex
The Baker Hughes rig count was flat this week. There are 790 oil and gas rigs operating in the US – down 248 over last year.
- Brent Crude Oil lost 15.09% this week closing at $49.67/bbl
- WTI Crude Oil lost 16.15% this week to close at $44.76/bbl
- Heating Oil lost 12.14% this week closing at $1.48/gallon
- Natural Gas lost 12.15% this week closing at $1.68 per million BTUs
- Unleaded Gas lost 15.81% this week closing at $1.48/gallon
Metals Complex
- Gold lost 4.98% this week closing at $1566.70/oz
- Silver lost 11.19% on the week closing at $16.46/oz
- Palladium lost 4.39% this week closing at $2491.10/oz
- Platinum lost 11.41% this week closing at $864.70/oz
- Copper lost 2.61% this week closing at $2.54/lb
Employment Picture
Weekly Unemployment Claims – Released Thursday 2/27/2020 – In the week ending February 22th, initial claims were 219,000, an increase of 8,000 from the previous week’s revised level. The 4-week moving average was 209,750, an increase of 500 from the previous week’s revised average.
Job Openings & Labor Turnover Survey JOLTS – Released 2/11/2020 – The U.S. Bureau of Labor Statistics reported the number of job openings declined from 6.8 million to 6.4 million on the last business day of December. Over the month, hires and separations were little changed at 5.9 million and 5.7 million, respectively. Within separations, the quits rate was unchanged at 2.3%. The layoffs and discharges rates were little changed at 1.2%.
January Jobs Report – BLS Summary – Released 2/7/2020 – The US Economy added 225k nonfarm jobs in January and the Unemployment rate was little changed at 3.6%. Average hourly earnings increased by 7 cents. Hiring highlights include Education and Health Services +72k, Construction +44k, and Leisure and Hospitality +36k.
- Average hourly earnings increased by 7 cents in January, y/y hourly earnings are up 3.1%.
- U3 unemployment rate was little changed at 3.6%. U6 unemployment rate increased 0.2% to 6.9%.
- The labor force participation rate increased by 0.2% in January to 63.4%.
- Average workweek was unchanged at 34.3 hours.
Employment Cost Index – Released 1/31/2020 – Compensation costs for civilian workers increased 0.7% for the 3-month period ending in December 2019. The 12 month period ending in December 2019 saw compensation costs increase by 2.7%, 0.2% less than the 12 month period ending December 2018. Wages and salaries were up 2.9% for the 12-month period ending December 2019 compared to 3.1% for the 12 month period ending December 2018. Benefit costs increased 2.2% for the 12-month period ending December 2019. For private industry workers, compensation costs increased 2.7% year-over-year, versus 3.0% for the 12 months ending December 2018. This report is published quarterly.
This Week’s Economic Data
Links take you to the data source
Chicago PMI – Released 2/28 – Chicago PMI increased 6.1 points increasing to 49.0, up from 42.9 in January. This marks the highest reading since August 2019. The index is up three of the last four months yet the index is still in contractionary territory and has been for six consecutive months. Production and Supplier Deliveries showed the greatest gains and Employment was the only indicator to decline in February.
Personal Income – Released 2/28 – Personal Income increased 0.6% in January according to the BEA. The majority of the increase in January was due to increases in compensation of employees and social security benefit payments, and other government social benefits to persons. Real PCE (the Feds preferred inflation gauge) increased 0.1% in January. Real disposable personal income increased 0.5% in January.
US Light Vehicle Sales – Released 2/28 – U.S. light-vehicle sales were at a seasonally adjusted annual rate (SAAR) of 16.81 million units in January.
Second Estimate of 4th Quarter and Year 2019 GDP – Released 2/27 – According to the Advance Estimate released by the Bureau of Economic Analysis, Real Gross Domestic Product (Real GDP) increased at an annual rate of 2.1% in the fourth quarter of 2019. The advance estimate is based on data that are more complete than were available for the advance estimate. The second estimate saw an upward revision to private inventory investment that was offset by a downward revision to nonresidential fixed investment. The fourth-quarter increase in real GDP observed positive contributions from personal consumption expenditures (PCE), federal gov’t spending, state, and local gov’t spending, residential fixed investment, and exports that were partly offset by negative contributions from private inventory investment, nonresidential fixed investment, and imports (which decreased). The Third Estimate of fourth-quarter GDP growth, which is based on more complete data, will be released on March 26, 2020.
Durable Goods – Released 2/27 – New orders for manufactured durable goods decreased $0.4 billion or 0.2% to $246.2 billion in January. The decrease in January follows a 2.9% increase in December. Transportation equipment drove the decrease; down $1.8 billion or 2.2%.
New Residential Sales – Released 2/26 – Sales of new single-family homes increased 7.9% to 764k, seasonally adjusted, in January. The median sales price of new homes sold in January was $348.2k with an average sales price of $402.3k. At the end of January, the seasonally adjusted estimate of new homes for sale was 324k. This represents a supply of 5.1 months at the current sales rate.
Consumer Confidence – Released 2/25 – The Consumer confidence index increased slightly in February following an increase in January. The Index now shows a reading of 130.7 which is up from 130.4 in January. Consumers continue to view current conditions favorably.
Recent Economic Data
Links take you to the data source
Existing Home Sales – Released 2/21 – Existing home sales decreased in January. Sales decreased 1.3% to a seasonally adjusted rate of 5.46 million. Sales are currently up 9.6% from one year ago. Housing inventory increased from 3.0 months of inventory to 3.1 months of unsold inventory and the total housing inventory increased from 1.40 million to 1.42 million. The median sales price for all types of homes was $266,300, up 6.8% year/y.
Housing Starts – Released 2/19 – New home starts in January were at a seasonally adjusted annual rate of 1.567 million; down 3.6% below December but 21.4% above last January’s rate. Building Permits were at a seasonally adjusted annual rate of 1.551 million, up 9.2% compared to December and up 17.9% over last year.
Producer Price Index – Released 2/19 – The Producer Price Index for final demand increased 0.5% in January. Core PPI was up 0.3%. Year over year the index for final demand rose 2.1%.
Industrial Production and Capacity Utilization – Released 2/14 – In January Industrial production declined 0.3%. Unseasonably warm weather resulted in a lower output from utilities. Manufacturing declined 0.1% and mining was up 1.2%. Industrial production was 0.8% lower year/y. Total capacity utilization declined 0.3% to 76.8% in January which is 3.0% below its long-run average.
Retail Sales – Released 2/14 – U.S. retail sales for January increased 0.3% to $529.8 billion. U.S. retail sales are up 4.4% year/y.
Consumer Price Index – Released 2/13 – The Consumer Price Index gained 0.1% in January. Core CPI, which excludes food and energy increased 0.2%. The monthly changes left total CPI up 2.5% year-over-year and core CPI up 2.3%.
Consumer Credit – Released 2/7 – Consumer credit increased at a seasonally adjusted annual rate of 4.75% in 2019. Revolving and nonrevolving credit increased at annual rates of 4.25% and increased 4.75% respectively. Consumer credit increased at a seasonally adjusted annual rate of 5 percent in the fourth quarter and at a rate of 6-1/4 percent in December. Total Outstanding consumer credit is currently at $4.197 trillion.
U.S. Trade Balance – Released 2/6 – According to the U.S. Census Bureau of Economic Analysis, the goods and services deficit increased in December to $48.9 billion. This increase is $5.2 billion higher than the deficit recorded in November. December exports were $209.6 billion, $1.6 billion more than November exports. December imports were $258.5 billion, $6.8 billion more than November imports. The goods and services deficit increased $10.9 billion or 1.7% in 2019. In 2019 exports and imports decreased $1.5 billion or 0.1% and decreased $12.5 billion or 0.4% respectively.
PMI Non-Manufacturing Index (ISM Services) – Released 2/5 – Economic activity in the non-manufacturing sector grew in January for the 120th consecutive month. ISM Non-Manufacturing registered 55.5 percent, which is 0.6 percentage points above the adjusted December reading of 54.9 percent. This represents continued growth in the non-manufacturing sector, at a faster rate.
PMI Manufacturing ISM Index – Released 2/3 – January PMI increased by 3.1% to 50.9% from December’s reading of 47.8%. The New Orders Index was up 4.4% from December’s reading of 47.6% to 52.0%. The Production Index registered 54.3% up 9.5%.
U.S. Construction Spending – Released 2/3 – Construction spending declined 0.2% in December measuring at a seasonally adjusted annual rate of $1,327.7 billion. The December figure is 5.0% above the December 2018 estimate. Private construction spending was 0.1% below the revised November estimate at $991.2 billion. Public construction spending was 0.4% below the revised November estimate at $336.4 billion.
Next week we get data on U.S. Construction Spending, Consumer Credit, ISM Services, the PMI Manufacturing ISM Index, The U.S. Trade Balance, and the February Jobs Report.
Data Sources:
Bureau of Economic Analysis (BEA)
Congressional Budget Office (CBO)
U.S. Bureau of Labor Statistics (BLS)
Federal Reserve Economic Data (FRED Charts)
CME Fed Watch
U.S. Treasury – Yields
U.S. Census Bureau
Institute for Supply Management (ISM)
Weekly DOL Employment Data
BLS Monthly Jobs Report
JOLTS
US Energy Admin (EIA)
BLS Consumer Price Index CPI
BLS Producer Price Index PPI
Atlanta Fed GDPNOW
NY Fed Nowcast GDP
US Census Bureau Housing Starts
Consumer Credit
USCB Retail Sales
Construction Spending
Federal Reserve Dot Plots
NY Empire Index
Philadelphia Federal Reserve
P/E Ratio Data -Yardeni Research
Technical Analysis Info:
StockCharts.com – Financial Charts
Exponential vs Simple moving average
Other Links:
1973 Arab Oil Embargo
Hunt Brothers Silver
Long-Term Capital bailout


Week 9 Talking Points
This week’s slaughter occurred more than a month after the virus really gained attention. Initially, the market traded like the virus would be contained to China but that is not the case anymore. In eight trading days, the S&P has fallen 12.76% from all-time highs. Markets have been rattled by the worsening Coronavirus outbreak around the world. At the time of this writing, the first confirmed death in the US has been reported and there are 62 confirmed cases in the States. There are 58 countries that have confirmed cases. This is a link to the WHO dashboard that shows the total cases and locations.
Table of Contents
Fixed Income
FOMC December Statement Federal Reserve Dot Plots US Debt Measurement US Corporate Debt Tops $6 Trillion Treasury.gov yields
FOMC Policy Normalization Statement
Global Bond Yields
US Treasuries under one year are inverted with the one-year, two-year, and five-year yields.
Daily US Treasury Yields
Foreign Exchange Market
Energy Complex
The Baker Hughes rig count was flat this week. There are 790 oil and gas rigs operating in the US – down 248 over last year.
Metals Complex
Employment Picture
Weekly Unemployment Claims – Released Thursday 2/27/2020 – In the week ending February 22th, initial claims were 219,000, an increase of 8,000 from the previous week’s revised level. The 4-week moving average was 209,750, an increase of 500 from the previous week’s revised average.
Job Openings & Labor Turnover Survey JOLTS – Released 2/11/2020 – The U.S. Bureau of Labor Statistics reported the number of job openings declined from 6.8 million to 6.4 million on the last business day of December. Over the month, hires and separations were little changed at 5.9 million and 5.7 million, respectively. Within separations, the quits rate was unchanged at 2.3%. The layoffs and discharges rates were little changed at 1.2%.
January Jobs Report – BLS Summary – Released 2/7/2020 – The US Economy added 225k nonfarm jobs in January and the Unemployment rate was little changed at 3.6%. Average hourly earnings increased by 7 cents. Hiring highlights include Education and Health Services +72k, Construction +44k, and Leisure and Hospitality +36k.
Employment Cost Index – Released 1/31/2020 – Compensation costs for civilian workers increased 0.7% for the 3-month period ending in December 2019. The 12 month period ending in December 2019 saw compensation costs increase by 2.7%, 0.2% less than the 12 month period ending December 2018. Wages and salaries were up 2.9% for the 12-month period ending December 2019 compared to 3.1% for the 12 month period ending December 2018. Benefit costs increased 2.2% for the 12-month period ending December 2019. For private industry workers, compensation costs increased 2.7% year-over-year, versus 3.0% for the 12 months ending December 2018. This report is published quarterly.
This Week’s Economic Data
Links take you to the data source
Chicago PMI – Released 2/28 – Chicago PMI increased 6.1 points increasing to 49.0, up from 42.9 in January. This marks the highest reading since August 2019. The index is up three of the last four months yet the index is still in contractionary territory and has been for six consecutive months. Production and Supplier Deliveries showed the greatest gains and Employment was the only indicator to decline in February.
Personal Income – Released 2/28 – Personal Income increased 0.6% in January according to the BEA. The majority of the increase in January was due to increases in compensation of employees and social security benefit payments, and other government social benefits to persons. Real PCE (the Feds preferred inflation gauge) increased 0.1% in January. Real disposable personal income increased 0.5% in January.
US Light Vehicle Sales – Released 2/28 – U.S. light-vehicle sales were at a seasonally adjusted annual rate (SAAR) of 16.81 million units in January.
Second Estimate of 4th Quarter and Year 2019 GDP – Released 2/27 – According to the Advance Estimate released by the Bureau of Economic Analysis, Real Gross Domestic Product (Real GDP) increased at an annual rate of 2.1% in the fourth quarter of 2019. The advance estimate is based on data that are more complete than were available for the advance estimate. The second estimate saw an upward revision to private inventory investment that was offset by a downward revision to nonresidential fixed investment. The fourth-quarter increase in real GDP observed positive contributions from personal consumption expenditures (PCE), federal gov’t spending, state, and local gov’t spending, residential fixed investment, and exports that were partly offset by negative contributions from private inventory investment, nonresidential fixed investment, and imports (which decreased). The Third Estimate of fourth-quarter GDP growth, which is based on more complete data, will be released on March 26, 2020.
Durable Goods – Released 2/27 – New orders for manufactured durable goods decreased $0.4 billion or 0.2% to $246.2 billion in January. The decrease in January follows a 2.9% increase in December. Transportation equipment drove the decrease; down $1.8 billion or 2.2%.
New Residential Sales – Released 2/26 – Sales of new single-family homes increased 7.9% to 764k, seasonally adjusted, in January. The median sales price of new homes sold in January was $348.2k with an average sales price of $402.3k. At the end of January, the seasonally adjusted estimate of new homes for sale was 324k. This represents a supply of 5.1 months at the current sales rate.
Consumer Confidence – Released 2/25 – The Consumer confidence index increased slightly in February following an increase in January. The Index now shows a reading of 130.7 which is up from 130.4 in January. Consumers continue to view current conditions favorably.
Recent Economic Data
Links take you to the data source
Existing Home Sales – Released 2/21 – Existing home sales decreased in January. Sales decreased 1.3% to a seasonally adjusted rate of 5.46 million. Sales are currently up 9.6% from one year ago. Housing inventory increased from 3.0 months of inventory to 3.1 months of unsold inventory and the total housing inventory increased from 1.40 million to 1.42 million. The median sales price for all types of homes was $266,300, up 6.8% year/y.
Housing Starts – Released 2/19 – New home starts in January were at a seasonally adjusted annual rate of 1.567 million; down 3.6% below December but 21.4% above last January’s rate. Building Permits were at a seasonally adjusted annual rate of 1.551 million, up 9.2% compared to December and up 17.9% over last year.
Producer Price Index – Released 2/19 – The Producer Price Index for final demand increased 0.5% in January. Core PPI was up 0.3%. Year over year the index for final demand rose 2.1%.
Industrial Production and Capacity Utilization – Released 2/14 – In January Industrial production declined 0.3%. Unseasonably warm weather resulted in a lower output from utilities. Manufacturing declined 0.1% and mining was up 1.2%. Industrial production was 0.8% lower year/y. Total capacity utilization declined 0.3% to 76.8% in January which is 3.0% below its long-run average.
Retail Sales – Released 2/14 – U.S. retail sales for January increased 0.3% to $529.8 billion. U.S. retail sales are up 4.4% year/y.
Consumer Price Index – Released 2/13 – The Consumer Price Index gained 0.1% in January. Core CPI, which excludes food and energy increased 0.2%. The monthly changes left total CPI up 2.5% year-over-year and core CPI up 2.3%.
Consumer Credit – Released 2/7 – Consumer credit increased at a seasonally adjusted annual rate of 4.75% in 2019. Revolving and nonrevolving credit increased at annual rates of 4.25% and increased 4.75% respectively. Consumer credit increased at a seasonally adjusted annual rate of 5 percent in the fourth quarter and at a rate of 6-1/4 percent in December. Total Outstanding consumer credit is currently at $4.197 trillion.
U.S. Trade Balance – Released 2/6 – According to the U.S. Census Bureau of Economic Analysis, the goods and services deficit increased in December to $48.9 billion. This increase is $5.2 billion higher than the deficit recorded in November. December exports were $209.6 billion, $1.6 billion more than November exports. December imports were $258.5 billion, $6.8 billion more than November imports. The goods and services deficit increased $10.9 billion or 1.7% in 2019. In 2019 exports and imports decreased $1.5 billion or 0.1% and decreased $12.5 billion or 0.4% respectively.
PMI Non-Manufacturing Index (ISM Services) – Released 2/5 – Economic activity in the non-manufacturing sector grew in January for the 120th consecutive month. ISM Non-Manufacturing registered 55.5 percent, which is 0.6 percentage points above the adjusted December reading of 54.9 percent. This represents continued growth in the non-manufacturing sector, at a faster rate.
PMI Manufacturing ISM Index – Released 2/3 – January PMI increased by 3.1% to 50.9% from December’s reading of 47.8%. The New Orders Index was up 4.4% from December’s reading of 47.6% to 52.0%. The Production Index registered 54.3% up 9.5%.
U.S. Construction Spending – Released 2/3 – Construction spending declined 0.2% in December measuring at a seasonally adjusted annual rate of $1,327.7 billion. The December figure is 5.0% above the December 2018 estimate. Private construction spending was 0.1% below the revised November estimate at $991.2 billion. Public construction spending was 0.4% below the revised November estimate at $336.4 billion.
Next week we get data on U.S. Construction Spending, Consumer Credit, ISM Services, the PMI Manufacturing ISM Index, The U.S. Trade Balance, and the February Jobs Report.
Data Sources:
Bureau of Economic Analysis (BEA)
Congressional Budget Office (CBO)
U.S. Bureau of Labor Statistics (BLS)
Federal Reserve Economic Data (FRED Charts)
CME Fed Watch
U.S. Treasury – Yields
U.S. Census Bureau
Institute for Supply Management (ISM)
Weekly DOL Employment Data
BLS Monthly Jobs Report
JOLTS
US Energy Admin (EIA)
BLS Consumer Price Index CPI
BLS Producer Price Index PPI
Atlanta Fed GDPNOW
NY Fed Nowcast GDP
US Census Bureau Housing Starts
Consumer Credit
USCB Retail Sales
Construction Spending
Federal Reserve Dot Plots
NY Empire Index
Philadelphia Federal Reserve
P/E Ratio Data -Yardeni Research
Technical Analysis Info:
StockCharts.com – Financial Charts
Exponential vs Simple moving average
Other Links:
1973 Arab Oil Embargo
Hunt Brothers Silver
Long-Term Capital bailout
Categories:
Tags: