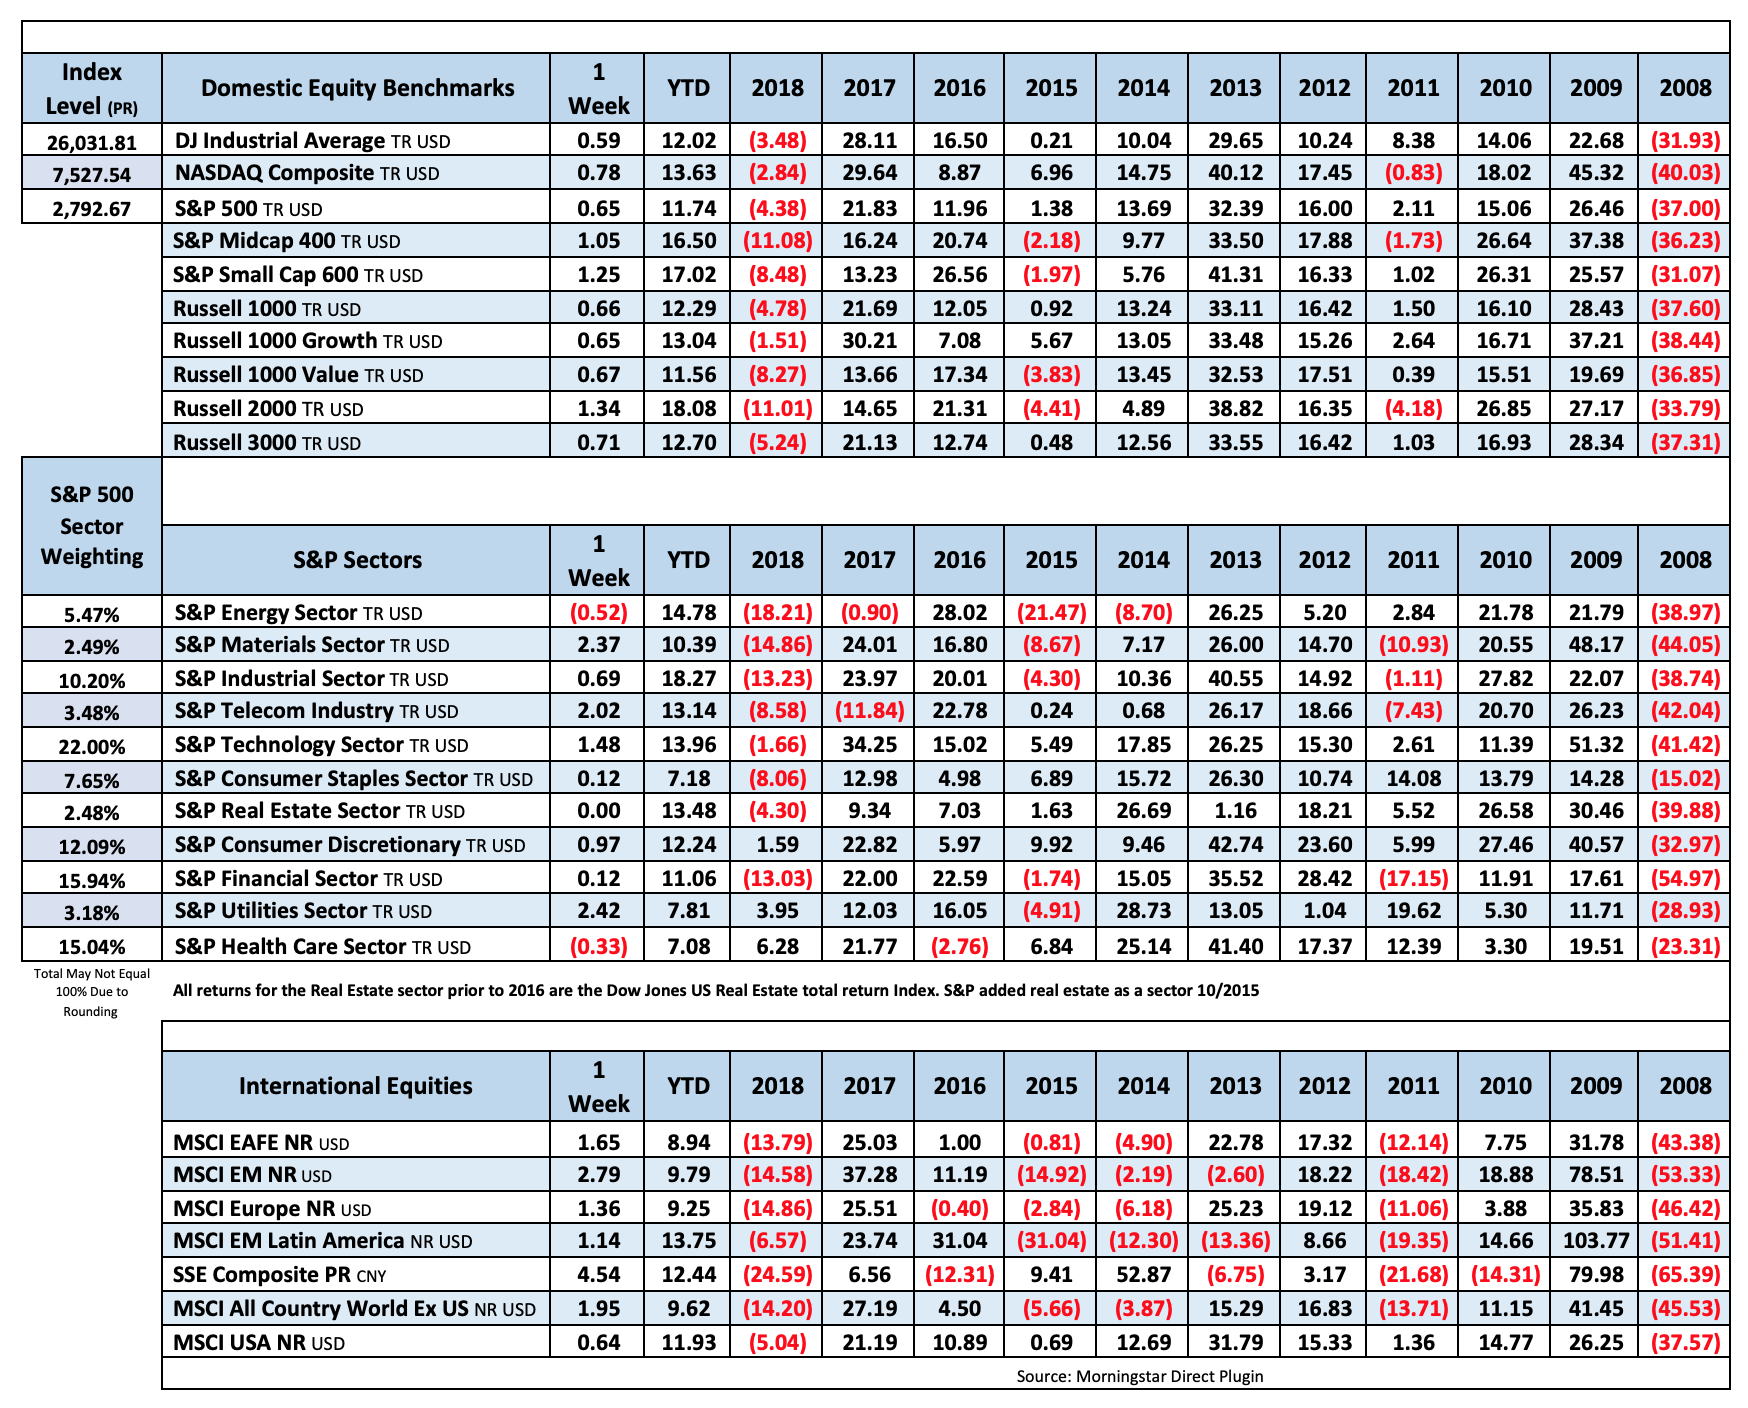
In the shortened trading week, U.S. equities were able to extend their winning streak to nine weeks. Both the Dow and S&P gained 0.60%, the Nasdaq added 0.8% with mid and small caps both up over 1%. Utilities and materials gained 2.4% and 2.3% and led the sectors with tech gaining 1.4%. Energy and health care lagged, down -0.5% and -0.3% respectively.
The Federal Reserve released the minutes of their January meeting, in which they cite a more flexible approach to monetary policy. The minutes suggest the Fed is going to be patient in raising rates and is likely to stop reducing the assets on its balance sheet later this year. You can read them here: January Meeting Minutes
We also entered the seventh round of US-China trade talks this week. The two sides made an agreement on currency, but no specifics were provided. China reportedly committed to purchase $1.2 trillion in U.S. goods. The discussions seem to be progressing, or at least not getting worse and this helped investor sentiment.
Existing home sales decreased by 1.2% in January to a seasonally adjusted rate of 4.94 million. Sales are currently down 8.5% from one year ago. Durable goods increased $3.0 billion or 1.2% to $254.4 billion in December. This increase makes two consecutive months of gains.

Fixed Income
FOMC January Statement Federal Reserve Dot Plots Dec 18 US Debt Measurement– January Meeting Minutes US Corporate Debt Tops $6 Trillion. Treasury.gov yields
Global Bond Yields
Foreign Exchange Market
Energy Complex
The Baker Hughes rig count declined by 4 this week. There are 1047 oil and gas rigs operating in the US – Up 69 over last year.
- Brent Crude Oil gained 1.31% this week closing at $67.12/bbl
- WTI Crude Oil gained 2.29% this week to close at $57.26/bbl
- Heating Oil gained 0.66% this week closing at $2.03/gallon
- Natural Gas gained 4.34% this week closing at $2.74 per million BTUs
- Unleaded Gas gained 1.65% this week closing at $1.77/gallon
Metals Complex
Gold continues to creep higher, trading up 0.81% in 6 days.
-
-
- Gold gained 0.81% this week closing at $1332.80/oz
- Silver gained 1.09% on the week closing at $15.91/oz
- Palladium gained 3.91% this week closing at $1462.20/oz
- Platinum gained 4.83% this week closing at 845.90/oz
- Copper gained 5.47% this week closing at $2.95/lb
Employment Picture
The economy continues to create jobs and the labor participation rate is starting to creep up after bottoming at 62.4% in September 2015
Weekly Unemployment Claims – Released Thursday 2/21 – In the week ending February 16, initial claims were 216k a decrease of 23k from the previous week’s unrevised level. The 4-week moving average was 235,750 an increase of 4,000 from the previous week’s unrevised average.
https://fred.stlouisfed.org/graph/?g=mVIl
Job Openings & Labor Turnover Survey JOLTS – Released Tuesday 2/12– The number of job openings increased to a series high of 7.3 million on the last business day of December, the U.S. Bureau of Labor Statistics reported. Over the month, hires were little changed at 5.9 million, quits increased slightly to 3.5 million, and total separations were little changed at 5.5 million. Within separations, the quits rate and the layoffs and discharges rates were unchanged at 2.3 percent and 1.1 percent, respectively.
https://fred.stlouisfed.org/graph/?g=lSNf
January Jobs Report – BLS Summary Released 2/1 – The US Economy added 304k nonfarm jobs in January and the Unemployment rate increased to 4%. Hourly eearningsrose The December report was revised down 90k though. Hiring highlights to include Education and Health care +55k, Leisure and Hospitality +74k, Professional and Business Services +30k, Construction +52k, and Transportation and Warehousing +27k.
- Average hourly earnings increased by 3 cents/ 0.11% in January y/y hourly earnings are up 3.2%.
- U3 unemployment edged upward by 0.1% to 4.0%. U6 unemployment rate increased 0.5% at 8.1%.
- The labor force participation rate increased slightly from 63.1% to 63.2%.
- The average workweek was unchanged at 34.5 hours.
Employment Cost Index – Released 1/31/19 – Compensation costs for civilian workers increased by 2.9% for the 12-month period ending in December 2018 compared with a compensation costs increase of 2.6% in December 2017. Wages and salaries were up 3.1%, versus 2.5% for the 12-month period ending December 2017. Benefit costs increased by 2.8%, versus 2.5% in December 2017. For private industry workers, compensation costs increased 3.0% year-over-year, versus 2.6% for the 12 months ending December 2017. Wages and salaries increased 3.1% year-over-year, versus 2.8% for the 12 months ending December 2017. Benefit costs increased by 2.6%, versus 2.3% for the 12 months ending December 2017. This report is published quarterly.
This Week’s Economic Data
Links take you to the data source
Existing Home Sales – Released 2/21 – Existing home sales decreased by 1.2% in January. Sales decreased to a seasonally adjusted rate of 4.94 million. Sales are currently down 8.5% from one year ago. Housing inventory increased to 3.9 months of inventory and the existing homes for sale declined to 1.59 million. The median sales price for all types of homes was $247,500, up 2.8% year/y.
Durable Goods – Released 2/21 – New orders for manufactured durable goods increased $3.0 billion or 1.2% to $254.4 billion in December. This increase makes two consecutive months of gains. Transportation equipment, up 3.3%, drove the increase by $2.8 billion to $90.2 billion.
Recent Economic Data
Links take you to the data source
Industrial Production and Capacity Utilization – Released 2/15 – Industrial production declined by 0.6% in January following a 0.1% increase in December. Manufacturing output was also on the decline falling by 0.9%. The decline resulted primarily from a large drop in motor vehicle assemblies. Capacity utilization declined 0.6% to78.2%. Utilization is 1.6% below its long run (1972-2018) average.
Retail Sales – Released 2/14 – U.S. retail sales for December 2018, were $505.8 billion, a decrease of 1.2% from the previous month, but 2.3% above December 2017. Total sales for the 12 months of 2018 were up 5.0%.
Producer Price Index – Released 2/14 – The Producer Price Index for final demand declined 0.1% in January. Core PPI (less food and energy) increased 0.3%. Year over year the index for final demand rose 2.0%.
Consumer Price Index – Released 2/13 – The Consumer Price Index was unchanged in January. Core CPI, which excludes food and energy increased 0.2%. The monthly changes left total CPI up 1.6% year-over-year and core CPI up 2.2%.
Consumer Credit – Released 2/7 – Consumer credit increased at a seasonally adjusted annual rate of 6.5% in the fourth quarter and at a rate of 5% in December. For the 2018 calendar year, consumer credit increased 5%, with revolving and nonrevolving credit increasing 2.75% and 5.5% respectively.
U.S. Trade Balance – Released 2/6 – The U.S. Trade deficit was $49.3 billion in November, down $6.4 billion from $55.7 billion in October, November exports were $209.9 billion, $1.3 billion less than October exports. November imports were $259.2 billion, $7.7 billion less than October imports.
PMI Non-Manufacturing Index (ISM Services) – Released 2/5 – Economic activity in the non-manufacturing sector grew in January for the 108th consecutive month. ISM Non-Manufacturing registered 56.7 percent, which is 1.3 percentage points lower than the December reading of 58 percent. This represents continued growth in the non-manufacturing sector, at a slower rate.
PMI Manufacturing ISM Index – Released 2/1 – December PMI increased 2.3% to 56.6% from December’s reading of 54.3%. The New Orders Index was up 6.9% to 51.3%. The Production Index registered 60.5% up 6.4%.
U.S. Construction Spending – Released 2/1 – Construction spending increased slightly by 0.8% in November measuring at a seasonally adjusted annual rate of $1,299.9 billion. The November figure is 3.4% above the November 2017 estimate. Private construction spending was 1.3% above the revised October estimate.
New Residential Sales – Released 1/31 – Last month sales of new single-family homes increased by 16.9% to 657k, seasonally adjusted. The median sales price of new homes sold in November was $302.40k with an average sales price of $362.40k. At the end of November, the seasonally adjusted estimate of new homes for sale was 330k. This represents a supply of 6.0 months at the current sales rate.
Chicago PMI – Released 1/31 – Chicago PMI decreased 7.1 points in January easing to 56.7, down from 63.8 in December. The Prices Paid indicator was unchanged for the month ending a five consecutive monthly decline.
Consumer Confidence – Released 1/29 – The Consumer confidence index declined in January. The Index now shows a reading of 120.2 down from 126.6 in December. Despite the decline in January and despite weakened expectations regarding job prospects and business conditions, consumer confidence levels suggest economic conditions remain favorable. Expectations declined sharply due to financial market volatility and the government shutdown. Consumers’ assessment of the current conditions was little changed. This marks three months in a row of decline in consumer confidence. Back to back declines in Consumer Confidence reflect a growing concern of a moderating pace of economic growth in 2019.
Personal Income – Released 12/21 – (Delayed release due to gov’t shutdown) Personal Income increased 0.2% in November according to the BEA. The majority of this increase was due to increases in wages and salaries and increases in farm proprietor’s income. Real PCE (the Feds preferred inflation gauge) increased by 0.3%. Real disposable personal income increased by 0.2%. Real Personal Consumption Expenditures (PCE) has risen 1.8% y/y.
3rd Estimate of 3rd Quarter GDP – Released 12/21 – (Delayed release due to gov’t shutdown) According to the third estimate released by the Bureau of Economic Analysis, Real Gross Domestic Product (Real GDP) increased at an annual rate of 3.4% in the third quarter of 2018. This result is slightly lower by 0.1% from 3.5% seen in the second estimate. The general outlook of real GDP remains roughly the same. The third estimate data provided an upward revision to private inventory investment. Downward revisions were reflected in personal consumption expenditures (PCE) and exports.
US Light Vehicle Sales – Released 12/6 – (Delayed release due to gov’t shutdown) U.S. light vehicle sales were at a seasonally adjusted annual rate (SAAR) of 17.40 million units in November versus a SAAR of 17.49 million units in October. The November run rate was down 0.7% from the SAAR of 17.52 million units for November 2017.
Housing Starts – Released 12/18 – (Delayed release due to gov’t shutdown) New home starts in November were at a seasonally adjusted rate of 1.256 million; up 3.2% above October and down 3.6% from last November. Building Permits were at a seasonally adjusted rate of 1.328 million, up 5.0% compared to last month and up 0.4% over last year.
Data Sources:
Bureau of Economic Analysis (BEA)
Congressional Budget Office (CBO)
U.S. Bureau of Labor Statistics (BLS)
Federal Reserve Economic Data (FRED Charts)
CME Fed Watch
U.S. Treasury – Yields
U.S. Census Bureau
Institute for Supply Management (ISM)
Weekly DOL Employment Data
BLS Monthly Jobs Report
JOLTS
US Energy Admn (EIA)
BLS Consumer Price Index CPI
BLS Producer Price Index PPI
Atlanta Fed GDPNOW
NY Fed Nowcast GDP
US Census Bureau Housing Starts
Consumer Credit
USCB Retail Sales
Construction Spending
Federal Reserve Dot Plots
NY Empire Index
Philadelphia Federal Reserve
P/E Ratio Data -Yardeni Research
Technical Analysis Info:
StockCharts.com – Financial Charts
Exponential vs Simple moving average
Other Links:
1973 Arab Oil Embargo
Hunt Brothers Silver
Long-Term Capital bailout


Week 8 Talking Points #8
In the shortened trading week, U.S. equities were able to extend their winning streak to nine weeks. Both the Dow and S&P gained 0.60%, the Nasdaq added 0.8% with mid and small caps both up over 1%. Utilities and materials gained 2.4% and 2.3% and led the sectors with tech gaining 1.4%. Energy and health care lagged, down -0.5% and -0.3% respectively.
The Federal Reserve released the minutes of their January meeting, in which they cite a more flexible approach to monetary policy. The minutes suggest the Fed is going to be patient in raising rates and is likely to stop reducing the assets on its balance sheet later this year. You can read them here: January Meeting Minutes
We also entered the seventh round of US-China trade talks this week. The two sides made an agreement on currency, but no specifics were provided. China reportedly committed to purchase $1.2 trillion in U.S. goods. The discussions seem to be progressing, or at least not getting worse and this helped investor sentiment.
Existing home sales decreased by 1.2% in January to a seasonally adjusted rate of 4.94 million. Sales are currently down 8.5% from one year ago. Durable goods increased $3.0 billion or 1.2% to $254.4 billion in December. This increase makes two consecutive months of gains.
Table of Contents
Fixed Income
FOMC January Statement Federal Reserve Dot Plots Dec 18 US Debt Measurement– January Meeting Minutes US Corporate Debt Tops $6 Trillion. Treasury.gov yields
Global Bond Yields
Foreign Exchange Market
Energy Complex
The Baker Hughes rig count declined by 4 this week. There are 1047 oil and gas rigs operating in the US – Up 69 over last year.
Metals Complex
Gold continues to creep higher, trading up 0.81% in 6 days.
Employment Picture
The economy continues to create jobs and the labor participation rate is starting to creep up after bottoming at 62.4% in September 2015
Weekly Unemployment Claims – Released Thursday 2/21 – In the week ending February 16, initial claims were 216k a decrease of 23k from the previous week’s unrevised level. The 4-week moving average was 235,750 an increase of 4,000 from the previous week’s unrevised average.
https://fred.stlouisfed.org/graph/?g=mVIl
Job Openings & Labor Turnover Survey JOLTS – Released Tuesday 2/12– The number of job openings increased to a series high of 7.3 million on the last business day of December, the U.S. Bureau of Labor Statistics reported. Over the month, hires were little changed at 5.9 million, quits increased slightly to 3.5 million, and total separations were little changed at 5.5 million. Within separations, the quits rate and the layoffs and discharges rates were unchanged at 2.3 percent and 1.1 percent, respectively.
https://fred.stlouisfed.org/graph/?g=lSNf
January Jobs Report – BLS Summary Released 2/1 – The US Economy added 304k nonfarm jobs in January and the Unemployment rate increased to 4%. Hourly eearningsrose The December report was revised down 90k though. Hiring highlights to include Education and Health care +55k, Leisure and Hospitality +74k, Professional and Business Services +30k, Construction +52k, and Transportation and Warehousing +27k.
Employment Cost Index – Released 1/31/19 – Compensation costs for civilian workers increased by 2.9% for the 12-month period ending in December 2018 compared with a compensation costs increase of 2.6% in December 2017. Wages and salaries were up 3.1%, versus 2.5% for the 12-month period ending December 2017. Benefit costs increased by 2.8%, versus 2.5% in December 2017. For private industry workers, compensation costs increased 3.0% year-over-year, versus 2.6% for the 12 months ending December 2017. Wages and salaries increased 3.1% year-over-year, versus 2.8% for the 12 months ending December 2017. Benefit costs increased by 2.6%, versus 2.3% for the 12 months ending December 2017. This report is published quarterly.
This Week’s Economic Data
Links take you to the data source
Existing Home Sales – Released 2/21 – Existing home sales decreased by 1.2% in January. Sales decreased to a seasonally adjusted rate of 4.94 million. Sales are currently down 8.5% from one year ago. Housing inventory increased to 3.9 months of inventory and the existing homes for sale declined to 1.59 million. The median sales price for all types of homes was $247,500, up 2.8% year/y.
Durable Goods – Released 2/21 – New orders for manufactured durable goods increased $3.0 billion or 1.2% to $254.4 billion in December. This increase makes two consecutive months of gains. Transportation equipment, up 3.3%, drove the increase by $2.8 billion to $90.2 billion.
Recent Economic Data
Links take you to the data source
Industrial Production and Capacity Utilization – Released 2/15 – Industrial production declined by 0.6% in January following a 0.1% increase in December. Manufacturing output was also on the decline falling by 0.9%. The decline resulted primarily from a large drop in motor vehicle assemblies. Capacity utilization declined 0.6% to78.2%. Utilization is 1.6% below its long run (1972-2018) average.
Retail Sales – Released 2/14 – U.S. retail sales for December 2018, were $505.8 billion, a decrease of 1.2% from the previous month, but 2.3% above December 2017. Total sales for the 12 months of 2018 were up 5.0%.
Producer Price Index – Released 2/14 – The Producer Price Index for final demand declined 0.1% in January. Core PPI (less food and energy) increased 0.3%. Year over year the index for final demand rose 2.0%.
Consumer Price Index – Released 2/13 – The Consumer Price Index was unchanged in January. Core CPI, which excludes food and energy increased 0.2%. The monthly changes left total CPI up 1.6% year-over-year and core CPI up 2.2%.
Consumer Credit – Released 2/7 – Consumer credit increased at a seasonally adjusted annual rate of 6.5% in the fourth quarter and at a rate of 5% in December. For the 2018 calendar year, consumer credit increased 5%, with revolving and nonrevolving credit increasing 2.75% and 5.5% respectively.
U.S. Trade Balance – Released 2/6 – The U.S. Trade deficit was $49.3 billion in November, down $6.4 billion from $55.7 billion in October, November exports were $209.9 billion, $1.3 billion less than October exports. November imports were $259.2 billion, $7.7 billion less than October imports.
PMI Non-Manufacturing Index (ISM Services) – Released 2/5 – Economic activity in the non-manufacturing sector grew in January for the 108th consecutive month. ISM Non-Manufacturing registered 56.7 percent, which is 1.3 percentage points lower than the December reading of 58 percent. This represents continued growth in the non-manufacturing sector, at a slower rate.
PMI Manufacturing ISM Index – Released 2/1 – December PMI increased 2.3% to 56.6% from December’s reading of 54.3%. The New Orders Index was up 6.9% to 51.3%. The Production Index registered 60.5% up 6.4%.
U.S. Construction Spending – Released 2/1 – Construction spending increased slightly by 0.8% in November measuring at a seasonally adjusted annual rate of $1,299.9 billion. The November figure is 3.4% above the November 2017 estimate. Private construction spending was 1.3% above the revised October estimate.
New Residential Sales – Released 1/31 – Last month sales of new single-family homes increased by 16.9% to 657k, seasonally adjusted. The median sales price of new homes sold in November was $302.40k with an average sales price of $362.40k. At the end of November, the seasonally adjusted estimate of new homes for sale was 330k. This represents a supply of 6.0 months at the current sales rate.
Chicago PMI – Released 1/31 – Chicago PMI decreased 7.1 points in January easing to 56.7, down from 63.8 in December. The Prices Paid indicator was unchanged for the month ending a five consecutive monthly decline.
Consumer Confidence – Released 1/29 – The Consumer confidence index declined in January. The Index now shows a reading of 120.2 down from 126.6 in December. Despite the decline in January and despite weakened expectations regarding job prospects and business conditions, consumer confidence levels suggest economic conditions remain favorable. Expectations declined sharply due to financial market volatility and the government shutdown. Consumers’ assessment of the current conditions was little changed. This marks three months in a row of decline in consumer confidence. Back to back declines in Consumer Confidence reflect a growing concern of a moderating pace of economic growth in 2019.
Personal Income – Released 12/21 – (Delayed release due to gov’t shutdown) Personal Income increased 0.2% in November according to the BEA. The majority of this increase was due to increases in wages and salaries and increases in farm proprietor’s income. Real PCE (the Feds preferred inflation gauge) increased by 0.3%. Real disposable personal income increased by 0.2%. Real Personal Consumption Expenditures (PCE) has risen 1.8% y/y.
3rd Estimate of 3rd Quarter GDP – Released 12/21 – (Delayed release due to gov’t shutdown) According to the third estimate released by the Bureau of Economic Analysis, Real Gross Domestic Product (Real GDP) increased at an annual rate of 3.4% in the third quarter of 2018. This result is slightly lower by 0.1% from 3.5% seen in the second estimate. The general outlook of real GDP remains roughly the same. The third estimate data provided an upward revision to private inventory investment. Downward revisions were reflected in personal consumption expenditures (PCE) and exports.
US Light Vehicle Sales – Released 12/6 – (Delayed release due to gov’t shutdown) U.S. light vehicle sales were at a seasonally adjusted annual rate (SAAR) of 17.40 million units in November versus a SAAR of 17.49 million units in October. The November run rate was down 0.7% from the SAAR of 17.52 million units for November 2017.
Housing Starts – Released 12/18 – (Delayed release due to gov’t shutdown) New home starts in November were at a seasonally adjusted rate of 1.256 million; up 3.2% above October and down 3.6% from last November. Building Permits were at a seasonally adjusted rate of 1.328 million, up 5.0% compared to last month and up 0.4% over last year.
Data Sources:
Bureau of Economic Analysis (BEA)
Congressional Budget Office (CBO)
U.S. Bureau of Labor Statistics (BLS)
Federal Reserve Economic Data (FRED Charts)
CME Fed Watch
U.S. Treasury – Yields
U.S. Census Bureau
Institute for Supply Management (ISM)
Weekly DOL Employment Data
BLS Monthly Jobs Report
JOLTS
US Energy Admn (EIA)
BLS Consumer Price Index CPI
BLS Producer Price Index PPI
Atlanta Fed GDPNOW
NY Fed Nowcast GDP
US Census Bureau Housing Starts
Consumer Credit
USCB Retail Sales
Construction Spending
Federal Reserve Dot Plots
NY Empire Index
Philadelphia Federal Reserve
P/E Ratio Data -Yardeni Research
Technical Analysis Info:
StockCharts.com – Financial Charts
Exponential vs Simple moving average
Other Links:
1973 Arab Oil Embargo
Hunt Brothers Silver
Long-Term Capital bailout
Categories:
Tags: