Markets were undeterred this week and closed again at new all-time highs. All of the 11 S&P sectors closed higher, real estate +4.8%, led, followed by discretionary +2.6%, utilities +2.4%, and tech +2.3%. Energy underperformed despite a bounce in crude oil. It’s fair to say that the coronavirus remains a looming threat, at least based on the rising number of cases, now at 71k. The market, though, remains assured that it will eventually die down and a very accommodative monetary policy will continue to support equities.
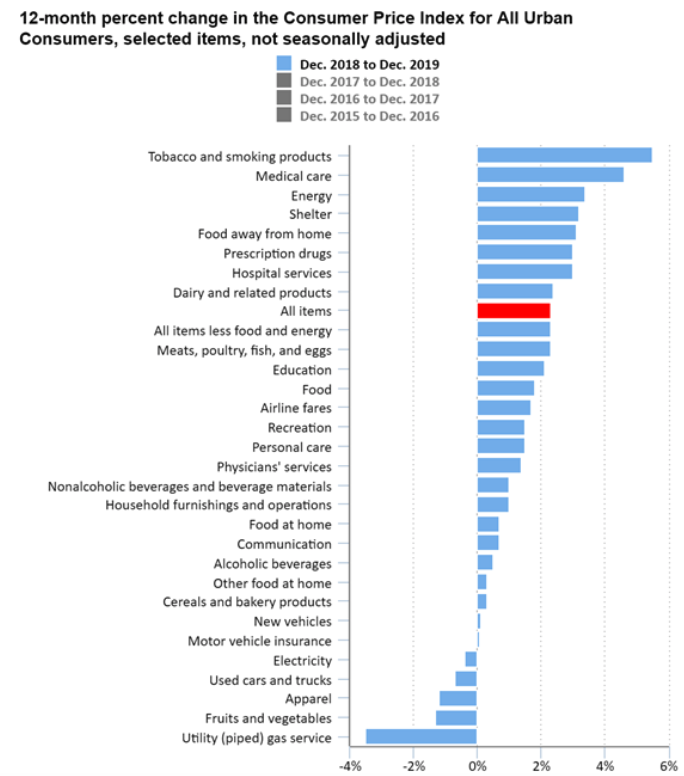
Notable on the economic front, the Consumer Price Index rose just 0.1 percent in January. Over the last 12 months, the all items index increased 2.5 percent before seasonal adjustment. Below is the latest annualized change in the basket. Tobacco, Medical, Shelter and “food away from home” were the big gainers. You have to give it to the food delivery services, they make it easy these days…

Fixed Income
FOMC December Statement Federal Reserve Dot Plots US Debt Measurement US Corporate Debt Tops $6 Trillion Treasury.gov yields
FOMC Policy Normalization Statement
Global Bond Yields
US Treasuries under one year are inverted with the one-year, two-year, and five-year yields.
Daily US Treasury Yields
Foreign Exchange Market
Energy Complex
The Baker Hughes rig count was flat this week. There are 790 oil and gas rigs operating in the US – down 261 over last year.
- Brent Crude Oil gained 5.23% this week closing at $57.32/bbl
- WTI Crude Oil gained 3.44% this week to close at $52.05/bbl
- Heating Oil gained 3.34% this week closing at $1.70/gallon
- Natural Gas lost 1.13% this week closing at $1.84 per million BTUs
- Unleaded Gas gained 13.35% this week closing at $1.73/gallon
Metals Complex
- Gold gained 0.83% this week closing at $1586.40/oz
- Silver gained 0.24% on the week closing at $17.73/oz
- Palladium gained 4.82% this week closing at $2316.70/oz
- Platinum lost 0.04% this week closing at $968.80/oz
- Copper gained 1.82% this week closing at $2.60/lb
Employment Picture
Weekly Unemployment Claims – Released Thursday 2/13/2020 – In the week ending February 8th, initial claims were 205,000, an increase of 2,000 from the previous week’s revised level. The 4-week moving average was 212,000, unchanged from the previous week’s revised average.
Job Openings & Labor Turnover Survey JOLTS – Released 2/11/2020 – The U.S. Bureau of Labor Statistics reported the number of job openings declined from 6.8 million to 6.4 million on the last business day of December. Over the month, hires and separations were little changed at 5.9 million and 5.7 million, respectively. Within separations, the quits rate was unchanged at 2.3%. The layoffs and discharges rate was little changed at 1.2%.
January Jobs Report – BLS Summary – Released 2/7/2020 – The US Economy added 225k nonfarm jobs in January and the Unemployment rate was little changed at 3.6%. Average hourly earnings increased by 7 cents. Hiring highlights include Education and Health Services +72k, Construction +44k, and Leisure and Hospitality +36k.
- Average hourly earnings increased by 7 cents in January, y/y hourly earnings are up 3.1%.
- U3 unemployment rate was little changed at 3.6%. U6 unemployment rate increased 0.2% to 6.9%.
- The labor force participation rate increased by 0.2% in January to 63.4%.
- Average workweek was unchanged at 34.3 hours.
Employment Cost Index – Released 1/31/2020 – Compensation costs for civilian workers increased 0.7% for the 3-month period ending in December 2019. The 12 month period ending in December 2019 saw compensation costs increase by 2.7%, 0.2% less than the 12 month period ending December 2018. Wages and salaries were up 2.9% for the 12-month period ending December 2019 compared to 3.1% for the 12 month period ending December 2018. Benefit costs increased 2.2% for the 12-month period ending December 2019. For private industry workers, compensation costs increased 2.7% year-over-year, versus 3.0% for the 12 months ending December 2018. This report is published quarterly.
This Week’s Economic Data
Links take you to the data source
Industrial Production and Capacity Utilization – Released 2/14 – In January Industrial production declined 0.3%. Unseasonably warm weather resulted in a lower output from utilities. Manufacturing declined 0.1% and mining was up 1.2%. Industrial production was 0.8% lower year/y. Total capacity utilization declined 0.3% to 76.8% in January which is 3.0% below its long-run average.
Retail Sales – Released 2/14 – U.S. retail sales for January increased 0.3% to $529.8 billion. U.S. retail sales are up 4.4% year/y.
Consumer Price Index – Released 2/13 – The Consumer Price Index gained 0.1% in January. Core CPI, which excludes food and energy increased 0.2%. The monthly changes left total CPI up 2.5% year-over-year and core CPI up 2.3%.
Recent Economic Data
Links take you to the data source
Consumer Credit – Released 2/7 – Consumer credit increased at a seasonally adjusted annual rate of 4.75% in 2019. Revolving and nonrevolving credit increased at annual rates of 4.25% and increased 4.75% respectively. Consumer credit increased at a seasonally adjusted annual rate of 5 percent in the fourth quarter and at a rate of 6-1/4 percent in December. Total Outstanding consumer credit is currently at $4.197 trillion.
U.S. Trade Balance – Released 2/6 – According to the U.S. Census Bureau of Economic Analysis, the goods and services deficit increased in December to $48.9 billion. This increase is $5.2 billion higher than the deficit recorded in November. December exports were $209.6 billion, $1.6 billion more than November exports. December imports were $258.5 billion, $6.8 billion more than November imports. The goods and services deficit increased $10.9 billion or 1.7% in 2019. In 2019 exports and imports decreased $1.5 billion or 0.1% and decreased $12.5 billion or 0.4% respectively.
PMI Non-Manufacturing Index (ISM Services) – Released 2/5 – Economic activity in the non-manufacturing sector grew in January for the 120th consecutive month. ISM Non-Manufacturing registered 55.5 percent, which is 0.6 percentage points above the adjusted December reading of 54.9 percent. This represents continued growth in the non-manufacturing sector, at a faster rate.
PMI Manufacturing ISM Index – Released 2/3 – January PMI increased by 3.1% to 50.9% from December’s reading of 47.8%. The New Orders Index was up 4.4% from December’s reading of 47.6% to 52.0%. The Production Index registered 54.3% up 9.5%.
U.S. Construction Spending – Released 2/3 – Construction spending declined 0.2% in December measuring at a seasonally adjusted annual rate of $1,327.7 billion. The December figure is 5.0% above the December 2018 estimate. Private construction spending was 0.1% below the revised November estimate at $991.2 billion. Public construction spending was 0.4% below the revised November estimate at $336.4 billion.
Chicago PMI – Released 1/31 – Chicago PMI fell 6 points in January declining to 42.9, down from 48.9 in December. This decline follows two months of gains and marks the lowest level since December 2015. The index is now in contractionary territory for five consecutive months. All five of the major components were down on the month with Order Backlogs leading the way followed by New Orders.
Personal Income – Released 1/31 – Personal Income increased 0.2% in December according to the BEA. The majority of the increase in December was due to increases in compensation of employees and personal interest income that were partially offset by a decline in farm proprietor’s income. Real PCE (the Feds preferred inflation gauge) increased 0.1% in December. Real disposable personal income decreased 0.1% in December.
Advance Estimate of 4th Quarter and Year 2019 GDP – Released 1/30 – According to the Advance Estimate released by the Bureau of Economic Analysis, Real Gross Domestic Product (Real GDP) increased at an annual rate of 2.1% in the fourth quarter of 2019. The advance estimate is based on data that are incomplete or subject to further revision. The fourth-quarter increase in real GDP observed positive contributions from personal consumption expenditures (PCE), federal gov’t spending, state and local gov’t spending, residential fixed investment, and exports that were partly offset by negative contributions from private inventory investment, nonresidential fixed investment, and imports (which decreased). The Second Estimate of fourth-quarter GDP growth, which is based on more complete data, will be released on February 27, 2020.
Consumer Confidence – Released 1/28 – The Consumer confidence index increased in January following a moderate increase in December. The Index now shows a reading of 131.6 which is up from 128.2 in December. Consumers’ confidence increased in January primarily due to a more positive assessment of the current job market.
New Residential Sales – Released 1/27 – Sales of new single-family homes declined 0.4% to 694k, seasonally adjusted, in December. The median sales price of new homes sold in December was $331.4k with an average sales price of $384.5k. At the end of December, the seasonally adjusted estimate of new homes for sale was 327k. This represents a supply of 5.7 months at the current sales rate.
Durable Goods – Released 1/27 – New orders for manufactured durable goods decreased $5.7 billion or 2.4% to $245.5 billion in December. The increase in December follows a 3.1% decrease in November. Transportation equipment drove the increase; up $5.9 billion or 7.6%.
Existing Home Sales – Released 1/22 – Existing home sales increased in December. Sales increased 3.6% to a seasonally adjusted rate of 5.54 million. Sales are currently up 10.8% from one year ago. Housing inventory declined from 3.7 months of inventory to 3.0 months of unsold inventory and the total housing inventory declined from 1.64 million to 1.40 million. The median sales price for all types of homes was $274,500, up 7.8% year/y.
Housing Starts – Released 1/17 – New home starts in December were at a seasonally adjusted rate of 1.608 million; up 16.9% above November and 40.8% above last December’s rate. Building Permits were at a seasonally adjusted rate of 1.416 million, down 3.9% compared to November but up 5.8% over last year.
Producer Price Index – Released 1/15 – The Producer Price Index for final demand was little changed in December increasing 0.1%. Core PPI was up 0.1%. Year over year the index for final demand rose 1.3%.
US Light Vehicle Sales – Released 9/4 – U.S. light vehicle sales were at a seasonally adjusted annual rate (SAAR) of 17.07 million units in August versus a SAAR of 16.82 million units in July.
Next week we get data on PPI, Housing Starts, and Existing Home Sales.
Data Sources:
Bureau of Economic Analysis (BEA)
Congressional Budget Office (CBO)
U.S. Bureau of Labor Statistics (BLS)
Federal Reserve Economic Data (FRED Charts)
CME Fed Watch
U.S. Treasury – Yields
U.S. Census Bureau
Institute for Supply Management (ISM)
Weekly DOL Employment Data
BLS Monthly Jobs Report
JOLTS
US Energy Admin (EIA)
BLS Consumer Price Index CPI
BLS Producer Price Index PPI
Atlanta Fed GDPNOW
NY Fed Nowcast GDP
US Census Bureau Housing Starts
Consumer Credit
USCB Retail Sales
Construction Spending
Federal Reserve Dot Plots
NY Empire Index
Philadelphia Federal Reserve
P/E Ratio Data -Yardeni Research
Technical Analysis Info:
StockCharts.com – Financial Charts
Exponential vs Simple moving average
Other Links:
1973 Arab Oil Embargo
Hunt Brothers Silver
Long-Term Capital bailout


Week 7 Talking Points
Markets were undeterred this week and closed again at new all-time highs. All of the 11 S&P sectors closed higher, real estate +4.8%, led, followed by discretionary +2.6%, utilities +2.4%, and tech +2.3%. Energy underperformed despite a bounce in crude oil. It’s fair to say that the coronavirus remains a looming threat, at least based on the rising number of cases, now at 71k. The market, though, remains assured that it will eventually die down and a very accommodative monetary policy will continue to support equities.
Notable on the economic front, the Consumer Price Index rose just 0.1 percent in January. Over the last 12 months, the all items index increased 2.5 percent before seasonal adjustment. Below is the latest annualized change in the basket. Tobacco, Medical, Shelter and “food away from home” were the big gainers. You have to give it to the food delivery services, they make it easy these days…
Table of Contents
Fixed Income
FOMC December Statement Federal Reserve Dot Plots US Debt Measurement US Corporate Debt Tops $6 Trillion Treasury.gov yields
FOMC Policy Normalization Statement
Global Bond Yields
US Treasuries under one year are inverted with the one-year, two-year, and five-year yields.
Daily US Treasury Yields
Foreign Exchange Market
Energy Complex
The Baker Hughes rig count was flat this week. There are 790 oil and gas rigs operating in the US – down 261 over last year.
Metals Complex
Employment Picture
Weekly Unemployment Claims – Released Thursday 2/13/2020 – In the week ending February 8th, initial claims were 205,000, an increase of 2,000 from the previous week’s revised level. The 4-week moving average was 212,000, unchanged from the previous week’s revised average.
Job Openings & Labor Turnover Survey JOLTS – Released 2/11/2020 – The U.S. Bureau of Labor Statistics reported the number of job openings declined from 6.8 million to 6.4 million on the last business day of December. Over the month, hires and separations were little changed at 5.9 million and 5.7 million, respectively. Within separations, the quits rate was unchanged at 2.3%. The layoffs and discharges rate was little changed at 1.2%.
January Jobs Report – BLS Summary – Released 2/7/2020 – The US Economy added 225k nonfarm jobs in January and the Unemployment rate was little changed at 3.6%. Average hourly earnings increased by 7 cents. Hiring highlights include Education and Health Services +72k, Construction +44k, and Leisure and Hospitality +36k.
Employment Cost Index – Released 1/31/2020 – Compensation costs for civilian workers increased 0.7% for the 3-month period ending in December 2019. The 12 month period ending in December 2019 saw compensation costs increase by 2.7%, 0.2% less than the 12 month period ending December 2018. Wages and salaries were up 2.9% for the 12-month period ending December 2019 compared to 3.1% for the 12 month period ending December 2018. Benefit costs increased 2.2% for the 12-month period ending December 2019. For private industry workers, compensation costs increased 2.7% year-over-year, versus 3.0% for the 12 months ending December 2018. This report is published quarterly.
This Week’s Economic Data
Links take you to the data source
Industrial Production and Capacity Utilization – Released 2/14 – In January Industrial production declined 0.3%. Unseasonably warm weather resulted in a lower output from utilities. Manufacturing declined 0.1% and mining was up 1.2%. Industrial production was 0.8% lower year/y. Total capacity utilization declined 0.3% to 76.8% in January which is 3.0% below its long-run average.
Retail Sales – Released 2/14 – U.S. retail sales for January increased 0.3% to $529.8 billion. U.S. retail sales are up 4.4% year/y.
Consumer Price Index – Released 2/13 – The Consumer Price Index gained 0.1% in January. Core CPI, which excludes food and energy increased 0.2%. The monthly changes left total CPI up 2.5% year-over-year and core CPI up 2.3%.
Recent Economic Data
Links take you to the data source
Consumer Credit – Released 2/7 – Consumer credit increased at a seasonally adjusted annual rate of 4.75% in 2019. Revolving and nonrevolving credit increased at annual rates of 4.25% and increased 4.75% respectively. Consumer credit increased at a seasonally adjusted annual rate of 5 percent in the fourth quarter and at a rate of 6-1/4 percent in December. Total Outstanding consumer credit is currently at $4.197 trillion.
U.S. Trade Balance – Released 2/6 – According to the U.S. Census Bureau of Economic Analysis, the goods and services deficit increased in December to $48.9 billion. This increase is $5.2 billion higher than the deficit recorded in November. December exports were $209.6 billion, $1.6 billion more than November exports. December imports were $258.5 billion, $6.8 billion more than November imports. The goods and services deficit increased $10.9 billion or 1.7% in 2019. In 2019 exports and imports decreased $1.5 billion or 0.1% and decreased $12.5 billion or 0.4% respectively.
PMI Non-Manufacturing Index (ISM Services) – Released 2/5 – Economic activity in the non-manufacturing sector grew in January for the 120th consecutive month. ISM Non-Manufacturing registered 55.5 percent, which is 0.6 percentage points above the adjusted December reading of 54.9 percent. This represents continued growth in the non-manufacturing sector, at a faster rate.
PMI Manufacturing ISM Index – Released 2/3 – January PMI increased by 3.1% to 50.9% from December’s reading of 47.8%. The New Orders Index was up 4.4% from December’s reading of 47.6% to 52.0%. The Production Index registered 54.3% up 9.5%.
U.S. Construction Spending – Released 2/3 – Construction spending declined 0.2% in December measuring at a seasonally adjusted annual rate of $1,327.7 billion. The December figure is 5.0% above the December 2018 estimate. Private construction spending was 0.1% below the revised November estimate at $991.2 billion. Public construction spending was 0.4% below the revised November estimate at $336.4 billion.
Chicago PMI – Released 1/31 – Chicago PMI fell 6 points in January declining to 42.9, down from 48.9 in December. This decline follows two months of gains and marks the lowest level since December 2015. The index is now in contractionary territory for five consecutive months. All five of the major components were down on the month with Order Backlogs leading the way followed by New Orders.
Personal Income – Released 1/31 – Personal Income increased 0.2% in December according to the BEA. The majority of the increase in December was due to increases in compensation of employees and personal interest income that were partially offset by a decline in farm proprietor’s income. Real PCE (the Feds preferred inflation gauge) increased 0.1% in December. Real disposable personal income decreased 0.1% in December.
Advance Estimate of 4th Quarter and Year 2019 GDP – Released 1/30 – According to the Advance Estimate released by the Bureau of Economic Analysis, Real Gross Domestic Product (Real GDP) increased at an annual rate of 2.1% in the fourth quarter of 2019. The advance estimate is based on data that are incomplete or subject to further revision. The fourth-quarter increase in real GDP observed positive contributions from personal consumption expenditures (PCE), federal gov’t spending, state and local gov’t spending, residential fixed investment, and exports that were partly offset by negative contributions from private inventory investment, nonresidential fixed investment, and imports (which decreased). The Second Estimate of fourth-quarter GDP growth, which is based on more complete data, will be released on February 27, 2020.
Consumer Confidence – Released 1/28 – The Consumer confidence index increased in January following a moderate increase in December. The Index now shows a reading of 131.6 which is up from 128.2 in December. Consumers’ confidence increased in January primarily due to a more positive assessment of the current job market.
New Residential Sales – Released 1/27 – Sales of new single-family homes declined 0.4% to 694k, seasonally adjusted, in December. The median sales price of new homes sold in December was $331.4k with an average sales price of $384.5k. At the end of December, the seasonally adjusted estimate of new homes for sale was 327k. This represents a supply of 5.7 months at the current sales rate.
Durable Goods – Released 1/27 – New orders for manufactured durable goods decreased $5.7 billion or 2.4% to $245.5 billion in December. The increase in December follows a 3.1% decrease in November. Transportation equipment drove the increase; up $5.9 billion or 7.6%.
Existing Home Sales – Released 1/22 – Existing home sales increased in December. Sales increased 3.6% to a seasonally adjusted rate of 5.54 million. Sales are currently up 10.8% from one year ago. Housing inventory declined from 3.7 months of inventory to 3.0 months of unsold inventory and the total housing inventory declined from 1.64 million to 1.40 million. The median sales price for all types of homes was $274,500, up 7.8% year/y.
Housing Starts – Released 1/17 – New home starts in December were at a seasonally adjusted rate of 1.608 million; up 16.9% above November and 40.8% above last December’s rate. Building Permits were at a seasonally adjusted rate of 1.416 million, down 3.9% compared to November but up 5.8% over last year.
Producer Price Index – Released 1/15 – The Producer Price Index for final demand was little changed in December increasing 0.1%. Core PPI was up 0.1%. Year over year the index for final demand rose 1.3%.
US Light Vehicle Sales – Released 9/4 – U.S. light vehicle sales were at a seasonally adjusted annual rate (SAAR) of 17.07 million units in August versus a SAAR of 16.82 million units in July.
Next week we get data on PPI, Housing Starts, and Existing Home Sales.
Data Sources:
Bureau of Economic Analysis (BEA)
Congressional Budget Office (CBO)
U.S. Bureau of Labor Statistics (BLS)
Federal Reserve Economic Data (FRED Charts)
CME Fed Watch
U.S. Treasury – Yields
U.S. Census Bureau
Institute for Supply Management (ISM)
Weekly DOL Employment Data
BLS Monthly Jobs Report
JOLTS
US Energy Admin (EIA)
BLS Consumer Price Index CPI
BLS Producer Price Index PPI
Atlanta Fed GDPNOW
NY Fed Nowcast GDP
US Census Bureau Housing Starts
Consumer Credit
USCB Retail Sales
Construction Spending
Federal Reserve Dot Plots
NY Empire Index
Philadelphia Federal Reserve
P/E Ratio Data -Yardeni Research
Technical Analysis Info:
StockCharts.com – Financial Charts
Exponential vs Simple moving average
Other Links:
1973 Arab Oil Embargo
Hunt Brothers Silver
Long-Term Capital bailout
Categories:
Tags: