Good Life Advisors – Talking Points – Week 48
US equities were slightly higher this week, with the S&P 500 rising above the 200 DMA for the first time since April while the Dow exited a bear market after Wednesday’s big rally. Communication services was the leader with strength across most FANMAGs, NFLX and META. Apple was a bit of a drag on tech hardware after the latest reports around production disruptions in China. Treasuries were firmer across the curve, down around 20 bp for the week across all durations from 2Y and out. The 2Y yield ended the week below 4.3%, the lowest level since early October, while the 10Y ended the week below 3.5%. The dollar index was down 1.2%, falling at one point to the lowest level since June. Golde finished the week up 3.2%. Bitcoin Futures were up around 2.5%. WTI Crude was up 4.85% for the week.
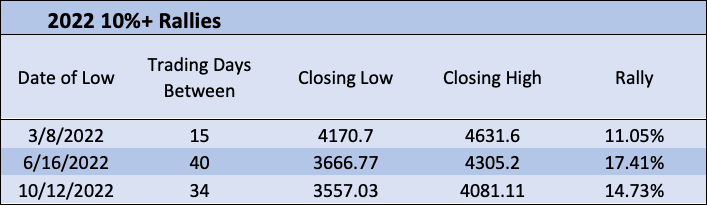
We’ve had three 10% or larger rallies in 2022.

Powell doesn’t push back against easing financial conditions: In a speech at Brookings, Fed Chair Powell signaled that the Fed would downshift the pace of rate hikes to 50 bp this month. However, Powell also reiterated that the peak fed funds rate will need to be somewhat higher than what was projected in the September SEP, and noted tight labor market metrics need to come down to a level consistent with 2% inflation. While there wasn’t much incremental from Powell given his continued “higher-for longer” messaging, takeaways were dovish given Powell didn’t pull a repeat of his Jackson Hole pushback against a loosening of financial conditions driven by peak inflation traction. The comments sparked a big equity and Treasury rally given the support around peak-Fed narrative, though the week’s strong batch of economic data (particularly Friday’s payrolls report) pushed market expectations for the pead fed funds rate higher, up by one 25 bp hike to 5-5.25% by May-23. However, JPMorgan analysts said this week markets are firmly pricing in the higher-for-longer stance, taking out some risk of an upside surprise to the Fed tightening path.
Strong labor market, weak inflation data complicate outlook: There was some focus this week on a growing case for a soft landing given inflation has started to come down while the labor market remains resilient. Labor market strength was seen in Friday’s November nonfarm payrolls report, which saw an increase of 263k, ahead of 200k consensus. Average hourly wages were also higher, up 0.6% m/m against 0.3% consensus. The report helped alleviate some 2023 growth fears, though the wage dynamic may complicate the Fed policy path. This week also saw more support around the peak-inflation narrative, including October core PCE of 0.2% m/m below 0.3% consensus. November ISM manufacturing fell into contraction territory for the first time since May-20, though the prices index fell 3.6 points to 43, the lowest since that May-20 bottom. US gasoline prices also continued to fall, dropping to the lowest level since just before Russia’s invasion of Ukraine (Washington Post).
Positioning, dollar, rates remain supports: In addition to the Powell/ rates tailwind, JPMorgan analysts said stocks were boosted by month-end moves, including a potential $10B buy from leveraged ETFs and systematic funds, while there was also some press focus on bullish options positioning (Bloomberg). Bank of America’s sell-side indicator also came closest to a buy signal since 2017 this week (Bloomberg), though the bank’s latest Flow Show said. Dollar weakness again continued to help stem some of the worries around earnings risk and multiple compression, while analysts expect dollar strength to continue to coll as the market better grasps the Fed’s trajectory (Bloomberg). However, some of the key overhangs remain, including 2023 growth fears, high-profile while collar layoffs, unrelenting Fed “higher-for-longer” messaging, and earnings risks (inflation, geopolitics, central bank overtightening) into 2023. The yield curve fell into deeper inversion this week, signaling market fears of an impending recession (Bloomberg).
This week saw a number of updates highlighting China Covid control policy relaxation, which helped improve sentiment around Chinese demand and eased some fears around potential global supply chain disruptions. China’s Vice President Premier Sun said this week that with more people vaccinated and the omicron variant less pathogenic, China’s fight against the pandemic is at a new stage. China has also considered rolling out a fourth vaccine round (Bloomberg) and will push more vaccinations among its senior citizens (Bloomberg), which are policies seen as essential in the reopening process.
Fixed Income
Yield Curve
November FOMC Statement November Fed Minutes Balance Sheet Reduction Plan Credit, Liquidity and Balance Sheet Federal Reserve Dot Plots
Treasury.gov yields FOMC Policy Normalization Statement Longer- Run Goals Jan 2022
Foreign Exchange Market
Energy Complex
The Baker Hughes rig count was flat this week. There are 784 oil and gas rigs operating in the US – Up 215 over last year.
Metals Complex
Employment Picture
Weekly Unemployment Claims – Released Thursday 11/23/2022 – The week ending November 19th observed an increase of 17k in initial claims increasing to 240k. The four-week moving average of initial jobless claims increased 5.5k to 226.75k.
October Jobs Report – BLS Summary – Released 11/4/2022 – The US Economy added 261k nonfarm jobs in October and the Unemployment rate increased 0.2% to 3.7%. Average hourly earnings increased 12 to $32.58. Hiring highlights include +79k Education and Health Services, +35k Leisure and Hospitality, and +39k Professional and Business Services.
- Average hourly earnings increased 12 cents to $32.58.
- U3 unemployment rate remained increased 0.2% to 3.7%. U6 unemployment rate increased 0.1% to 6.8%.
- The labor force participation rate was little changed at 62.2%.
- Average work week was unchanged at 34.5 hours.
Job Openings & Labor Turnover Survey – JOLTS – Released 11/1/2022 – The US Bureau of Labor Statistics reported the number and rate of job openings increased to 10.7 million on the last business day of September. Over the month, hires declined to 6.1 million and separations declined to 5.7 million. Within separations, quits were little changed at 4.1 million. The layoffs and discharges rates declined to 1.3 million.
Employment Cost Index – Released 10/28/2022 – Compensation costs for civilian workers increased 1.2% for the 3-month period ending in September 2022. The 12-month period ending in September 2022 saw compensation costs increase by 5%. The 12-month period ending September 2021 increased 3.7%. Wages and salaries increased 5.1% over the year and increased 4.2% for the 12-month period ending in September 2021. Benefit costs increased 4.9% over the year and increased 2.5% for the 12-month period ending in September 2021. This report is published quarterly.
This Week’s Economic Data
Links take you to the data source
Durable Goods – Released 11/23/2022 – New orders for manufactured durable goods in October increased $2.8 billion or 1% to $277.4 billion. Transportation equipment led the increase up $2 billion or 2.1% to $97.8 billion.
New Residential Sales – Released 11/23/2022 – Sales of new single-family homes increased 7.5% to 632k, seasonally adjusted, in October. The median sales price of new homes sold in October was $493,000 with an average sales price of $544,000. At the end of October, the seasonally adjusted estimate of new homes for sale was 470k. This represents a supply of 8.9 months at the current sales rate.
Recent Economic Date
Links take you to the data source
Existing Home Sales – Released 11/18/2022 – Existing home sales decreased in October marking nine consecutive months of declines. Sales declined 5.9% to a seasonally adjusted rate of 4.43 million in October. Sales decreased 28.4% year-over-year. Housing inventory sits at 1.22 million units. Down 0.8% from September’s inventory, and down 0.8% over last year. Unsold inventory sits at a 3.3-month supply. The median existing home price for all housing types was $379,100 which is up 6.6% from October 2021. This marks 128 consecutive months of year-over-year increases, the longest-running streak on record.
Housing Starts – Released 11/17/2022 – New home starts in October were at a seasonally adjusted annual rate of 1.425 million; down 4.2% below September, and 8.8% below last October’s rate. Building Permits were at a seasonally adjusted annual rate of 1.526 million down 2.4% compared to September, and down 10.1% over last year.
Industrial Production and Capacity Utilization – Released 11/16/2022 – In October, Industrial production decreased 0.1%. Manufacturing increased 0.1%. Utilities output decreased 1.5%. Mining output decreased 0.4%. Total industrial production was 3.3% higher in October than a year ago. Total capacity utilization decreased 0.2% in October to 79.9% which is 0.3% above its long run average.
Retail Sales – Released 11/16/2022 – US retail sales for October increased 1.3% to $694.5 billion and retail sales are 8.3% above October 2021. US retail sales for the August 2022 through October 2022 period were up 8.9% from the same period a year ago.
Producer Price Index – Released 11/15/2022 – The Producer Price Index for final demand increased 0.2% in October. PPI less food and energy declined 0.1%. The chang in PPI for final demand has increased 8% year/y.
Consumer Price Index – Released 11/10/2022 – Consumer prices increased less than expected rising 0.4% m/m. in October following a 0.4% increase in September. Consumer prices are up 7.7% for the 12-month period ending in October. Core consumer prices increased 0.3% m/m in October.
Consumer Credit – Released 11/7/2022 – Consumer credit increased at a seasonally adjusted annual rate of 6.8% in the third quarter of 2022. Revolving credit increased at an annual rate of 12.9%, while nonrevolving credit increased at an annual rate of 4.9%. In September, consumer credit increased at an annual rate of 6.4%.
US Light Vehicle Sales – Released 11/4/2022 – US light vehicle sales were at a seasonally adjusted annual rate of 14.897 million units in October.
U.S. Trade Balance – Released 11/3/2022 – According to the US Census Bureau of Economic Analysis, the goods and services deficit increased in September by $7.6 billion to $73.3 billion. September exports were $258 billion, $2.8 billion less than August exports. September imports were $331.3 billion, $4.8 billion more than August imports. Year to date, the goods and services deficit increased $125.6 billion, or 20.2%, from the same period in 2021. Exports increased $378.1 billion or 20.2%. Imports increased $503.6 billion or 20.2%.
PMI Non-Manufacturing Index – Released 11/3/2022 – Economic activity in the non-manufacturing sector grew in October for the 29th consecutive month. ISM NOn-Manufacturing registered 54.4%, which is 2.3 percentage points below the September reading of 56.7%.
PMI Manufacturing Index – Released 11/1/2022 – October PMI declined 0.7% registering 50.2%. The New Orders Index remained in contractionary territory at 49.2%, up 2.1%. The Production Index registered 52.3%, up 1.7%.
U.S. Construction Spending – Released 11/1/2022 – Construction spending increased 0.2% in September measuring at a seasonally adjusted annual rate of $1,811.1 billion. The September figure is 10.9% above the September 2021 estimate. Private construction spending increased 0.4% from the revised August estimate at $1,450.3 billion. Public construction spending was 0.4% below the revised August estimate at $360.9 billion.
Chicago PMI – Released 10/31/2022 – Chicago PMI remained in contraction territory and declined slightly in October from 45.7 to 45.2. This marks the lowest reading since June 2020.
Personal Income – Released 10/28/2022 – Personal income increased $78.9 billion or 0.4% in September according to estimates released today by the Bureau of Economic Analysis. Disposable Personal Income (DPI) increased $71.3 billion or 0.4% and Personal Consumption Expenditures (PCE) increased $113 billion or 0.6%.
Advance Estimate of 3rd Quarter 2022 GDP – Released 10/27/2022 – Real Gross Domestic Product (GDP) increased at an annual rate of 2.6% in the third quarter of 2022, according to the advance estimate released by the Bureau of Economic Analysis. GDP decreased 0.6% in the second quarter of 2022. The GDP estimate released today is based on source data that are incomplete or subject to further revision. The increase in real GDP reflected increased in exports, consumer spending, nonresidential fixed investment, federal government spending, and state and local government spending, that were partly offset by decreases in residential fixed investment and private inventory investment. Imports, which are a subtraction in the calculation of GDP, decreased.
Consumer Confidence – Released 10/25/2022 – The Consumer Confidence Index decreased in October following an increase in September. The Index now stands at 102.5, down from 107.8 in September.
Next week we get data on Consumer Confidence, the 2nd Estimate of 3rd Quarter GDP, Personal Income, Chicago PMI, US Construction Spending, Manufacturing PMI, JOLTS, and the November Jobs Report.
Data Sources:
Bureau of Economic Analysis (BEA)
Congressional Budget Office (CBO)
U.S. Bureau of Labor Statistics (BLS)
Federal Reserve Economic Data (FRED Charts)
CME Fed Watch
U.S. Treasury – Yields
U.S. Census Bureau
Institute for Supply Management (ISM)
Weekly DOL Employment Data
BLS Monthly Jobs Report
JOLTS
US Energy Admin (EIA)
BLS Consumer Price Index CPI
BLS Producer Price Index PPI
Atlanta Fed GDPNOW
NY Fed Nowcast GDP
US Census Bureau Housing Starts
Consumer Credit
USCB Retail Sales
Construction Spending
Federal Reserve Dot Plots
NY Empire Index
Philadelphia Federal Reserve
P/E Ratio Data -Yardeni Research
Technical Analysis Info:
StockCharts.com – Financial Charts
Exponential vs Simple moving average
Other Links:
1973 Arab Oil Embargo
Hunt Brothers Silver
Long-Term Capital bailout


Week 48 Talking Points
Table of Contents
Good Life Advisors – Talking Points – Week 48
US equities were slightly higher this week, with the S&P 500 rising above the 200 DMA for the first time since April while the Dow exited a bear market after Wednesday’s big rally. Communication services was the leader with strength across most FANMAGs, NFLX and META. Apple was a bit of a drag on tech hardware after the latest reports around production disruptions in China. Treasuries were firmer across the curve, down around 20 bp for the week across all durations from 2Y and out. The 2Y yield ended the week below 4.3%, the lowest level since early October, while the 10Y ended the week below 3.5%. The dollar index was down 1.2%, falling at one point to the lowest level since June. Golde finished the week up 3.2%. Bitcoin Futures were up around 2.5%. WTI Crude was up 4.85% for the week.
We’ve had three 10% or larger rallies in 2022.
Powell doesn’t push back against easing financial conditions: In a speech at Brookings, Fed Chair Powell signaled that the Fed would downshift the pace of rate hikes to 50 bp this month. However, Powell also reiterated that the peak fed funds rate will need to be somewhat higher than what was projected in the September SEP, and noted tight labor market metrics need to come down to a level consistent with 2% inflation. While there wasn’t much incremental from Powell given his continued “higher-for longer” messaging, takeaways were dovish given Powell didn’t pull a repeat of his Jackson Hole pushback against a loosening of financial conditions driven by peak inflation traction. The comments sparked a big equity and Treasury rally given the support around peak-Fed narrative, though the week’s strong batch of economic data (particularly Friday’s payrolls report) pushed market expectations for the pead fed funds rate higher, up by one 25 bp hike to 5-5.25% by May-23. However, JPMorgan analysts said this week markets are firmly pricing in the higher-for-longer stance, taking out some risk of an upside surprise to the Fed tightening path.
Strong labor market, weak inflation data complicate outlook: There was some focus this week on a growing case for a soft landing given inflation has started to come down while the labor market remains resilient. Labor market strength was seen in Friday’s November nonfarm payrolls report, which saw an increase of 263k, ahead of 200k consensus. Average hourly wages were also higher, up 0.6% m/m against 0.3% consensus. The report helped alleviate some 2023 growth fears, though the wage dynamic may complicate the Fed policy path. This week also saw more support around the peak-inflation narrative, including October core PCE of 0.2% m/m below 0.3% consensus. November ISM manufacturing fell into contraction territory for the first time since May-20, though the prices index fell 3.6 points to 43, the lowest since that May-20 bottom. US gasoline prices also continued to fall, dropping to the lowest level since just before Russia’s invasion of Ukraine (Washington Post).
Positioning, dollar, rates remain supports: In addition to the Powell/ rates tailwind, JPMorgan analysts said stocks were boosted by month-end moves, including a potential $10B buy from leveraged ETFs and systematic funds, while there was also some press focus on bullish options positioning (Bloomberg). Bank of America’s sell-side indicator also came closest to a buy signal since 2017 this week (Bloomberg), though the bank’s latest Flow Show said. Dollar weakness again continued to help stem some of the worries around earnings risk and multiple compression, while analysts expect dollar strength to continue to coll as the market better grasps the Fed’s trajectory (Bloomberg). However, some of the key overhangs remain, including 2023 growth fears, high-profile while collar layoffs, unrelenting Fed “higher-for-longer” messaging, and earnings risks (inflation, geopolitics, central bank overtightening) into 2023. The yield curve fell into deeper inversion this week, signaling market fears of an impending recession (Bloomberg).
This week saw a number of updates highlighting China Covid control policy relaxation, which helped improve sentiment around Chinese demand and eased some fears around potential global supply chain disruptions. China’s Vice President Premier Sun said this week that with more people vaccinated and the omicron variant less pathogenic, China’s fight against the pandemic is at a new stage. China has also considered rolling out a fourth vaccine round (Bloomberg) and will push more vaccinations among its senior citizens (Bloomberg), which are policies seen as essential in the reopening process.
Fixed Income
Yield Curve
November FOMC Statement November Fed Minutes Balance Sheet Reduction Plan Credit, Liquidity and Balance Sheet Federal Reserve Dot Plots
Treasury.gov yields FOMC Policy Normalization Statement Longer- Run Goals Jan 2022
Foreign Exchange Market
Energy Complex
The Baker Hughes rig count was flat this week. There are 784 oil and gas rigs operating in the US – Up 215 over last year.
Metals Complex
Employment Picture
Weekly Unemployment Claims – Released Thursday 11/23/2022 – The week ending November 19th observed an increase of 17k in initial claims increasing to 240k. The four-week moving average of initial jobless claims increased 5.5k to 226.75k.
October Jobs Report – BLS Summary – Released 11/4/2022 – The US Economy added 261k nonfarm jobs in October and the Unemployment rate increased 0.2% to 3.7%. Average hourly earnings increased 12 to $32.58. Hiring highlights include +79k Education and Health Services, +35k Leisure and Hospitality, and +39k Professional and Business Services.
Job Openings & Labor Turnover Survey – JOLTS – Released 11/1/2022 – The US Bureau of Labor Statistics reported the number and rate of job openings increased to 10.7 million on the last business day of September. Over the month, hires declined to 6.1 million and separations declined to 5.7 million. Within separations, quits were little changed at 4.1 million. The layoffs and discharges rates declined to 1.3 million.
Employment Cost Index – Released 10/28/2022 – Compensation costs for civilian workers increased 1.2% for the 3-month period ending in September 2022. The 12-month period ending in September 2022 saw compensation costs increase by 5%. The 12-month period ending September 2021 increased 3.7%. Wages and salaries increased 5.1% over the year and increased 4.2% for the 12-month period ending in September 2021. Benefit costs increased 4.9% over the year and increased 2.5% for the 12-month period ending in September 2021. This report is published quarterly.
This Week’s Economic Data
Links take you to the data source
Durable Goods – Released 11/23/2022 – New orders for manufactured durable goods in October increased $2.8 billion or 1% to $277.4 billion. Transportation equipment led the increase up $2 billion or 2.1% to $97.8 billion.
New Residential Sales – Released 11/23/2022 – Sales of new single-family homes increased 7.5% to 632k, seasonally adjusted, in October. The median sales price of new homes sold in October was $493,000 with an average sales price of $544,000. At the end of October, the seasonally adjusted estimate of new homes for sale was 470k. This represents a supply of 8.9 months at the current sales rate.
Recent Economic Date
Links take you to the data source
Existing Home Sales – Released 11/18/2022 – Existing home sales decreased in October marking nine consecutive months of declines. Sales declined 5.9% to a seasonally adjusted rate of 4.43 million in October. Sales decreased 28.4% year-over-year. Housing inventory sits at 1.22 million units. Down 0.8% from September’s inventory, and down 0.8% over last year. Unsold inventory sits at a 3.3-month supply. The median existing home price for all housing types was $379,100 which is up 6.6% from October 2021. This marks 128 consecutive months of year-over-year increases, the longest-running streak on record.
Housing Starts – Released 11/17/2022 – New home starts in October were at a seasonally adjusted annual rate of 1.425 million; down 4.2% below September, and 8.8% below last October’s rate. Building Permits were at a seasonally adjusted annual rate of 1.526 million down 2.4% compared to September, and down 10.1% over last year.
Industrial Production and Capacity Utilization – Released 11/16/2022 – In October, Industrial production decreased 0.1%. Manufacturing increased 0.1%. Utilities output decreased 1.5%. Mining output decreased 0.4%. Total industrial production was 3.3% higher in October than a year ago. Total capacity utilization decreased 0.2% in October to 79.9% which is 0.3% above its long run average.
Retail Sales – Released 11/16/2022 – US retail sales for October increased 1.3% to $694.5 billion and retail sales are 8.3% above October 2021. US retail sales for the August 2022 through October 2022 period were up 8.9% from the same period a year ago.
Producer Price Index – Released 11/15/2022 – The Producer Price Index for final demand increased 0.2% in October. PPI less food and energy declined 0.1%. The chang in PPI for final demand has increased 8% year/y.
Consumer Price Index – Released 11/10/2022 – Consumer prices increased less than expected rising 0.4% m/m. in October following a 0.4% increase in September. Consumer prices are up 7.7% for the 12-month period ending in October. Core consumer prices increased 0.3% m/m in October.
Consumer Credit – Released 11/7/2022 – Consumer credit increased at a seasonally adjusted annual rate of 6.8% in the third quarter of 2022. Revolving credit increased at an annual rate of 12.9%, while nonrevolving credit increased at an annual rate of 4.9%. In September, consumer credit increased at an annual rate of 6.4%.
US Light Vehicle Sales – Released 11/4/2022 – US light vehicle sales were at a seasonally adjusted annual rate of 14.897 million units in October.
U.S. Trade Balance – Released 11/3/2022 – According to the US Census Bureau of Economic Analysis, the goods and services deficit increased in September by $7.6 billion to $73.3 billion. September exports were $258 billion, $2.8 billion less than August exports. September imports were $331.3 billion, $4.8 billion more than August imports. Year to date, the goods and services deficit increased $125.6 billion, or 20.2%, from the same period in 2021. Exports increased $378.1 billion or 20.2%. Imports increased $503.6 billion or 20.2%.
PMI Non-Manufacturing Index – Released 11/3/2022 – Economic activity in the non-manufacturing sector grew in October for the 29th consecutive month. ISM NOn-Manufacturing registered 54.4%, which is 2.3 percentage points below the September reading of 56.7%.
PMI Manufacturing Index – Released 11/1/2022 – October PMI declined 0.7% registering 50.2%. The New Orders Index remained in contractionary territory at 49.2%, up 2.1%. The Production Index registered 52.3%, up 1.7%.
U.S. Construction Spending – Released 11/1/2022 – Construction spending increased 0.2% in September measuring at a seasonally adjusted annual rate of $1,811.1 billion. The September figure is 10.9% above the September 2021 estimate. Private construction spending increased 0.4% from the revised August estimate at $1,450.3 billion. Public construction spending was 0.4% below the revised August estimate at $360.9 billion.
Chicago PMI – Released 10/31/2022 – Chicago PMI remained in contraction territory and declined slightly in October from 45.7 to 45.2. This marks the lowest reading since June 2020.
Personal Income – Released 10/28/2022 – Personal income increased $78.9 billion or 0.4% in September according to estimates released today by the Bureau of Economic Analysis. Disposable Personal Income (DPI) increased $71.3 billion or 0.4% and Personal Consumption Expenditures (PCE) increased $113 billion or 0.6%.
Advance Estimate of 3rd Quarter 2022 GDP – Released 10/27/2022 – Real Gross Domestic Product (GDP) increased at an annual rate of 2.6% in the third quarter of 2022, according to the advance estimate released by the Bureau of Economic Analysis. GDP decreased 0.6% in the second quarter of 2022. The GDP estimate released today is based on source data that are incomplete or subject to further revision. The increase in real GDP reflected increased in exports, consumer spending, nonresidential fixed investment, federal government spending, and state and local government spending, that were partly offset by decreases in residential fixed investment and private inventory investment. Imports, which are a subtraction in the calculation of GDP, decreased.
Consumer Confidence – Released 10/25/2022 – The Consumer Confidence Index decreased in October following an increase in September. The Index now stands at 102.5, down from 107.8 in September.
Next week we get data on Consumer Confidence, the 2nd Estimate of 3rd Quarter GDP, Personal Income, Chicago PMI, US Construction Spending, Manufacturing PMI, JOLTS, and the November Jobs Report.
Data Sources:
Bureau of Economic Analysis (BEA)
Congressional Budget Office (CBO)
U.S. Bureau of Labor Statistics (BLS)
Federal Reserve Economic Data (FRED Charts)
CME Fed Watch
U.S. Treasury – Yields
U.S. Census Bureau
Institute for Supply Management (ISM)
Weekly DOL Employment Data
BLS Monthly Jobs Report
JOLTS
US Energy Admin (EIA)
BLS Consumer Price Index CPI
BLS Producer Price Index PPI
Atlanta Fed GDPNOW
NY Fed Nowcast GDP
US Census Bureau Housing Starts
Consumer Credit
USCB Retail Sales
Construction Spending
Federal Reserve Dot Plots
NY Empire Index
Philadelphia Federal Reserve
P/E Ratio Data -Yardeni Research
Technical Analysis Info:
StockCharts.com – Financial Charts
Exponential vs Simple moving average
Other Links:
1973 Arab Oil Embargo
Hunt Brothers Silver
Long-Term Capital bailout
Categories:
Tags: