Good Life Advisors – Talking Points – Week 42
All-Time Highs Everywhere You Look
For perspective, all currently happening:
Stocks: All-Time Highs, Dow Jones 35,677 on Friday
Home Prices: All-Time Highs, Median Sales Price of All Houses Sold -$374.9k
Bitcoin: $66k on Wednesday
5- and 10-Year Breakeven Inflation Rates – Highest Post GFC
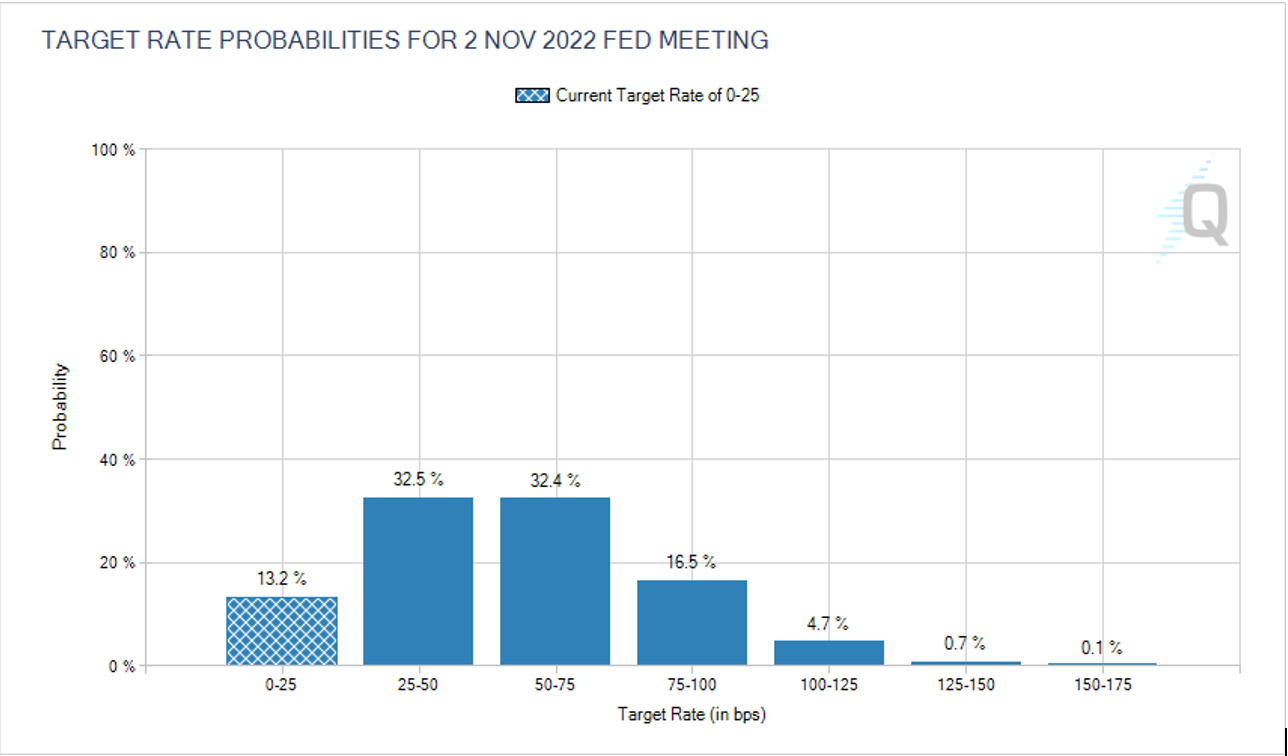
You know what’s not near highs? The Fed Fund Rate at 8bps- Change is a coming.
The CME FedWatch Tool shows significant expectation for higher rates at this time next year.
Earnings and Infrastructure seemed to be the go-to excuse for the upside as the robust demand backdrop helped ease some of the concerns surrounding supply chain and input price pressures. Fiscal stimulus headlines leaned positive as Democrats seemed to be moving closer to a deal on a social spending package that while likely below $2T, does not look as if it will include corporate tax hikes. Flow data continued to highlight the resilience of the buy-the-dip mantra following a 5%+ pullback in the S&P 500 during a six-week stretch through early October. Fedspeak offered some mixed takeaways as officials increasingly acknowledged upside risks from inflation, but also continued to highlight the distinction between tapering and tightening. Covid developments were mixed as while cases continued to decline in the US, there was a pickup in concerns about a descendent of the Delta variant driving cases higher in the UK. All in all, the YTD number look good for domestic equities.

Fixed Income
The 5-year breakeven inflation rates now stand at 2.91%. All of the short-term rates have been creeping up over the last month.
September FOMC Statement Credit, Liquidity and Balance Sheet Federal Reserve Dot Plots Sep 21′
US Corporate Debt Tops 7 Trillion. Treasury.gov yields FOMC Policy Normalization Statement Longer Run Goals August 2020
Global Bond Yields
Daily US Treasury Yields
Foreign Exchange Market
Energy Complex
The Baker Hughes rig count decreased by 1 this week. There are 542 oil and gas rigs operating in the US – Up 255 over last year.
Metals Complex
Employment Picture
Wage growth is the highest it’s been since just before the GFC
Weekly Unemployment Claims – Released Thursday 10/21/2021 – The week ending October 16th experienced a decrease of 6k in initial claims declining to 290k. The four-week moving average of initial jobless claims decreased 15.25k to 319.75k.
Job Openings & Labor Turnover Survey JOLTS – Released 10/12/2021 – The U.S. Bureau of Labor Statistics reported the number and rate of job openings decreased to 10.4 million on the last business day of August. Over the month, hires decreased to 6.3 million and separations were little changed at 6.0 million. Within separations, the quits rate increased to 2.9%. The layoffs and discharges rates were little changed at 0.9%.
September Jobs Report – BLS Summary Released 10/8/2021 – The US Economy added 194k nonfarm jobs in September and the Unemployment rate declined 0.4% to 4.8. Average hourly earnings increased by 19 cents to $30.85. Hiring highlights include +74k Leisure and Hospitality, +60k Professional and Business Services, and +47 Transportation and Warehousing.
- Average hourly earnings increased by 19 cents to $30.85.
- U3 unemployment rate declined 0.4% to 4.8%. U6 unemployment rate declined to 8.5%.
- The labor force participation rate was little changed at 61.6%.
- Average work week increased 0.2 hours to 34.8 hours.
Employment Cost Index – Released 7/30/2021 – Compensation costs for civilian workers increased 0.7% for the 3-month period ending in June 2021. The 12-month period ending in June 2021 saw compensation costs increase by 2.9%. The 12-month period ending June 2020 increased 2.7%. Wages and salaries increased 3.2 percent over the year and increased 2.9 percent for the 12-month period ending in June 2020. Benefit costs increased 2.2 percent over the year and increased 2.2 percent for the 12-month period ending in June 2020. This report is published quarterly.
This Week’s Economic Data
Links take you to the data source
Existing Home Sales – Released 10/21/2021 – Existing home sales increased in September. Sales rose 7.0% to a seasonally adjusted rate of 6.29 million in September. Sales are currently down 2.3% from one year ago. Housing inventory sits at 1.27 million units. Down 0.8% from August’s inventory. Down 13.0% over last year. Unsold inventory sits at a 2.4-month supply. The median existing home price for all housing types was $352,800.
Housing Starts – Released 10/19/2021 – New home starts in September were at a seasonally adjusted annual rate of 1.555 million; down 1.6% below August, but 7.4% above last September’s rate. Building Permits were at a seasonally adjusted annual rate of 1.589 million, down 7.7% compared to August, and virtually unchanged over last year.
Industrial Production and Capacity Utilization – Released 10/18/2021 – In September Industrial production declined 1.3%. Manufacturing decreased 0.7%. Motor Vehicles and parts, still limited by semiconductor shortages, declined 7.2%. Mining decreased 2.3%. Utilities output decreased 3.6%. Total industrial production was 4.6% higher in September than a year ago. Total capacity utilization decreased 1.0% to 75.2% in September which is 4.4% below its long run average.
Recent Economic Data
Links take you to the data source
Retail Sales – Released 10/15/2021 – U.S. retail sales for September increased 0.7% to $625.4 billion and retail sales are 13.9% above September 2020. U.S. retail sales for the July 2021 through September 2021 period were up 14.9% from the same period a year ago.
Producer Price Index – Released 10/14/2021 – The Producer Price Index for final demand increased 0.5% in September. PPI less food and energy increased 0.6% in September. The change in PPI for final demand has increased 8.6% year/y.
Consumer Price Index – Released 10/13/2021 – Consumer prices rose 0.4% m/m in September following a 0.3% gain in August. Core consumer prices increased 0.2% m/m in September following a 0.1% gain in August.
US Light Vehicle Sales – Released 10/8/2021 – U.S. light vehicle sales were at a seasonally adjusted annual rate (SAAR) of 12.176 million units in September.
Consumer Credit – Released 10/7/2021 – Consumer credit increased at a seasonally adjusted annual rate of 4.0 percent in August. Revolving credit increased at an annual rate of 3.6 percent, while nonrevolving credit increased at an annual rate of 4.1 percent.
PMI Non-Manufacturing Index – Released 10/5/2021 – Economic activity in the non-manufacturing sector grew in September for the 16th consecutive month. ISM Non-Manufacturing registered 61.9 percent, which is 0.2 percentage points above the adjusted August reading of 61.7 percent.
U.S. Trade Balance – Released 10/5/2021 – According to the U.S. Census Bureau of Economic Analysis the goods and services deficit increased in August by $2.9 billion to $73.3 billion. August exports were $213.7 billion, $1.0 billion more than July exports. August imports were $287.0 billion, $4.0 billion more than July imports. Year to date the goods and services deficit increased $140.8 billion or 33.7%, from the same period in 2020. Year to date exports and imports increased $244.3 billion or 17.5% and increased $385.1 billion or 21.2% respectively.
PMI Manufacturing Index – Released 10/1/2021 – September PMI increased 1.2% to 61.1% up from August’s reading of 59.9%. The New Orders Index was unchanged from August’s reading of 66.7%. The Production Index registered 59.4%, down 0.6%.
U.S. Construction Spending – Released 10/1/2021 – Construction spending was relatively unchanged in August measuring at a seasonally adjusted annual rate of $1,584.1 billion. The August figure is 8.9% above the August 2020 estimate. Private construction spending was 0.1% below the revised July estimate at $1,243.7 billion. Public construction spending was 0.5% above the revised July estimate at $341.9 billion.
Personal Income – Released 10/1/2021 – Personal income increased $35.5 billion or 0.2 percent in August according to estimates released today by the Bureau of Economic Analysis. Disposable personal income (DPI) increased $18.9 billion or 0.1 percent and personal consumption expenditures (PCE) increased $130.5 billion or 0.8 percent.
Third Estimate of 2nd Quarter 2021 GDP – Released 9/30/2021 – Real gross domestic product (GDP) increased at an annual rate of 6.7 percent in the second quarter of 2021, according to the third estimate released by the Bureau of Economic Analysis. The third GDP estimate is based on more complete source data than were available for the “second” and “advance” estimates. In the second estimate, the increase in real GDP was 6.6 percent. The first quarter observed a 6.3 percent increase in real GDP. The third estimate observed upward revisions to personal consumption expenditures (PCE), exports, and private inventory investment were partly offset by an upward revision to imports, which are a subtraction in the calculation of GDP. The increase in real GDP in the second quarter reflected increases in PCE, nonresidential fixed investment, exports, and state and local government spending that were partly offset by decreases in private inventory investment, residential fixed investment, and federal government spending. Imports, which are a subtraction in the calculation of GDP, increased.
Chicago PMI – Released 9/30/2021 – Chicago PMI decreased to 64.7 points in September, the lowest level since February. Among the main five indicators, Order Backlogs saw the largest decline, followed by Supplier Deliveries and New Orders. Only Employment increased through the month.
Consumer Confidence – Released 9/28/2021 – The Consumer confidence index declined in September. The Index now stands at 109.3, down from 115.2 in August.
Durable Goods – Released 9/27/2021 – New orders for manufactured durable goods in August increased $4.6 billion or 1.8% to $263.5 billion. Transportation equipment led the increase rising $4.2 billion or 5.5% to $80.8 billion.
New Residential Sales – Released 9/24/2021 – Sales of new single-family homes increased 1.5% to 740k, seasonally adjusted, in August. The median sales price of new homes sold in August was $390,900 with an average sales price of $443,200. At the end of August, the seasonally adjusted estimate of new homes for sale was 378k. This represents a supply of 6.1 months at the current sales rate.
Next week we get data on New Residential Sales, Durable Goods, Consumer Confidence, Chicago PMI, Personal Income, the Advance Estimate of 3rd Quarter 2021 GDP, and the Employment Cost Index.
Data Sources:
Bureau of Economic Analysis (BEA)
Congressional Budget Office (CBO)
U.S. Bureau of Labor Statistics (BLS)
Federal Reserve Economic Data (FRED Charts)
CME Fed Watch
U.S. Treasury – Yields
U.S. Census Bureau
Institute for Supply Management (ISM)
Weekly DOL Employment Data
BLS Monthly Jobs Report
JOLTS
US Energy Admin (EIA)
BLS Consumer Price Index CPI
BLS Producer Price Index PPI
Atlanta Fed GDPNOW
NY Fed Nowcast GDP
US Census Bureau Housing Starts
Consumer Credit
USCB Retail Sales
Construction Spending
Federal Reserve Dot Plots
NY Empire Index
Philadelphia Federal Reserve
P/E Ratio Data -Yardeni Research
Technical Analysis Info:
StockCharts.com – Financial Charts
Exponential vs Simple moving average
Other Links:
1973 Arab Oil Embargo
Hunt Brothers Silver
Long-Term Capital bailout


Week 42 Talking Points
Good Life Advisors – Talking Points – Week 42
All-Time Highs Everywhere You Look
For perspective, all currently happening:
Stocks: All-Time Highs, Dow Jones 35,677 on Friday
Home Prices: All-Time Highs, Median Sales Price of All Houses Sold -$374.9k
Bitcoin: $66k on Wednesday
5- and 10-Year Breakeven Inflation Rates – Highest Post GFC
You know what’s not near highs? The Fed Fund Rate at 8bps- Change is a coming.
The CME FedWatch Tool shows significant expectation for higher rates at this time next year.
Earnings and Infrastructure seemed to be the go-to excuse for the upside as the robust demand backdrop helped ease some of the concerns surrounding supply chain and input price pressures. Fiscal stimulus headlines leaned positive as Democrats seemed to be moving closer to a deal on a social spending package that while likely below $2T, does not look as if it will include corporate tax hikes. Flow data continued to highlight the resilience of the buy-the-dip mantra following a 5%+ pullback in the S&P 500 during a six-week stretch through early October. Fedspeak offered some mixed takeaways as officials increasingly acknowledged upside risks from inflation, but also continued to highlight the distinction between tapering and tightening. Covid developments were mixed as while cases continued to decline in the US, there was a pickup in concerns about a descendent of the Delta variant driving cases higher in the UK. All in all, the YTD number look good for domestic equities.
Table of Contents
Fixed Income
The 5-year breakeven inflation rates now stand at 2.91%. All of the short-term rates have been creeping up over the last month.
September FOMC Statement Credit, Liquidity and Balance Sheet Federal Reserve Dot Plots Sep 21′
US Corporate Debt Tops 7 Trillion. Treasury.gov yields FOMC Policy Normalization Statement Longer Run Goals August 2020
Global Bond Yields
Daily US Treasury Yields
Foreign Exchange Market
Energy Complex
The Baker Hughes rig count decreased by 1 this week. There are 542 oil and gas rigs operating in the US – Up 255 over last year.
Metals Complex
Employment Picture
Wage growth is the highest it’s been since just before the GFC
Weekly Unemployment Claims – Released Thursday 10/21/2021 – The week ending October 16th experienced a decrease of 6k in initial claims declining to 290k. The four-week moving average of initial jobless claims decreased 15.25k to 319.75k.
Job Openings & Labor Turnover Survey JOLTS – Released 10/12/2021 – The U.S. Bureau of Labor Statistics reported the number and rate of job openings decreased to 10.4 million on the last business day of August. Over the month, hires decreased to 6.3 million and separations were little changed at 6.0 million. Within separations, the quits rate increased to 2.9%. The layoffs and discharges rates were little changed at 0.9%.
September Jobs Report – BLS Summary Released 10/8/2021 – The US Economy added 194k nonfarm jobs in September and the Unemployment rate declined 0.4% to 4.8. Average hourly earnings increased by 19 cents to $30.85. Hiring highlights include +74k Leisure and Hospitality, +60k Professional and Business Services, and +47 Transportation and Warehousing.
Employment Cost Index – Released 7/30/2021 – Compensation costs for civilian workers increased 0.7% for the 3-month period ending in June 2021. The 12-month period ending in June 2021 saw compensation costs increase by 2.9%. The 12-month period ending June 2020 increased 2.7%. Wages and salaries increased 3.2 percent over the year and increased 2.9 percent for the 12-month period ending in June 2020. Benefit costs increased 2.2 percent over the year and increased 2.2 percent for the 12-month period ending in June 2020. This report is published quarterly.
This Week’s Economic Data
Links take you to the data source
Existing Home Sales – Released 10/21/2021 – Existing home sales increased in September. Sales rose 7.0% to a seasonally adjusted rate of 6.29 million in September. Sales are currently down 2.3% from one year ago. Housing inventory sits at 1.27 million units. Down 0.8% from August’s inventory. Down 13.0% over last year. Unsold inventory sits at a 2.4-month supply. The median existing home price for all housing types was $352,800.
Housing Starts – Released 10/19/2021 – New home starts in September were at a seasonally adjusted annual rate of 1.555 million; down 1.6% below August, but 7.4% above last September’s rate. Building Permits were at a seasonally adjusted annual rate of 1.589 million, down 7.7% compared to August, and virtually unchanged over last year.
Industrial Production and Capacity Utilization – Released 10/18/2021 – In September Industrial production declined 1.3%. Manufacturing decreased 0.7%. Motor Vehicles and parts, still limited by semiconductor shortages, declined 7.2%. Mining decreased 2.3%. Utilities output decreased 3.6%. Total industrial production was 4.6% higher in September than a year ago. Total capacity utilization decreased 1.0% to 75.2% in September which is 4.4% below its long run average.
Recent Economic Data
Links take you to the data source
Retail Sales – Released 10/15/2021 – U.S. retail sales for September increased 0.7% to $625.4 billion and retail sales are 13.9% above September 2020. U.S. retail sales for the July 2021 through September 2021 period were up 14.9% from the same period a year ago.
Producer Price Index – Released 10/14/2021 – The Producer Price Index for final demand increased 0.5% in September. PPI less food and energy increased 0.6% in September. The change in PPI for final demand has increased 8.6% year/y.
Consumer Price Index – Released 10/13/2021 – Consumer prices rose 0.4% m/m in September following a 0.3% gain in August. Core consumer prices increased 0.2% m/m in September following a 0.1% gain in August.
US Light Vehicle Sales – Released 10/8/2021 – U.S. light vehicle sales were at a seasonally adjusted annual rate (SAAR) of 12.176 million units in September.
Consumer Credit – Released 10/7/2021 – Consumer credit increased at a seasonally adjusted annual rate of 4.0 percent in August. Revolving credit increased at an annual rate of 3.6 percent, while nonrevolving credit increased at an annual rate of 4.1 percent.
PMI Non-Manufacturing Index – Released 10/5/2021 – Economic activity in the non-manufacturing sector grew in September for the 16th consecutive month. ISM Non-Manufacturing registered 61.9 percent, which is 0.2 percentage points above the adjusted August reading of 61.7 percent.
U.S. Trade Balance – Released 10/5/2021 – According to the U.S. Census Bureau of Economic Analysis the goods and services deficit increased in August by $2.9 billion to $73.3 billion. August exports were $213.7 billion, $1.0 billion more than July exports. August imports were $287.0 billion, $4.0 billion more than July imports. Year to date the goods and services deficit increased $140.8 billion or 33.7%, from the same period in 2020. Year to date exports and imports increased $244.3 billion or 17.5% and increased $385.1 billion or 21.2% respectively.
PMI Manufacturing Index – Released 10/1/2021 – September PMI increased 1.2% to 61.1% up from August’s reading of 59.9%. The New Orders Index was unchanged from August’s reading of 66.7%. The Production Index registered 59.4%, down 0.6%.
U.S. Construction Spending – Released 10/1/2021 – Construction spending was relatively unchanged in August measuring at a seasonally adjusted annual rate of $1,584.1 billion. The August figure is 8.9% above the August 2020 estimate. Private construction spending was 0.1% below the revised July estimate at $1,243.7 billion. Public construction spending was 0.5% above the revised July estimate at $341.9 billion.
Personal Income – Released 10/1/2021 – Personal income increased $35.5 billion or 0.2 percent in August according to estimates released today by the Bureau of Economic Analysis. Disposable personal income (DPI) increased $18.9 billion or 0.1 percent and personal consumption expenditures (PCE) increased $130.5 billion or 0.8 percent.
Third Estimate of 2nd Quarter 2021 GDP – Released 9/30/2021 – Real gross domestic product (GDP) increased at an annual rate of 6.7 percent in the second quarter of 2021, according to the third estimate released by the Bureau of Economic Analysis. The third GDP estimate is based on more complete source data than were available for the “second” and “advance” estimates. In the second estimate, the increase in real GDP was 6.6 percent. The first quarter observed a 6.3 percent increase in real GDP. The third estimate observed upward revisions to personal consumption expenditures (PCE), exports, and private inventory investment were partly offset by an upward revision to imports, which are a subtraction in the calculation of GDP. The increase in real GDP in the second quarter reflected increases in PCE, nonresidential fixed investment, exports, and state and local government spending that were partly offset by decreases in private inventory investment, residential fixed investment, and federal government spending. Imports, which are a subtraction in the calculation of GDP, increased.
Chicago PMI – Released 9/30/2021 – Chicago PMI decreased to 64.7 points in September, the lowest level since February. Among the main five indicators, Order Backlogs saw the largest decline, followed by Supplier Deliveries and New Orders. Only Employment increased through the month.
Consumer Confidence – Released 9/28/2021 – The Consumer confidence index declined in September. The Index now stands at 109.3, down from 115.2 in August.
Durable Goods – Released 9/27/2021 – New orders for manufactured durable goods in August increased $4.6 billion or 1.8% to $263.5 billion. Transportation equipment led the increase rising $4.2 billion or 5.5% to $80.8 billion.
New Residential Sales – Released 9/24/2021 – Sales of new single-family homes increased 1.5% to 740k, seasonally adjusted, in August. The median sales price of new homes sold in August was $390,900 with an average sales price of $443,200. At the end of August, the seasonally adjusted estimate of new homes for sale was 378k. This represents a supply of 6.1 months at the current sales rate.
Next week we get data on New Residential Sales, Durable Goods, Consumer Confidence, Chicago PMI, Personal Income, the Advance Estimate of 3rd Quarter 2021 GDP, and the Employment Cost Index.
Data Sources:
Bureau of Economic Analysis (BEA)
Congressional Budget Office (CBO)
U.S. Bureau of Labor Statistics (BLS)
Federal Reserve Economic Data (FRED Charts)
CME Fed Watch
U.S. Treasury – Yields
U.S. Census Bureau
Institute for Supply Management (ISM)
Weekly DOL Employment Data
BLS Monthly Jobs Report
JOLTS
US Energy Admin (EIA)
BLS Consumer Price Index CPI
BLS Producer Price Index PPI
Atlanta Fed GDPNOW
NY Fed Nowcast GDP
US Census Bureau Housing Starts
Consumer Credit
USCB Retail Sales
Construction Spending
Federal Reserve Dot Plots
NY Empire Index
Philadelphia Federal Reserve
P/E Ratio Data -Yardeni Research
Technical Analysis Info:
StockCharts.com – Financial Charts
Exponential vs Simple moving average
Other Links:
1973 Arab Oil Embargo
Hunt Brothers Silver
Long-Term Capital bailout
Categories:
Tags: