The only thing positive about this week is that it could have been worse.
Volatility picked up and at one point, the S&P 500 had fallen 4% in less than three days. The VIX index jumped over 20% mid-week but ultimately a buy-the-dip mentality countered and the week closed only moderately lower. ISM Manufacturing for September fell to 47.8% from 49.1% in August, its worst reading since June 2009. Then the Non-Manufacturing (services) index fell to 52.6% from 56.4%. The dividing line between expansion and contraction is 50 on these reports. So the manufacturing soft data is showing contraction and the services index is showing a slower expansion currently. Concern over both of the ISM reports helped fuel selling, but the market was able to end the week well off the lows, following reasonable employment data for September.
The unemployment rate dropped to 3.5%, which is the lowest since December 1969. Average hourly earnings were flat.
- September nonfarm payrolls increased by 136k. The three-month average is 157k per month.
- The unemployment rate fell to 3.5%, from 3.7% in August. The U6 unemployment rate, which accounts for unemployed and underemployed workers, was 6.9%, versus 7.2%.
- September average hourly earnings were flat in August. Year/y average hourly earnings have risen 2.9%, versus 3.2% for the 12 months ending in August.
- The labor force participation rate was unchanged at 63.2% in September.
Treasury yields continued to slide as growth concerns weigh on expectations for the Fed to cut rates not only in October but also in December. The 2yr yield fell 22 basis points to 1.40%, and the 10-yr yield fell 15 basis points to 1.51%. The Dollar Index declined 0.3% to 98.74. WTI crude oil dropped 5.6% to $52.78/bbl, further pressured by rising inventory levels.
In the week ahead the IMF managing director will give his outlook for the global economy on Monday. German industrial output also comes out Monday. Germany is a key manufacturing hub of Europe and this report will help tell the tale of global conditions. The US-China trade talks will be back in focus when talks resume Thursday. If no agreement is reached, tariffs on $250bn of imports will rise from 25% to 30% on October 15th. And I guess it goes without saying that the impeachment inquiry that is gripping the Trump presidency will also be in the news.

Fixed Income
FOMC September Statement Federal Reserve Dot Plots US Debt Measurement US Corporate Debt Tops $6 Trillion Treasury.gov yields
FOMC Policy Normalization Statement
Global Bond Yields
The Fed cut rates by 25 bps last week.
Daily US Treasury Yields
Foreign Exchange Market
Energy Complex
The Baker Hughes rig count lost 5 this week. There are 855 oil and gas rigs operating in the US – Down 197 over last year.
- Brent Crude Oil lost 4.37% this week closing at $58.37/bbl
- WTI Crude Oil lost 5.54% this week to close at $52.81/bbl
- Heating Oil lost 2.14% this week closing at $1.89/gallon
- Natural Gas lost 2.16% this week closing at $2.35 per million BTUs
- Unleaded Gas lost 2.06% this week closing at $1.57/gallon
Metals Complex
- Gold gained 0.43% this week closing at $1512.90/oz
- Silver lost 0.15% on the week closing at $17.62/oz
- Palladium lost 0.64% this week closing at $1642.40/oz
- Platinum lost 5.26% this week closing at $886.90/oz
- Copper lost 1.35% this week closing at $2.56/lb
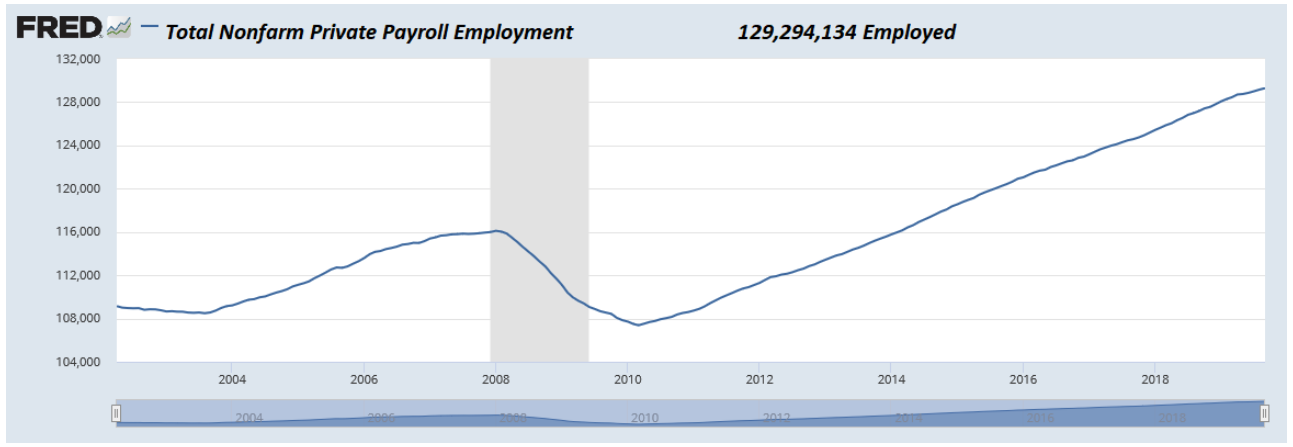
Employment Picture
September Jobs Report – BLS Summary – Released 10/4-19 – The US Economy added 136k nonfarm jobs in September and the Unemployment rate declined 0.2% to 3.5% from 3.7%. Unemployment has reached its lowest level since December 1969 when it was also at 3.5%. Average hourly earnings declined 1 cent. Hiring highlights include Education and Health Services +40k, Professional and Business Services +34k, Government +22k, and -11k Retail Trade.
- Average hourly earnings declined by 1 cent in September, y/y hourly earnings are up 2.9%.
- U3 unemployment declined from 3.7% to 3.5%. U6 unemployment rate declined 0.3% to 6.9%.
- The labor force participation rate was unchanged in September at 63.2% (Unchanged year/y).
- Average workweek was unchanged at 34.4 hours.
Weekly Unemployment Claims – Released Thursday 10/3/19 – In the week ending September 28th, initial claims were 219,000, an increase of 4,000 from the previous week’s revised level. The 4-week moving average was 212,500, unchanged from the previous week’s revised average.
Job Openings & Labor Turnover Survey JOLTS – Released Tuesday 9/10/19 – The U.S. Bureau of Labor Statistics reported the number of job openings was little changed at 7.2 million on the last business day of July. Over the month, hires increased by 0.3 million to 6.0 million and separations increased by 0.3 million to 5.8 million. Within separations, the quits rate was little changed at 2.4%. The layoffs and discharges rates was little changed at 1.2%.
Employment Cost Index – Released 7/31/19 – Compensation costs for civilian workers increased 0.6% for the 3-month period ending in June 2019. The 12 month period ending on June 2019 saw compensation costs increase by 2.7% versus 2.8% in June 2018. Wages and salaries were up 2.8% for the 12-month period ending June 2019, versus 2.8% for the 12-month period ending June 2018. Benefit costs increased 2.3% for the 12-month period ending June 2019. For private industry workers, compensation costs increased 2.6% year-over-year, versus 2.9% for the 12 months ending June 2018. This report is published quarterly.
This Week’s Economic Data
Links take you to the data source
U.S. Trade Balance – Released 10/4 – According to the U.S. Census Bureau of Economic Analysis, the goods and services deficit increased in August to $54.9 billion. This increase is $0.9 billion higher than the deficit recorded in July. August exports were $207.9 billion, $0.5 billion more than July exports. August imports were $262.8 billion, $1.3 billion more than July imports. The goods and services deficit has increased $28.3 billion or 7.1% year to date. Year to date exports and imports decreased $3.2 billion or 0.2% and increased $25.1 billion or 1.2% respectively.
PMI Non-Manufacturing Index (ISM Services) – Released 10/3 – Economic activity in the non-manufacturing sector grew in September for the 116th consecutive month. ISM Non-Manufacturing registered 52.6 percent, which is 3.8 percentage points lower than the August reading of 56.4 percent. This represents continued growth in the non-manufacturing sector, at a slightly slower rate.
PMI Manufacturing ISM Index – Released 10/1 – September PMI remains in contraction territory as PMI decreased 1.3% to 47.8% from August’s reading of 49.1%. The New Orders Index was up 0.1%from August’s reading of 47.2% to 47.3% for September. The Production Index registered 47.3% down 2.2%.
U.S. Construction Spending – Released 10/1 – Construction spending increased by 0.1% in August measuring at a seasonally adjusted annual rate of $1,287.3 billion. The August figure is 1.9% below the August 2018 estimate. Private construction spending nearly unchanged from the revised July estimate at $955.0 billion. Public construction spending was 0.4% above the revised July estimate at $330.8 billion.
Chicago PMI – Released 9/30 – Chicago PMI fell 3.3 points in September falling to 47.1, down from 50.4 in August. This decrease shows the index falling back into contraction territory. Business confidence dropped below 50 to 47.3 marking its lowest level since Q3 2009. Supplier Deliveries and Employment were the only Business Activity components showing increases on the month. Production showed the largest decline falling 15.8%. Order backlogs and inventories declined by 8.9% and 6.2% respectively.
Recent Economic Data
Links take you to the data source
Personal Income – Released 9/27 – Personal Income increased 0.4% in August according to the BEA. The majority of the increase in August was due to increases in wages and salaries, nonfarm proprietors’ income, and personal current transfer receipts. Real PCE (the Feds preferred inflation gauge) increased 0.1% in August. Real disposable personal income increased 0.4% in August.
Third Estimate of 2nd Quarter GDP – Released 9/26 – According to the third estimate released by the Bureau of Economic Analysis, Real Gross Domestic Product (Real GDP) increased at an annual rate of 2.0% in the second quarter of 2019. The third estimate is based on data that are more complete than that of the second and advance estimates. The second-quarter increase in real GDP observed positive contributions from personal consumption expenditures (PCE), federal gov’t spending, and state and local gov’t spending that were partly offset by negative contributions from private inventory investment, exports, nonresidential fixed investment, and residential fixed investment.
New Residential Sales – Released 9/25 – Sales of new single-family homes increased 7.1% to 713k, seasonally adjusted, in August. The median sales price of new homes sold in August was $328.4k with an average sales price of $404.2k. At the end of August, the seasonally adjusted estimate of new homes for sale was 326k. This represents a supply of 5.5 months at the current sales rate.
Consumer Confidence – Released 9/24 – The Consumer confidence index declined in September following a slight decline in August. The Index now shows a reading of 125.1 down from 134.2 in August. Escalations in trade and tariff tensions resulted in a more negative assessment of current conditions; however, expectations overall still remain strong and consumers remain confident and willing to spend.
Durable Goods – Released 9/24 – New orders for manufactured durable goods increased $0.5 billion or 0.2% to $250.7 billion in August. The increase in August makes three consecutive months of increases. Fabricated metal products drove the increase; up $0.4 billion or 1.3%.
Existing Home Sales – Released 9/19 – Existing home sales increased in August. Sales gained 1.3% to a seasonally adjusted rate of 5.49 million. This marks two consecutive months of growth. Sales are currently up 2.6% from one year ago. Housing inventory declined to 4.1months of inventory and the total housing inventory decreased to 1.86 million. The median sales price for all types of homes was $278,200, up 4.7% year/y.
Housing Starts – Released 9/18 – New home starts in August were at a seasonally adjusted rate of 1.364 million; up 12.3% above July and 6.6% above last August’s rate. Building Permits were at a seasonally adjusted rate of 1.419 million, up 7.7% compared to July and up 12% over last year.
Industrial Production and Capacity Utilization – Released 9/17 – Industrial production gained 0.6% in August. Manufacturing output increased 0.5% more than reversing its July decline. The index for utilities gained 0.6% and the index for mining gained 1.4%. Total capacity utilization increased 0.4% to 77.9% in August which is 1.9% below its long-run average.
Retail Sales – Released 9/13 – U.S. retail sales for August were up 0.4% month/m increasing to $526.1 billion.
Consumer Price Index – Released 9/12 – The Consumer Price Index increased 0.1% in August. Core CPI, which excludes food and energy increased 0.3%. The monthly changes left total CPI up 1.7% year-over-year and core CPI up 2.4%.
Producer Price Index – Released 9/11 – The Producer Price Index for final demand increased by 0.1% in August. Core PPI was flat. Year over year the index for final demand rose 1.9%.
Consumer Credit – Released 9/9 – Consumer credit increased at a seasonally adjusted annual rate of 6.75% in July. Revolving and nonrevolving credit increased at annual rates of 11.25% and 5.25% respectively. Total Outstanding consumer credit is currently at $4.123 trillion.
US Light Vehicle Sales – Released 9/4 – U.S. light-vehicle sales were at a seasonally adjusted annual rate (SAAR) of 17.07 million units in August versus a SAAR of 16.82 million units in July.
Next week we get data on JOLTS, Consumer Credit, the Producer Price Index, and the Consumer Price Index.
Data Sources:
Bureau of Economic Analysis (BEA)
Congressional Budget Office (CBO)
U.S. Bureau of Labor Statistics (BLS)
Federal Reserve Economic Data (FRED Charts)
CME Fed Watch
U.S. Treasury – Yields
U.S. Census Bureau
Institute for Supply Management (ISM)
Weekly DOL Employment Data
BLS Monthly Jobs Report
JOLTS
US Energy Admin (EIA)
BLS Consumer Price Index CPI
BLS Producer Price Index PPI
Atlanta Fed GDPNOW
NY Fed Nowcast GDP
US Census Bureau Housing Starts
Consumer Credit
USCB Retail Sales
Construction Spending
Federal Reserve Dot Plots
NY Empire Index
Philadelphia Federal Reserve
P/E Ratio Data -Yardeni Research
Technical Analysis Info:
StockCharts.com – Financial Charts
Exponential vs Simple moving average
Other Links:
1973 Arab Oil Embargo
Hunt Brothers Silver
Long-Term Capital bailout


Week 40 Talking Points
The only thing positive about this week is that it could have been worse.
Volatility picked up and at one point, the S&P 500 had fallen 4% in less than three days. The VIX index jumped over 20% mid-week but ultimately a buy-the-dip mentality countered and the week closed only moderately lower. ISM Manufacturing for September fell to 47.8% from 49.1% in August, its worst reading since June 2009. Then the Non-Manufacturing (services) index fell to 52.6% from 56.4%. The dividing line between expansion and contraction is 50 on these reports. So the manufacturing soft data is showing contraction and the services index is showing a slower expansion currently. Concern over both of the ISM reports helped fuel selling, but the market was able to end the week well off the lows, following reasonable employment data for September.
The unemployment rate dropped to 3.5%, which is the lowest since December 1969. Average hourly earnings were flat.
Treasury yields continued to slide as growth concerns weigh on expectations for the Fed to cut rates not only in October but also in December. The 2yr yield fell 22 basis points to 1.40%, and the 10-yr yield fell 15 basis points to 1.51%. The Dollar Index declined 0.3% to 98.74. WTI crude oil dropped 5.6% to $52.78/bbl, further pressured by rising inventory levels.
In the week ahead the IMF managing director will give his outlook for the global economy on Monday. German industrial output also comes out Monday. Germany is a key manufacturing hub of Europe and this report will help tell the tale of global conditions. The US-China trade talks will be back in focus when talks resume Thursday. If no agreement is reached, tariffs on $250bn of imports will rise from 25% to 30% on October 15th. And I guess it goes without saying that the impeachment inquiry that is gripping the Trump presidency will also be in the news.
Table of Contents
Fixed Income
FOMC September Statement Federal Reserve Dot Plots US Debt Measurement US Corporate Debt Tops $6 Trillion Treasury.gov yields
FOMC Policy Normalization Statement
Global Bond Yields
The Fed cut rates by 25 bps last week.
Daily US Treasury Yields
Foreign Exchange Market
Energy Complex
The Baker Hughes rig count lost 5 this week. There are 855 oil and gas rigs operating in the US – Down 197 over last year.
Metals Complex
Employment Picture
September Jobs Report – BLS Summary – Released 10/4-19 – The US Economy added 136k nonfarm jobs in September and the Unemployment rate declined 0.2% to 3.5% from 3.7%. Unemployment has reached its lowest level since December 1969 when it was also at 3.5%. Average hourly earnings declined 1 cent. Hiring highlights include Education and Health Services +40k, Professional and Business Services +34k, Government +22k, and -11k Retail Trade.
Weekly Unemployment Claims – Released Thursday 10/3/19 – In the week ending September 28th, initial claims were 219,000, an increase of 4,000 from the previous week’s revised level. The 4-week moving average was 212,500, unchanged from the previous week’s revised average.
Job Openings & Labor Turnover Survey JOLTS – Released Tuesday 9/10/19 – The U.S. Bureau of Labor Statistics reported the number of job openings was little changed at 7.2 million on the last business day of July. Over the month, hires increased by 0.3 million to 6.0 million and separations increased by 0.3 million to 5.8 million. Within separations, the quits rate was little changed at 2.4%. The layoffs and discharges rates was little changed at 1.2%.
Employment Cost Index – Released 7/31/19 – Compensation costs for civilian workers increased 0.6% for the 3-month period ending in June 2019. The 12 month period ending on June 2019 saw compensation costs increase by 2.7% versus 2.8% in June 2018. Wages and salaries were up 2.8% for the 12-month period ending June 2019, versus 2.8% for the 12-month period ending June 2018. Benefit costs increased 2.3% for the 12-month period ending June 2019. For private industry workers, compensation costs increased 2.6% year-over-year, versus 2.9% for the 12 months ending June 2018. This report is published quarterly.
This Week’s Economic Data
Links take you to the data source
U.S. Trade Balance – Released 10/4 – According to the U.S. Census Bureau of Economic Analysis, the goods and services deficit increased in August to $54.9 billion. This increase is $0.9 billion higher than the deficit recorded in July. August exports were $207.9 billion, $0.5 billion more than July exports. August imports were $262.8 billion, $1.3 billion more than July imports. The goods and services deficit has increased $28.3 billion or 7.1% year to date. Year to date exports and imports decreased $3.2 billion or 0.2% and increased $25.1 billion or 1.2% respectively.
PMI Non-Manufacturing Index (ISM Services) – Released 10/3 – Economic activity in the non-manufacturing sector grew in September for the 116th consecutive month. ISM Non-Manufacturing registered 52.6 percent, which is 3.8 percentage points lower than the August reading of 56.4 percent. This represents continued growth in the non-manufacturing sector, at a slightly slower rate.
PMI Manufacturing ISM Index – Released 10/1 – September PMI remains in contraction territory as PMI decreased 1.3% to 47.8% from August’s reading of 49.1%. The New Orders Index was up 0.1%from August’s reading of 47.2% to 47.3% for September. The Production Index registered 47.3% down 2.2%.
U.S. Construction Spending – Released 10/1 – Construction spending increased by 0.1% in August measuring at a seasonally adjusted annual rate of $1,287.3 billion. The August figure is 1.9% below the August 2018 estimate. Private construction spending nearly unchanged from the revised July estimate at $955.0 billion. Public construction spending was 0.4% above the revised July estimate at $330.8 billion.
Chicago PMI – Released 9/30 – Chicago PMI fell 3.3 points in September falling to 47.1, down from 50.4 in August. This decrease shows the index falling back into contraction territory. Business confidence dropped below 50 to 47.3 marking its lowest level since Q3 2009. Supplier Deliveries and Employment were the only Business Activity components showing increases on the month. Production showed the largest decline falling 15.8%. Order backlogs and inventories declined by 8.9% and 6.2% respectively.
Recent Economic Data
Links take you to the data source
Personal Income – Released 9/27 – Personal Income increased 0.4% in August according to the BEA. The majority of the increase in August was due to increases in wages and salaries, nonfarm proprietors’ income, and personal current transfer receipts. Real PCE (the Feds preferred inflation gauge) increased 0.1% in August. Real disposable personal income increased 0.4% in August.
Third Estimate of 2nd Quarter GDP – Released 9/26 – According to the third estimate released by the Bureau of Economic Analysis, Real Gross Domestic Product (Real GDP) increased at an annual rate of 2.0% in the second quarter of 2019. The third estimate is based on data that are more complete than that of the second and advance estimates. The second-quarter increase in real GDP observed positive contributions from personal consumption expenditures (PCE), federal gov’t spending, and state and local gov’t spending that were partly offset by negative contributions from private inventory investment, exports, nonresidential fixed investment, and residential fixed investment.
New Residential Sales – Released 9/25 – Sales of new single-family homes increased 7.1% to 713k, seasonally adjusted, in August. The median sales price of new homes sold in August was $328.4k with an average sales price of $404.2k. At the end of August, the seasonally adjusted estimate of new homes for sale was 326k. This represents a supply of 5.5 months at the current sales rate.
Consumer Confidence – Released 9/24 – The Consumer confidence index declined in September following a slight decline in August. The Index now shows a reading of 125.1 down from 134.2 in August. Escalations in trade and tariff tensions resulted in a more negative assessment of current conditions; however, expectations overall still remain strong and consumers remain confident and willing to spend.
Durable Goods – Released 9/24 – New orders for manufactured durable goods increased $0.5 billion or 0.2% to $250.7 billion in August. The increase in August makes three consecutive months of increases. Fabricated metal products drove the increase; up $0.4 billion or 1.3%.
Existing Home Sales – Released 9/19 – Existing home sales increased in August. Sales gained 1.3% to a seasonally adjusted rate of 5.49 million. This marks two consecutive months of growth. Sales are currently up 2.6% from one year ago. Housing inventory declined to 4.1months of inventory and the total housing inventory decreased to 1.86 million. The median sales price for all types of homes was $278,200, up 4.7% year/y.
Housing Starts – Released 9/18 – New home starts in August were at a seasonally adjusted rate of 1.364 million; up 12.3% above July and 6.6% above last August’s rate. Building Permits were at a seasonally adjusted rate of 1.419 million, up 7.7% compared to July and up 12% over last year.
Industrial Production and Capacity Utilization – Released 9/17 – Industrial production gained 0.6% in August. Manufacturing output increased 0.5% more than reversing its July decline. The index for utilities gained 0.6% and the index for mining gained 1.4%. Total capacity utilization increased 0.4% to 77.9% in August which is 1.9% below its long-run average.
Retail Sales – Released 9/13 – U.S. retail sales for August were up 0.4% month/m increasing to $526.1 billion.
Consumer Price Index – Released 9/12 – The Consumer Price Index increased 0.1% in August. Core CPI, which excludes food and energy increased 0.3%. The monthly changes left total CPI up 1.7% year-over-year and core CPI up 2.4%.
Producer Price Index – Released 9/11 – The Producer Price Index for final demand increased by 0.1% in August. Core PPI was flat. Year over year the index for final demand rose 1.9%.
Consumer Credit – Released 9/9 – Consumer credit increased at a seasonally adjusted annual rate of 6.75% in July. Revolving and nonrevolving credit increased at annual rates of 11.25% and 5.25% respectively. Total Outstanding consumer credit is currently at $4.123 trillion.
US Light Vehicle Sales – Released 9/4 – U.S. light-vehicle sales were at a seasonally adjusted annual rate (SAAR) of 17.07 million units in August versus a SAAR of 16.82 million units in July.
Next week we get data on JOLTS, Consumer Credit, the Producer Price Index, and the Consumer Price Index.
Data Sources:
Bureau of Economic Analysis (BEA)
Congressional Budget Office (CBO)
U.S. Bureau of Labor Statistics (BLS)
Federal Reserve Economic Data (FRED Charts)
CME Fed Watch
U.S. Treasury – Yields
U.S. Census Bureau
Institute for Supply Management (ISM)
Weekly DOL Employment Data
BLS Monthly Jobs Report
JOLTS
US Energy Admin (EIA)
BLS Consumer Price Index CPI
BLS Producer Price Index PPI
Atlanta Fed GDPNOW
NY Fed Nowcast GDP
US Census Bureau Housing Starts
Consumer Credit
USCB Retail Sales
Construction Spending
Federal Reserve Dot Plots
NY Empire Index
Philadelphia Federal Reserve
P/E Ratio Data -Yardeni Research
Technical Analysis Info:
StockCharts.com – Financial Charts
Exponential vs Simple moving average
Other Links:
1973 Arab Oil Embargo
Hunt Brothers Silver
Long-Term Capital bailout
Categories:
Tags: