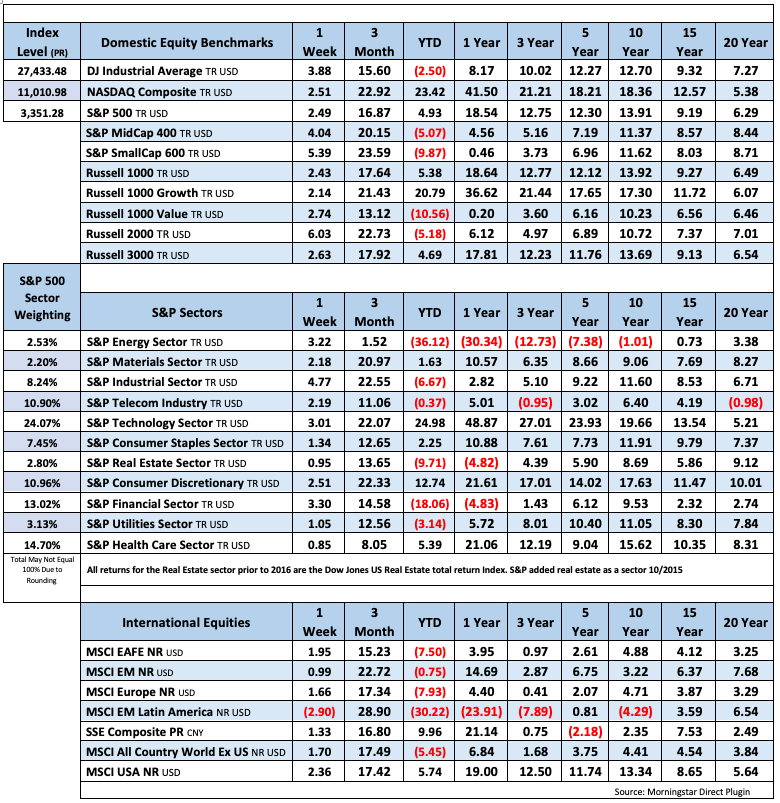
Almost universally positive performance in the equity markets this week. Large, mid, small, growth, value, all major sectors, and most of the international markets ended up this week. Domestic did beat international, small beat large (for a change) with Industrials outperforming all other sectors. Gold closed above 2000 for the first time ever.
Nonfarm payrolls increased by 1.763 million in July. The unemployment rate improved to 10.2% from 11.1% in June while the U6 unemployment registered at 16.5%. Weekly initial unemployment claims still came in above 1 million at 1.186 million, bringing the total number of claims since COVID to over 55 million. The total number of people claiming some sort of unemployment benefit was over 32 million.
The U.S. reported its five million coronavirus with over 160k deaths. John Hopkins Virus Tracker
Fixed Income

7/29 Statement Credit, Liquidity and Balance Sheet June FOMC Meeting Minutes Federal Reserve Dot Plots US Debt Measurement US Corporate Debt Almost 7 Trillion Treasury.gov yields FOMC Policy Normalization Statement
Global Bond Yields
Daily US Treasury Yields
Foreign Exchange Market
Energy Complex
The Baker Hughes rig count fell by 4 this week. There are 247 oil and gas rigs operating in the US – down 687 over last year.
- Brent Crude Oil gained 2.02% this week closing at $44.40/bbl
- WTI Crude Oil gained 2.36% this week to close at $41.22/bbl
- Heating Oil lost 0.33% this week closing at $1.22/gallon
- Natural Gas gained 24.40% this week closing at $2.24 per million BTUs
- Unleaded Gas gained 3.12% this week closing at $1.21/gallon
Metals Complex
- Gold gained 2.12% this week closing at $2028.00/oz
- Silver rose 13.73% on the week closing at $27.54/oz
- Palladium gained 1.46% this week closing at $2176.60/oz
- Platinum gained 5.60% this week closing at $970.40/oz
- Copper lost 2.63% this week closing at $2.79/lb
Employment Picture
July Jobs Report – BLS Summary – Released 8/7/2020 – The US Economy gained 1.8 million nonfarm jobs in July and the Unemployment rate declined to 10.2%. Average hourly earnings increased by 7 cents. Hiring highlights include Leisure and Hospitality +592k, Government +301, Retail Trade +215, Professional and Business Services +170k.
- Average hourly earnings increased by 7 cents in July to $29.39.
- U3 unemployment rate declined to 10.2%. U6 unemployment rate declined to 16.5%.
- The labor force participation rate was negligible standing at 61.4%.
- Average workweek decreased by 0.1 hours to 34.5 hours.
Weekly Unemployment Claims – Released Thursday 8/6/2020 – Initial jobless claims for the week ending August 1st decreased by 249k to 1.186 million. The 4-week moving average was 1.338 million, a decrease of 31k.
Employment Cost Index – Released 7/31/2020 – Compensation costs for civilian workers increased 0.5% for the 3-month period ending in June 2020. The 12 month period ending in June 2020 saw compensation costs increase by 2.7%, same as the 12 month period ending June 2019. Wages and salaries increased 2.9 percent over the year and increased 2.9 percent for the 12-month period ending in June 2019. Benefit costs increased 2.2 percent for the 12-month period ending in June 2020. In June 2019, the increase was 2.3 percent. This report is published quarterly.
Job Openings & Labor Turnover Survey JOLTS – Released 7/7/2020 – The U.S. Bureau of Labor Statistics reported the number and rate of job openings increased by 5.4 million or 3.9% on the last business day of May. Over the month, hires increased by 2.4 million to 6.5 million and separations decreased by 5.8 million to 4.1 million. Within separations, the quits rate increased to 1.6%. The layoffs and discharges rates decreased to 1.4%.
This Week’s Economic Data
Links take you to the data source
Consumer Credit – Released 8/7/2020 – In June, consumer credit decreased at a seasonally adjusted rate of 6.75%. Revolving credit decreased at an annual rate of 31.75 percent, while nonrevolving credit increased at an annual rate of 2.0 percent. Total Outstanding consumer credit is currently at $4.125 trillion.
PMI Non-Manufacturing Index (ISM Services) – Released 8/5/2020 – Economic activity in the non-manufacturing sector grew in July for the second consecutive month. ISM Non-Manufacturing registered 58.1 percent, which is 1.0 percentage point above the adjusted June reading of 57.1 percent.
U.S. Trade Balance – Released 8/5/2020 – According to the U.S. Census Bureau of Economic Analysis, the goods and services deficit decreased in June by $4.1 billion to $50.7 billion. June exports were $158.3 billion, $13.6 billion more than May exports. June imports were $208.9 billion, $9.5 billion more than May imports. The goods and services deficit decreased $23.1 billion or 7.8% year-to-date, from the same period in 2019. Year – over – year exports and imports decreased $199.1 billion or 15.7% and decreased $222.3 billion or 14.2% respectively.
PMI Manufacturing ISM Index – Released 8/3/2020 – July PMI increased 1.6% to 54.2% from June’s reading of 52.6%. The New Orders Index was up 5.1% from June’s reading of 56.4% to 61.5%. The Production Index registered 62.1%, up 4.8%.
U.S. Construction Spending – Released 8/3/2020 – Construction spending declined 0.7% in June measuring at a seasonally adjusted annual rate of $1,355.2 billion. The June figure is 0.1% above the June 2019 estimate. Private construction spending was 0.7% below the revised May estimate at $1,001.9 billion. Public construction spending was 0.7% below the revised May estimate at $353.3 billion.
US Light Vehicle Sales – Released 8/3/2020 – U.S. light vehicle sales were at a seasonally adjusted annual rate (SAAR) of 13.053 million units in July.
Recent Economic Data
Links take you to the data source
Chicago PMI – Released 7/31/2020 – Chicago PMI increased 15.3 points increasing to 51.9. This marks the highest level since May 2019 and ends eleven consecutive months in contraction. The increase in July comes as Covid-19 related shutdowns have eased resulting in increased business activity. Nevertheless, companies noted continued uncertainty amid the ongoing Covid-19 crisis. Among the main five main indicators, New Orders and Production saw the largest monthly gains, while Supplier Deliveries eased.
Personal Income – Released 7/31/2020 – Personal income decreased $222.8 billion or 1.1 percent in June according to estimates released today by the Bureau of Economic Analysis. Disposable personal income (DPI) decreased $255.3 billion or 1.4 percent and personal consumption expenditures (PCE) increased $737.7 billion or 5.6 percent.
Advance Estimate of 2nd Quarter 2020 GDP – Released 7/30/2020 – Real gross domestic product (GDP) decreased at an annual rate of 32.9 percent in the second quarter of 2020, according to the advance estimate released by the Bureau of Economic Analysis. The decline seen in GDP seen in the second quarter marks the worst decline seen in GDP to date. This GDP estimate is based on data that are incomplete or subject to further revision by the source agency. The decrease in real GDP reflected decreases in personal consumption expenditures (PCE), exports, private inventory investment, nonresidential fixed investment, residential fixed investment, and state and local government spending that were partly offset by an increase in federal government spending. Imports, which are a subtraction in the calculation of GDP, decreased.
Consumer Confidence – Released 7/28/2020 – The Consumer confidence index decreased 6.16% in July following an increase in June. The Index now shows a reading of 92.6, down from 98.3 in June.
Durable Goods – Released 7/27/2020 – New orders for manufactured durable goods in June increased for the second consecutive month up $14.0 billion or 7.3% to $206.9 billion. Transportation equipment led the increase rising $9.2 billion or 20.0% to $55.3 billion.
New Residential Sales – Released 7/24/2020 – Sales of new single-family homes increased 13.8% to 776k, seasonally adjusted, in June. The median sales price of new homes sold in June was $329,200 with an average sales price of $384,700. At the end of June, the seasonally adjusted estimate of new homes for sale was 307k. This represents a supply of 4.7 months at the current sales rate.
Existing Home Sales – Released 7/22/2020 – Existing home sales strongly rebounded in June following three consecutive months of declines. Sales increased 20.7% to a seasonally adjusted rate of 4.72 million in June. Sales are currently down 11.3% from one year ago. Housing inventory sits at 1.57 million units. Up 1.3% over last month. Down 18.2% over last year. Unsold inventory sits at a 4.0 month supply. The median existing home price for all housing types was $295,300.
Housing Starts – Released 7/17/2020 – New home starts in June were at a seasonally adjusted annual rate of 1.186 million; down 17.3% below May but 4.0% below last June’s rate. Building Permits were at a seasonally adjusted annual rate of 1.241 million, up 2.1% compared to May but down 2.5% over last year.
Retail Sales – Released 7/16/2020 – U.S. retail sales for June increased 7.5% to $524.3 billion. U.S. retail sales are up 1.1% year/y.
Industrial Production and Capacity Utilization – Released 7/15/2020 – In June Industrial production increased 5.4%. Total Industrial production is still 10.9% below its pre-pandemic February level. Manufacturing increased 7.2%. Motor vehicles and parts saw the largest gain at 105.0%. Total industrial production was 97.5% of its 2012 average which is 10.8% lower in June than a year ago. Total capacity utilization increased 3.5% to 68.6% in June which is 11.2% below its long-run average.
Consumer Price Index – Released 7/14/2020 – The Consumer Price Index increased 0.6% in June. Core CPI, which excludes food and energy also increased 0.2%. The monthly changes left total CPI up 0.6% year-over-year and core CPI up 1.2%.
Producer Price Index – Released 7/10/2020 – The Producer Price Index for final demand decreased 0.2% in May.
Next week we get data on PPI, CPI, Industrial Production and Capacity Utilization, Retail Sales, and JOLTS.
Data Sources:
Bureau of Economic Analysis (BEA)
Congressional Budget Office (CBO)
U.S. Bureau of Labor Statistics (BLS)
Federal Reserve Economic Data (FRED Charts)
CME Fed Watch
U.S. Treasury – Yields
U.S. Census Bureau
Institute for Supply Management (ISM)
Weekly DOL Employment Data
BLS Monthly Jobs Report
JOLTS
US Energy Admin (EIA)
BLS Consumer Price Index CPI
BLS Producer Price Index PPI
Atlanta Fed GDPNOW
NY Fed Nowcast GDP
US Census Bureau Housing Starts
Consumer Credit
USCB Retail Sales
Construction Spending
Federal Reserve Dot Plots
NY Empire Index
Philadelphia Federal Reserve
P/E Ratio Data -Yardeni Research
Technical Analysis Info:
StockCharts.com – Financial Charts
Exponential vs Simple moving average
Other Links:
1973 Arab Oil Embargo
Hunt Brothers Silver
Long-Term Capital bailout


Week 32 Talking Points
Almost universally positive performance in the equity markets this week. Large, mid, small, growth, value, all major sectors, and most of the international markets ended up this week. Domestic did beat international, small beat large (for a change) with Industrials outperforming all other sectors. Gold closed above 2000 for the first time ever.
Nonfarm payrolls increased by 1.763 million in July. The unemployment rate improved to 10.2% from 11.1% in June while the U6 unemployment registered at 16.5%. Weekly initial unemployment claims still came in above 1 million at 1.186 million, bringing the total number of claims since COVID to over 55 million. The total number of people claiming some sort of unemployment benefit was over 32 million.
The U.S. reported its five million coronavirus with over 160k deaths. John Hopkins Virus Tracker
Table of Contents
Fixed Income
7/29 Statement Credit, Liquidity and Balance Sheet June FOMC Meeting Minutes Federal Reserve Dot Plots US Debt Measurement US Corporate Debt Almost 7 Trillion Treasury.gov yields FOMC Policy Normalization Statement
Global Bond Yields
Daily US Treasury Yields
Foreign Exchange Market
Energy Complex
The Baker Hughes rig count fell by 4 this week. There are 247 oil and gas rigs operating in the US – down 687 over last year.
Metals Complex
Employment Picture
July Jobs Report – BLS Summary – Released 8/7/2020 – The US Economy gained 1.8 million nonfarm jobs in July and the Unemployment rate declined to 10.2%. Average hourly earnings increased by 7 cents. Hiring highlights include Leisure and Hospitality +592k, Government +301, Retail Trade +215, Professional and Business Services +170k.
Weekly Unemployment Claims – Released Thursday 8/6/2020 – Initial jobless claims for the week ending August 1st decreased by 249k to 1.186 million. The 4-week moving average was 1.338 million, a decrease of 31k.
Employment Cost Index – Released 7/31/2020 – Compensation costs for civilian workers increased 0.5% for the 3-month period ending in June 2020. The 12 month period ending in June 2020 saw compensation costs increase by 2.7%, same as the 12 month period ending June 2019. Wages and salaries increased 2.9 percent over the year and increased 2.9 percent for the 12-month period ending in June 2019. Benefit costs increased 2.2 percent for the 12-month period ending in June 2020. In June 2019, the increase was 2.3 percent. This report is published quarterly.
Job Openings & Labor Turnover Survey JOLTS – Released 7/7/2020 – The U.S. Bureau of Labor Statistics reported the number and rate of job openings increased by 5.4 million or 3.9% on the last business day of May. Over the month, hires increased by 2.4 million to 6.5 million and separations decreased by 5.8 million to 4.1 million. Within separations, the quits rate increased to 1.6%. The layoffs and discharges rates decreased to 1.4%.
This Week’s Economic Data
Links take you to the data source
Consumer Credit – Released 8/7/2020 – In June, consumer credit decreased at a seasonally adjusted rate of 6.75%. Revolving credit decreased at an annual rate of 31.75 percent, while nonrevolving credit increased at an annual rate of 2.0 percent. Total Outstanding consumer credit is currently at $4.125 trillion.
PMI Non-Manufacturing Index (ISM Services) – Released 8/5/2020 – Economic activity in the non-manufacturing sector grew in July for the second consecutive month. ISM Non-Manufacturing registered 58.1 percent, which is 1.0 percentage point above the adjusted June reading of 57.1 percent.
U.S. Trade Balance – Released 8/5/2020 – According to the U.S. Census Bureau of Economic Analysis, the goods and services deficit decreased in June by $4.1 billion to $50.7 billion. June exports were $158.3 billion, $13.6 billion more than May exports. June imports were $208.9 billion, $9.5 billion more than May imports. The goods and services deficit decreased $23.1 billion or 7.8% year-to-date, from the same period in 2019. Year – over – year exports and imports decreased $199.1 billion or 15.7% and decreased $222.3 billion or 14.2% respectively.
PMI Manufacturing ISM Index – Released 8/3/2020 – July PMI increased 1.6% to 54.2% from June’s reading of 52.6%. The New Orders Index was up 5.1% from June’s reading of 56.4% to 61.5%. The Production Index registered 62.1%, up 4.8%.
U.S. Construction Spending – Released 8/3/2020 – Construction spending declined 0.7% in June measuring at a seasonally adjusted annual rate of $1,355.2 billion. The June figure is 0.1% above the June 2019 estimate. Private construction spending was 0.7% below the revised May estimate at $1,001.9 billion. Public construction spending was 0.7% below the revised May estimate at $353.3 billion.
US Light Vehicle Sales – Released 8/3/2020 – U.S. light vehicle sales were at a seasonally adjusted annual rate (SAAR) of 13.053 million units in July.
Recent Economic Data
Links take you to the data source
Chicago PMI – Released 7/31/2020 – Chicago PMI increased 15.3 points increasing to 51.9. This marks the highest level since May 2019 and ends eleven consecutive months in contraction. The increase in July comes as Covid-19 related shutdowns have eased resulting in increased business activity. Nevertheless, companies noted continued uncertainty amid the ongoing Covid-19 crisis. Among the main five main indicators, New Orders and Production saw the largest monthly gains, while Supplier Deliveries eased.
Personal Income – Released 7/31/2020 – Personal income decreased $222.8 billion or 1.1 percent in June according to estimates released today by the Bureau of Economic Analysis. Disposable personal income (DPI) decreased $255.3 billion or 1.4 percent and personal consumption expenditures (PCE) increased $737.7 billion or 5.6 percent.
Advance Estimate of 2nd Quarter 2020 GDP – Released 7/30/2020 – Real gross domestic product (GDP) decreased at an annual rate of 32.9 percent in the second quarter of 2020, according to the advance estimate released by the Bureau of Economic Analysis. The decline seen in GDP seen in the second quarter marks the worst decline seen in GDP to date. This GDP estimate is based on data that are incomplete or subject to further revision by the source agency. The decrease in real GDP reflected decreases in personal consumption expenditures (PCE), exports, private inventory investment, nonresidential fixed investment, residential fixed investment, and state and local government spending that were partly offset by an increase in federal government spending. Imports, which are a subtraction in the calculation of GDP, decreased.
Consumer Confidence – Released 7/28/2020 – The Consumer confidence index decreased 6.16% in July following an increase in June. The Index now shows a reading of 92.6, down from 98.3 in June.
Durable Goods – Released 7/27/2020 – New orders for manufactured durable goods in June increased for the second consecutive month up $14.0 billion or 7.3% to $206.9 billion. Transportation equipment led the increase rising $9.2 billion or 20.0% to $55.3 billion.
New Residential Sales – Released 7/24/2020 – Sales of new single-family homes increased 13.8% to 776k, seasonally adjusted, in June. The median sales price of new homes sold in June was $329,200 with an average sales price of $384,700. At the end of June, the seasonally adjusted estimate of new homes for sale was 307k. This represents a supply of 4.7 months at the current sales rate.
Existing Home Sales – Released 7/22/2020 – Existing home sales strongly rebounded in June following three consecutive months of declines. Sales increased 20.7% to a seasonally adjusted rate of 4.72 million in June. Sales are currently down 11.3% from one year ago. Housing inventory sits at 1.57 million units. Up 1.3% over last month. Down 18.2% over last year. Unsold inventory sits at a 4.0 month supply. The median existing home price for all housing types was $295,300.
Housing Starts – Released 7/17/2020 – New home starts in June were at a seasonally adjusted annual rate of 1.186 million; down 17.3% below May but 4.0% below last June’s rate. Building Permits were at a seasonally adjusted annual rate of 1.241 million, up 2.1% compared to May but down 2.5% over last year.
Retail Sales – Released 7/16/2020 – U.S. retail sales for June increased 7.5% to $524.3 billion. U.S. retail sales are up 1.1% year/y.
Industrial Production and Capacity Utilization – Released 7/15/2020 – In June Industrial production increased 5.4%. Total Industrial production is still 10.9% below its pre-pandemic February level. Manufacturing increased 7.2%. Motor vehicles and parts saw the largest gain at 105.0%. Total industrial production was 97.5% of its 2012 average which is 10.8% lower in June than a year ago. Total capacity utilization increased 3.5% to 68.6% in June which is 11.2% below its long-run average.
Consumer Price Index – Released 7/14/2020 – The Consumer Price Index increased 0.6% in June. Core CPI, which excludes food and energy also increased 0.2%. The monthly changes left total CPI up 0.6% year-over-year and core CPI up 1.2%.
Producer Price Index – Released 7/10/2020 – The Producer Price Index for final demand decreased 0.2% in May.
Next week we get data on PPI, CPI, Industrial Production and Capacity Utilization, Retail Sales, and JOLTS.
Data Sources:
Bureau of Economic Analysis (BEA)
Congressional Budget Office (CBO)
U.S. Bureau of Labor Statistics (BLS)
Federal Reserve Economic Data (FRED Charts)
CME Fed Watch
U.S. Treasury – Yields
U.S. Census Bureau
Institute for Supply Management (ISM)
Weekly DOL Employment Data
BLS Monthly Jobs Report
JOLTS
US Energy Admin (EIA)
BLS Consumer Price Index CPI
BLS Producer Price Index PPI
Atlanta Fed GDPNOW
NY Fed Nowcast GDP
US Census Bureau Housing Starts
Consumer Credit
USCB Retail Sales
Construction Spending
Federal Reserve Dot Plots
NY Empire Index
Philadelphia Federal Reserve
P/E Ratio Data -Yardeni Research
Technical Analysis Info:
StockCharts.com – Financial Charts
Exponential vs Simple moving average
Other Links:
1973 Arab Oil Embargo
Hunt Brothers Silver
Long-Term Capital bailout
Categories:
Tags: