Good Life Advisors – Talking Points – Week 27
US equities were lower this week, though the downside was fairly modest despite some cautious Fed expectations and a big backup in yields. There wasn’t much readthrough in sector performance. Outperformers included oilfield services, fertilizer, airlines, and banks. Most big tech names were mixed, while underperformers included homebuilders, semis, hospitals, managed care, pharma, oil majors, precious metals miners, building materials, rails, athletic apparel, restaurants, casinos, and telecom. Treasuries came under pressure with the biggest pockets of weakness in the belly of the curve. The dollar index was down 0.6. Gold finished the week up 0.2%. Bitcoin futureswere up 0.7%. WTI crude ended the week up 4.6%.
The big story of the week was the Treasury selloff that sent the 2Y yield to 5%, and the 10y yield back above 4%. The week’s backup in yields reflects bets that Fed will hold rates higher for longer after a hot batch of economic data. The Citi economic surprise index hit a two-year high this week after ADP private payrolls, initial jobless claims, and ISM Services all beat. However, Treasury yields fell after Friday’s June payrolls report, which missed consensus for the first time since Mar-22. While stocks have been resilient in the face of rising rates, some analysts have taken a more cautious outlook as investors have somewhat shifted away from soft-landing optimism and toward hard-landing fears. BofA wrote Friday that financial conditions are likely to further tighten in Q3, further entrenching the higher-for-longer and hard-landing views. The team also noted a re-steepening of the yield curve could be a key Q3 recession signal.
Bearish talking points this week continued to center around the risks of higher-for-longer Fed policy. The market median terminal rate now stands around 5.40%, the highest since before the March banking turmoil, while the year-end 2024 fed funds rate forecast of ~4.25% was up more than 35 bp from last week. A tightening credit backdrop also remains a key downside risk. Morgan Stanley analysts warned this week that corporate borrowers, particularly lower-quality borrowers, are increasingly coming under stress from rising floating rate obligations, which could squeeze margins in quarters ahead. A weakening consumer impulse also remains an overhang given the coming resumption of student loan repayments, tighter financial conditions, and exhaustion of Covid-era excess savings.
The soft landing remains the key upside narrative. A dynamic seen in several disinflationary data points this week including falling prices paid components in both ISM manufacturing and services reports. There were some emerging signs of the labor market cooling without outright contracting as well, including the first headline payrolls miss in 15 months, the initial jobless claims four-week average holding near highest levels since Nov-21, fewer May job openings than expected, and the job vacancy-to-unemployed ration falling in May to the lowest level since Oct-21. And while June average hourly wage growth came in hotter than expected, economists said they expect some weakness in months ahead given hiring slowdown and participation rate plateauing just below pre-pandemic levels. Other pieces of the bullish narrative include optimism around Q2 earnings, the recent rise in yields attributed to stronger economic growth rather than inflation fears, AI optimism, FOMO, retail investor momentum and rising real wage growth, resilient consumer spending, and housing market strength.
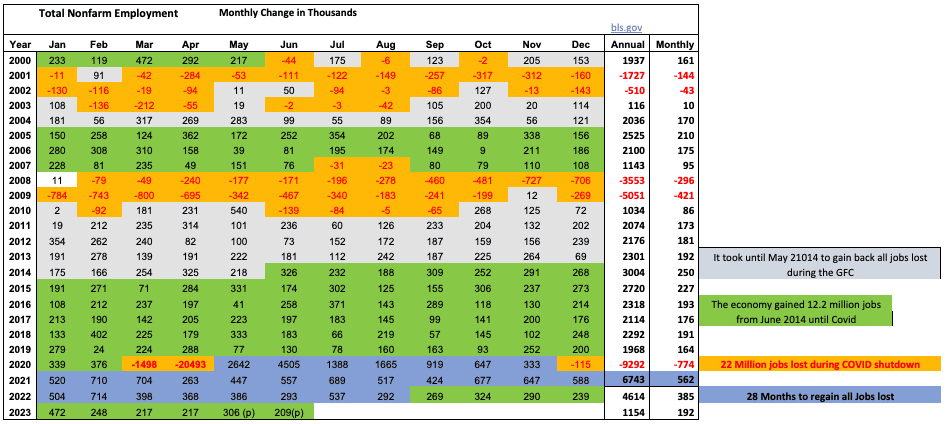
As mentioned, the job report came out Friday and was slightly below expectations coming at 209k for June and a 30k revision downward for May. Total employment is the highest ever at 156.2 million workers in the US.

Fixed Income
Yield Curve
May FOMC Statement March Fed Minutes Balance Sheet Reduction Plan Credit, Liquidity and Balance Sheet Federal Reserve Dot Plots
Treasury.gov yields FOMC Policy Normalization Statement Longer- Run Goals Jan 2022
Foreign Exchange Market
Energy Complex
The Baker Hughes rig count was up 6 this week. There are 680 oil and gas rigs operating in the US – down 72 over last year.
Metals Complex
Employment Picture
June Jobs Report – BLS Summary – Released 7/7/2023 – The US Economy added 209k nonfarm jobs in June and the Unemployment rate was little changed at 3.6%. Average hourly earnings increased 12 cents to $33.58. Hiring highlights include +21k Leisure and Hospitality, +23k Construction, +73k Education and Health Services, +60 Government, and +21k Professional and Business Services.
- Average hourly earnings increased 12 cents/0.4% to $33.58.
- U3 unemployment rate decreased 0.1% to 3.6%. U6 unemployment rate increased 0.2% to 6.9%.
- The labor force participation rate was unchanged at 62.6%.
- Average work week increased 0.1 hours to 34.4 hours.
Weekly Unemployment Claims – Released Thursday 7/6/2023 –In the week ending July 1, the advance figure for seasonally adjusted initial claims was 248,000, increasing 12,000 from the previous week’s revised level. The 4-week moving average was 253,250 a decrease of 3,500 from the previous week’s revised average.
Job Openings & Labor Turnover Survey JOLTS – Released 7/6/2023 – The number of job openings decreased to 9.8 million on the last business day of May, the U.S. Bureau of Labor Statistics reported. Over the month the number of hires and total separations changed little at 6.2 million and 5.9 million, respectively. Within separations, quits (4.0 million) increased and discharges (1.6 million) changed little.
Employment Cost Index – Released 4/28/2023 – Compensation costs for civilian workers increased 1.2% for the 3-month period ending in March 2023. The 12-month period ending in March 2023 saw compensation costs increase by 4.8. The 12-month period ending March 2022 increased 4.5%. Wages and salaries increased 5.0 percent over the 12-month March 2023 and increased 4.7 percent for the 12-month period ending in March 2022. Benefit costs increased 4.5 percent over the 12-month period ending March 2023 and increased 4.1 percent for the 12-month period ending in March 2022. This report is published quarterly.
This Week’s Economic Data
Links take you to the data source
U.S. Trade Balance – Released 7/6/2023 – The U.S. Census Bureau and the U.S. Bureau of Economic Analysis announced that the goods and services deficit was $69.0 billion in May, down $5.5 billion from $74.4 billion in April. May exports were $247.1 billion, $2.1 billion less than April exports. May imports were $316.1 billion, $7.5 billion less than April imports. The May decrease in the goods and services deficit reflected a decrease in the goods deficit of $4.8 billion to $91.3 billion and an increase in the services surplus of $0.7 billion to $22.3 billion.
PMI Non-Manufacturing Index – Released 7/5/2023 – Economic activity in the services sector expanded in June for the sixth consecutive month as the Services PMI® registered 53.9 percent, 3.6 percentage point higher than May’s reading of 50.3 percent.
U.S. Construction Spending– Released 7/3/2023 – Construction spending during May 2023 was estimated at a seasonally adjusted annual rate of $1,925.6 billion, 0.9 percent above the revised April estimate of $1,909.0 billion. The May figure is 2.4 percent above the May 2022 estimate of $1,880.9 billion.
PMI Manufacturing Index – Released 7/3/2023 – The June Manufacturing PMI registered 46.0 percent, 0.9 percentage points lower than the 46.9 percent recorded in May. Regarding the overall economy, this figure indicates a seventh month of contraction after a 30-month period of expansion. The New Orders Index remained in contraction territory at 45.6 percent, 3.0 percentage points higher than the figure of 42.6 percent recorded in May. The Production Index reading of 46.7 percent is a 4.4-percentage point decrease compared to May’s figure of 51.1 percent.
Recent Economic Data
Links take you to the data source
US Light Vehicle Sales – Released 6/30/2023 – U.S. light vehicle sales were at a seasonally adjusted annual rate (SAAR) of 15.058 million units in May.
Chicago PMI – Released 6/30/2023 – Chicago PMI remained in contraction territory in June increasing to 41.5 points up from 40.4 points in May. This marks ten months in contractionary territory.
Personal Income – Released 6/30/2023 – Personal income increased $91.2 billion (0.4 percent at a monthly rate) in May. Disposable personal income (DPI) increased $86.7 billion (0.4 percent). Personal consumption expenditures (PCE) increased $18.9 billion (0.1 percent).
3rd Estimate of 1st Quarter 2023 GDP – Released 6/29/2023 – Real gross domestic product (GDP) increased at an annual rate of 2.0 percent in the first quarter of 2023, according to the “third” estimate released by the Bureau of Economic Analysis. In the fourth quarter, real GDP increased 2.6 percent. The “third” GDP estimate is based on more complete source data than were available for the “second” estimate issued last month. In the second estimate, the increase in real GDP was 1.3 percent. The updated estimates primarily reflected upward revisions to exports and consumer spending that were partly offset by downward revisions to nonresidential fixed investment and federal government spending. Imports, which are a subtraction in the calculation of GDP, were revised down. The increase in real GDP in the first quarter reflected increases in consumer spending, exports, state and local government spending, federal government spending, and nonresidential fixed investment that were partly offset by decreases in private inventory investment and residential fixed investment. Imports increased.
Durable Goods – Released 6/27/2023 – New orders for manufactured durable goods in May, up three consecutive months, increased $4.9 billion or 1.7 percent to $288.2 billion, the U.S. Census Bureau announced today. This followed a 1.2 percent April increase. Excluding transportation, new orders increased 0.6 percent. Excluding defense, new orders increased 3.0 percent. Transportation equipment, also up three consecutive months, drove the increase, $3.9 billion or 3.9 percent to $102.6 billion.
Consumer Confidence – Released 6/27/2023 – Consumer Confidence increased in June to 109.7, up from 102.5 in May. Consumer confidence improved in June to its highest level since January 2022, reflecting improved current conditions and an improvement in expectations.
New Residential Sales – Released 6/26/2023 – Sales of new single‐family houses in May 2023 were at a seasonally adjusted annual rate of 763,000, according to estimates released jointly by the U.S. Census Bureau and the Department of Housing and Urban Development. This is 12.2 percent above the revised April rate of 680,000 and is 20.0 percent above the May 2022 estimate of 636,000. The median sales price of new houses sold in May 2023 was $416,300. The average sales price was $487,300. At the end of May, the seasonally adjusted estimate of new homes for sale was 428,000, a supply of 6.7 months at the current sales rate.
Existing Home Sales – Released 6/22/2023 – May 2023 brought 4.30 million in sales, an increase of 0.2% from April. The median sales price was $396,100. The current unsold housing inventory was 3.0 months of inventory.
Housing Starts – Released 6/20/2023 – May housing starts came in at 1,613,000, 21.7% above the April estimate and 5.7% above the May 2022 rate. Building permits were 5.2% above the April rate at $1,491,000 but 12.7% below the May 2022 rate.
Industrial Production and Capacity Utilization – Released 6/15/2023 – Industrial production decreased 0.2% in May. Utilities output fell 1.8%. Manufacturing increased 0.1%. Mining fell 0.4%. Capacity utilization declined to 79.6% in May, 0.1% below the long-run average.
Retail Sales – Released 6/15/2023 – Headline retail sales increased 0.3% in May and are up 1.6% above May 2022.
Producer Price Index – Released 6/14/2023 – The Producer Price Index for final demand declined 0.3 percent in May, seasonally adjusted. Final demand prices rose 0.2 percent in April and fell 0.4 in March. On an unadjusted basis, the index for final demand moved up 1.1 percent for the 12 months ended in May.
Consumer Price Index – Released 6/13/2023 – The Consumer Price Index for All Urban Consumers rose 0.1 percent in May on a seasonally adjusted basis, after increasing 0.4 percent in April. Over the last 12 months, the all-items index increased 4.0 percent before seasonal adjustment.
Consumer Credit – Released 6/7/2023 – Consumer credit increased at a seasonally adjusted annual rate of 5.7 percent in April. Revolving credit increased at an annual rate of 13.1 percent, while nonrevolving credit increased at an annual rate of 3.2 percent.
Next week we get data on Consumer Credit, CPI, and PPI.
Data Sources:
Bureau of Economic Analysis (BEA)
Congressional Budget Office (CBO)
U.S. Bureau of Labor Statistics (BLS)
Federal Reserve Economic Data (FRED Charts)
CME Fed Watch
U.S. Treasury – Yields
U.S. Census Bureau
Institute for Supply Management (ISM)
Weekly DOL Employment Data
BLS Monthly Jobs Report
JOLTS
US Energy Admin (EIA)
BLS Consumer Price Index CPI
BLS Producer Price Index PPI
Atlanta Fed GDPNOW
NY Fed Nowcast GDP
US Census Bureau Housing Starts
Consumer Credit
USCB Retail Sales
Construction Spending
Federal Reserve Dot Plots
NY Empire Index
Philadelphia Federal Reserve
P/E Ratio Data -Yardeni Research
Technical Analysis Info:
StockCharts.com – Financial Charts
Exponential vs Simple moving average
Koyfin.com
Other Links:
1973 Arab Oil Embargo
Hunt Brothers Silver
Long-Term Capital bailout
Asian Contagion


Table of Contents
Good Life Advisors – Talking Points – Week 27
US equities were lower this week, though the downside was fairly modest despite some cautious Fed expectations and a big backup in yields. There wasn’t much readthrough in sector performance. Outperformers included oilfield services, fertilizer, airlines, and banks. Most big tech names were mixed, while underperformers included homebuilders, semis, hospitals, managed care, pharma, oil majors, precious metals miners, building materials, rails, athletic apparel, restaurants, casinos, and telecom. Treasuries came under pressure with the biggest pockets of weakness in the belly of the curve. The dollar index was down 0.6. Gold finished the week up 0.2%. Bitcoin futureswere up 0.7%. WTI crude ended the week up 4.6%.
The big story of the week was the Treasury selloff that sent the 2Y yield to 5%, and the 10y yield back above 4%. The week’s backup in yields reflects bets that Fed will hold rates higher for longer after a hot batch of economic data. The Citi economic surprise index hit a two-year high this week after ADP private payrolls, initial jobless claims, and ISM Services all beat. However, Treasury yields fell after Friday’s June payrolls report, which missed consensus for the first time since Mar-22. While stocks have been resilient in the face of rising rates, some analysts have taken a more cautious outlook as investors have somewhat shifted away from soft-landing optimism and toward hard-landing fears. BofA wrote Friday that financial conditions are likely to further tighten in Q3, further entrenching the higher-for-longer and hard-landing views. The team also noted a re-steepening of the yield curve could be a key Q3 recession signal.
Bearish talking points this week continued to center around the risks of higher-for-longer Fed policy. The market median terminal rate now stands around 5.40%, the highest since before the March banking turmoil, while the year-end 2024 fed funds rate forecast of ~4.25% was up more than 35 bp from last week. A tightening credit backdrop also remains a key downside risk. Morgan Stanley analysts warned this week that corporate borrowers, particularly lower-quality borrowers, are increasingly coming under stress from rising floating rate obligations, which could squeeze margins in quarters ahead. A weakening consumer impulse also remains an overhang given the coming resumption of student loan repayments, tighter financial conditions, and exhaustion of Covid-era excess savings.
The soft landing remains the key upside narrative. A dynamic seen in several disinflationary data points this week including falling prices paid components in both ISM manufacturing and services reports. There were some emerging signs of the labor market cooling without outright contracting as well, including the first headline payrolls miss in 15 months, the initial jobless claims four-week average holding near highest levels since Nov-21, fewer May job openings than expected, and the job vacancy-to-unemployed ration falling in May to the lowest level since Oct-21. And while June average hourly wage growth came in hotter than expected, economists said they expect some weakness in months ahead given hiring slowdown and participation rate plateauing just below pre-pandemic levels. Other pieces of the bullish narrative include optimism around Q2 earnings, the recent rise in yields attributed to stronger economic growth rather than inflation fears, AI optimism, FOMO, retail investor momentum and rising real wage growth, resilient consumer spending, and housing market strength.
As mentioned, the job report came out Friday and was slightly below expectations coming at 209k for June and a 30k revision downward for May. Total employment is the highest ever at 156.2 million workers in the US.
Fixed Income
Yield Curve
May FOMC Statement March Fed Minutes Balance Sheet Reduction Plan Credit, Liquidity and Balance Sheet Federal Reserve Dot Plots
Treasury.gov yields FOMC Policy Normalization Statement Longer- Run Goals Jan 2022
Foreign Exchange Market
Energy Complex
The Baker Hughes rig count was up 6 this week. There are 680 oil and gas rigs operating in the US – down 72 over last year.
Metals Complex
Employment Picture
June Jobs Report – BLS Summary – Released 7/7/2023 – The US Economy added 209k nonfarm jobs in June and the Unemployment rate was little changed at 3.6%. Average hourly earnings increased 12 cents to $33.58. Hiring highlights include +21k Leisure and Hospitality, +23k Construction, +73k Education and Health Services, +60 Government, and +21k Professional and Business Services.
Weekly Unemployment Claims – Released Thursday 7/6/2023 –In the week ending July 1, the advance figure for seasonally adjusted initial claims was 248,000, increasing 12,000 from the previous week’s revised level. The 4-week moving average was 253,250 a decrease of 3,500 from the previous week’s revised average.
Job Openings & Labor Turnover Survey JOLTS – Released 7/6/2023 – The number of job openings decreased to 9.8 million on the last business day of May, the U.S. Bureau of Labor Statistics reported. Over the month the number of hires and total separations changed little at 6.2 million and 5.9 million, respectively. Within separations, quits (4.0 million) increased and discharges (1.6 million) changed little.
Employment Cost Index – Released 4/28/2023 – Compensation costs for civilian workers increased 1.2% for the 3-month period ending in March 2023. The 12-month period ending in March 2023 saw compensation costs increase by 4.8. The 12-month period ending March 2022 increased 4.5%. Wages and salaries increased 5.0 percent over the 12-month March 2023 and increased 4.7 percent for the 12-month period ending in March 2022. Benefit costs increased 4.5 percent over the 12-month period ending March 2023 and increased 4.1 percent for the 12-month period ending in March 2022. This report is published quarterly.
This Week’s Economic Data
Links take you to the data source
U.S. Trade Balance – Released 7/6/2023 – The U.S. Census Bureau and the U.S. Bureau of Economic Analysis announced that the goods and services deficit was $69.0 billion in May, down $5.5 billion from $74.4 billion in April. May exports were $247.1 billion, $2.1 billion less than April exports. May imports were $316.1 billion, $7.5 billion less than April imports. The May decrease in the goods and services deficit reflected a decrease in the goods deficit of $4.8 billion to $91.3 billion and an increase in the services surplus of $0.7 billion to $22.3 billion.
PMI Non-Manufacturing Index – Released 7/5/2023 – Economic activity in the services sector expanded in June for the sixth consecutive month as the Services PMI® registered 53.9 percent, 3.6 percentage point higher than May’s reading of 50.3 percent.
U.S. Construction Spending– Released 7/3/2023 – Construction spending during May 2023 was estimated at a seasonally adjusted annual rate of $1,925.6 billion, 0.9 percent above the revised April estimate of $1,909.0 billion. The May figure is 2.4 percent above the May 2022 estimate of $1,880.9 billion.
PMI Manufacturing Index – Released 7/3/2023 – The June Manufacturing PMI registered 46.0 percent, 0.9 percentage points lower than the 46.9 percent recorded in May. Regarding the overall economy, this figure indicates a seventh month of contraction after a 30-month period of expansion. The New Orders Index remained in contraction territory at 45.6 percent, 3.0 percentage points higher than the figure of 42.6 percent recorded in May. The Production Index reading of 46.7 percent is a 4.4-percentage point decrease compared to May’s figure of 51.1 percent.
Recent Economic Data
Links take you to the data source
US Light Vehicle Sales – Released 6/30/2023 – U.S. light vehicle sales were at a seasonally adjusted annual rate (SAAR) of 15.058 million units in May.
Chicago PMI – Released 6/30/2023 – Chicago PMI remained in contraction territory in June increasing to 41.5 points up from 40.4 points in May. This marks ten months in contractionary territory.
Personal Income – Released 6/30/2023 – Personal income increased $91.2 billion (0.4 percent at a monthly rate) in May. Disposable personal income (DPI) increased $86.7 billion (0.4 percent). Personal consumption expenditures (PCE) increased $18.9 billion (0.1 percent).
3rd Estimate of 1st Quarter 2023 GDP – Released 6/29/2023 – Real gross domestic product (GDP) increased at an annual rate of 2.0 percent in the first quarter of 2023, according to the “third” estimate released by the Bureau of Economic Analysis. In the fourth quarter, real GDP increased 2.6 percent. The “third” GDP estimate is based on more complete source data than were available for the “second” estimate issued last month. In the second estimate, the increase in real GDP was 1.3 percent. The updated estimates primarily reflected upward revisions to exports and consumer spending that were partly offset by downward revisions to nonresidential fixed investment and federal government spending. Imports, which are a subtraction in the calculation of GDP, were revised down. The increase in real GDP in the first quarter reflected increases in consumer spending, exports, state and local government spending, federal government spending, and nonresidential fixed investment that were partly offset by decreases in private inventory investment and residential fixed investment. Imports increased.
Durable Goods – Released 6/27/2023 – New orders for manufactured durable goods in May, up three consecutive months, increased $4.9 billion or 1.7 percent to $288.2 billion, the U.S. Census Bureau announced today. This followed a 1.2 percent April increase. Excluding transportation, new orders increased 0.6 percent. Excluding defense, new orders increased 3.0 percent. Transportation equipment, also up three consecutive months, drove the increase, $3.9 billion or 3.9 percent to $102.6 billion.
Consumer Confidence – Released 6/27/2023 – Consumer Confidence increased in June to 109.7, up from 102.5 in May. Consumer confidence improved in June to its highest level since January 2022, reflecting improved current conditions and an improvement in expectations.
New Residential Sales – Released 6/26/2023 – Sales of new single‐family houses in May 2023 were at a seasonally adjusted annual rate of 763,000, according to estimates released jointly by the U.S. Census Bureau and the Department of Housing and Urban Development. This is 12.2 percent above the revised April rate of 680,000 and is 20.0 percent above the May 2022 estimate of 636,000. The median sales price of new houses sold in May 2023 was $416,300. The average sales price was $487,300. At the end of May, the seasonally adjusted estimate of new homes for sale was 428,000, a supply of 6.7 months at the current sales rate.
Existing Home Sales – Released 6/22/2023 – May 2023 brought 4.30 million in sales, an increase of 0.2% from April. The median sales price was $396,100. The current unsold housing inventory was 3.0 months of inventory.
Housing Starts – Released 6/20/2023 – May housing starts came in at 1,613,000, 21.7% above the April estimate and 5.7% above the May 2022 rate. Building permits were 5.2% above the April rate at $1,491,000 but 12.7% below the May 2022 rate.
Industrial Production and Capacity Utilization – Released 6/15/2023 – Industrial production decreased 0.2% in May. Utilities output fell 1.8%. Manufacturing increased 0.1%. Mining fell 0.4%. Capacity utilization declined to 79.6% in May, 0.1% below the long-run average.
Retail Sales – Released 6/15/2023 – Headline retail sales increased 0.3% in May and are up 1.6% above May 2022.
Producer Price Index – Released 6/14/2023 – The Producer Price Index for final demand declined 0.3 percent in May, seasonally adjusted. Final demand prices rose 0.2 percent in April and fell 0.4 in March. On an unadjusted basis, the index for final demand moved up 1.1 percent for the 12 months ended in May.
Consumer Price Index – Released 6/13/2023 – The Consumer Price Index for All Urban Consumers rose 0.1 percent in May on a seasonally adjusted basis, after increasing 0.4 percent in April. Over the last 12 months, the all-items index increased 4.0 percent before seasonal adjustment.
Consumer Credit – Released 6/7/2023 – Consumer credit increased at a seasonally adjusted annual rate of 5.7 percent in April. Revolving credit increased at an annual rate of 13.1 percent, while nonrevolving credit increased at an annual rate of 3.2 percent.
Next week we get data on Consumer Credit, CPI, and PPI.
Data Sources:
Bureau of Economic Analysis (BEA)
Congressional Budget Office (CBO)
U.S. Bureau of Labor Statistics (BLS)
Federal Reserve Economic Data (FRED Charts)
CME Fed Watch
U.S. Treasury – Yields
U.S. Census Bureau
Institute for Supply Management (ISM)
Weekly DOL Employment Data
BLS Monthly Jobs Report
JOLTS
US Energy Admin (EIA)
BLS Consumer Price Index CPI
BLS Producer Price Index PPI
Atlanta Fed GDPNOW
NY Fed Nowcast GDP
US Census Bureau Housing Starts
Consumer Credit
USCB Retail Sales
Construction Spending
Federal Reserve Dot Plots
NY Empire Index
Philadelphia Federal Reserve
P/E Ratio Data -Yardeni Research
Technical Analysis Info:
StockCharts.com – Financial Charts
Exponential vs Simple moving average
Koyfin.com
Other Links:
1973 Arab Oil Embargo
Hunt Brothers Silver
Long-Term Capital bailout
Asian Contagion
Categories:
Tags: