Good Life Advisors – Talking Points – Week 26
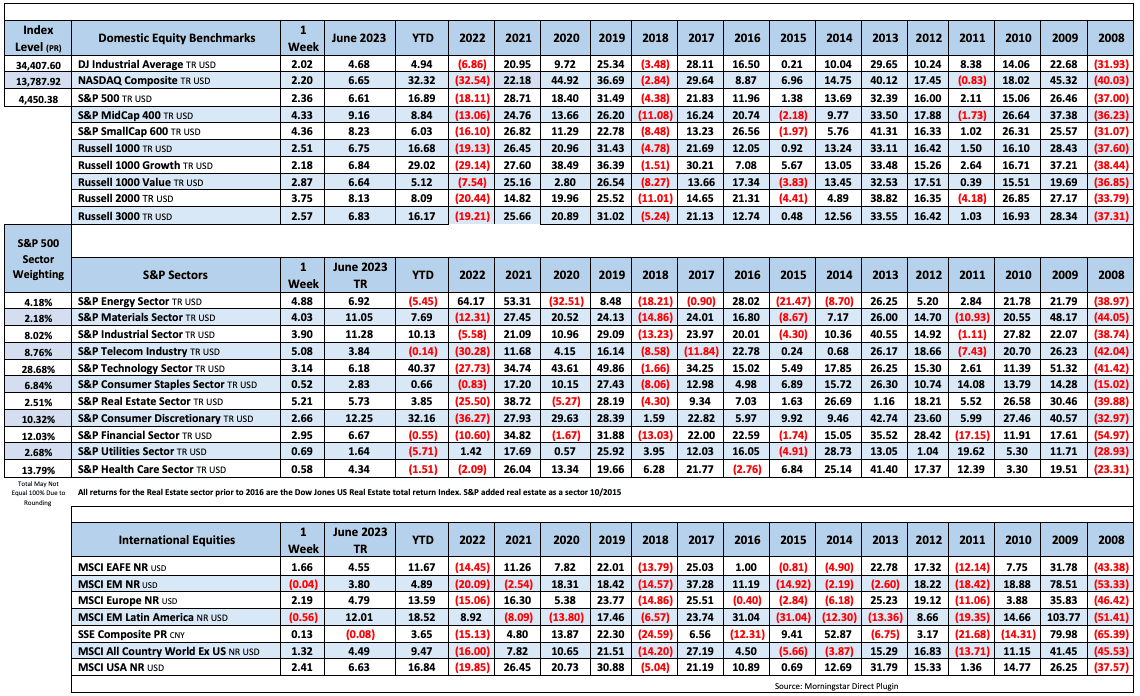
US equities were stronger this week, returning to gains after major indices slipped in the prior week’s trading. Big tech was mostly, with other areas including airlines, energy, chemicals, media, machinery, and banks contributing to market leadership. Among the relative laggards were drug stores, biotech, pharma, food, beverages, and utilities. Treasuries were weaker with the curve flattening; the 2Y yield hit its highest levels since before the March banking crisis amid this week’s solid economic data. The dollar posted slight weekly gains on the euro and yen crosses. Gold was only marginally changed on the week. Oil was higher, with WTI settling up 2.1%
The week’s performance was underpinned by continued economic optimism, with some strong economic data being welcomed more than higher-for-longer Fed policy was feared. The big release was Friday’s May PCE data, which showed a below-consensus core reading and an annual headline rise of just 3.8%, the lowest since April 2021. May new-home sales were much stronger than consensus, rising at the fastest pace since February 2022 (May pending-home sales, however, were weak). Among the other bright spots, May durable-goods orders posted an unexpected increase, consumer confidence continued to improve, and initial jobless claims logged their largest weekly decrease in 20 months.
The big central-bank headline was the appearance of Fed Chair Powell at the annual ECB conference in Portugal. He reiterated that most committee members still see more tightening to come, and also defended the choice for the Fed to slow its hiking pace to evaluate the stress from tightening that may be coming through the pipeline. But in a line sharply noticed by the market, Powell said that he wouldn’t take the idea of hikes at consecutive meetings off the table. There was little other Fedspeak this week, but in a bit of a contrast Atlanta Fed President Bostic said he doesn’t see as much urgency to move as others on the committee, including Chair Powell. The Fed this week also released the results of its annual stress tests, and all participating banks passed, as expected. The market now waits for the release of capital-return plans but there is also uncertainty about the new capital requirements expected to be released this summer.
Geopolitics were also in the mix. Last weekend there was enormous buzz around the apparent insurrection by Wagner Group mercenaries in Russia, with the group turning away from Ukraine to march on Moscow. However, after some skirmishes Wagner head Prigozhin abruptly decided to accept exile to Belarus in exchange for escaping criminal penalties, defusing the situation though leaving commentators to wonder about the domestic strength of Putin’s regime. Elsewhere, the US-China relationship again came into view this week on reporting the Biden administration’s Commerce Department could impose additional restrictions on exports of AI chips by Nvidia and other manufacturers to China.
The path of least resistance seemed to shift back to the upside this week, with solid economic data playing into soft-/no-landing hopes and even thoughts of a more hawkish Fed remaining tempered by a sense that the rate ceiling is near. There was a lot of discussion of FOMO and the “catch-up trade,” with analysts also judging underlying conditions as firmer than earlier in the year when the AI trade was a big driver (though AI is still seen as a secular growth tailwind). All that said, recession fears have not entirely abated and the Fed is still expected to raise rates again next month. While disinflationary forces seem to be gaining traction, there remain concerns about sticky prices as well as the headwinds from eroding corporate pricing power. The health of the consumer is also a wildcard and there remains some concern about spending pressure from the resumption of student-loan repayments, especially after Friday’s Supreme Court decisions (though there are also thoughts this may be priced in already).
Fixed Income

Yield Curve
May FOMC Statement March Fed Minutes Balance Sheet Reduction Plan Credit, Liquidity and Balance Sheet Federal Reserve Dot Plots
Treasury.gov yields FOMC Policy Normalization Statement Longer- Run Goals Jan 2022
Foreign Exchange Market
Energy Complex
The Baker Hughes rig count was down by 8 this week. There are 674 oil and gas rigs operating in the US – down 76 over last year.
Metals Complex
Employment Picture
Weekly Unemployment Claims – Released Thursday 6/29/2023 – In the week ending June 24, the advance figure for seasonally adjusted initial claims was 239,000, declining 26,000 from the previous week’s revised level. The 4-week moving average was 257,500 an increase of 1,500 from the previous week’s revised average.
May Jobs Report – BLS Summary – Released 6/2/2023 – The US Economy added 339k nonfarm jobs in May and the Unemployment rate increase 0.3% to 3.7%. Average hourly earnings increased 11 cents to $33.44. Hiring highlights include +48k Leisure and Hospitality, +97k Education and Health Services, +56 Government, and +64k Professional and Business Services.
- Average hourly earnings increased 11 cents/0.3% to $33.44.
- U3 unemployment rate increased 0.3% to 3.7%. U6 unemployment rate increased 0.1% to 6.7%.
- The labor force participation rate was unchanged at 62.6%.
- Average work week declined 0.1 hours to 34.3 hours.
Job Openings & Labor Turnover Survey JOLTS – Released 5/31/2023 – The number of job openings increased to 10.1 million on the last business day of April, the U.S. Bureau of Labor Statistics reported. Over the month the number of hires and total separations changed little at 6.1 million and 5.7 million, respectively. Within separations, quits (3.8 million) changed little and layoffs and discharges (1.6 million) changed little.
Employment Cost Index – Released 4/28/2023 – Compensation costs for civilian workers increased 1.2% for the 3-month period ending in March 2023. The 12-month period ending in March 2023 saw compensation costs increase by 4.8. The 12-month period ending March 2022 increased 4.5%. Wages and salaries increased 5.0 percent over the 12-month March 2023 and increased 4.7 percent for the 12-month period ending in March 2022. Benefit costs increased 4.5 percent over the 12-month period ending March 2023 and increased 4.1 percent for the 12-month period ending in March 2022. This report is published quarterly.
This Week’s Economic Data
Links take you to the data source
Chicago PMI – Released 6/30/2023 – Chicago PMI remained in contraction territory in June increasing to 41.5 points up from 40.4 points in May. This marks ten months in contractionary territory.
Personal Income – Released 6/30/2023 – Personal income increased $91.2 billion (0.4 percent at a monthly rate) in May. Disposable personal income (DPI) increased $86.7 billion (0.4 percent). Personal consumption expenditures (PCE) increased $18.9 billion (0.1 percent).
3rd Estimate of 1st Quarter 2023 GDP – Released 6/29/2023 – Real gross domestic product (GDP) increased at an annual rate of 2.0 percent in the first quarter of 2023, according to the “third” estimate released by the Bureau of Economic Analysis. In the fourth quarter, real GDP increased 2.6 percent. The “third” GDP estimate is based on more complete source data than were available for the “second” estimate issued last month. In the second estimate, the increase in real GDP was 1.3 percent. The updated estimates primarily reflected upward revisions to exports and consumer spending that were partly offset by downward revisions to nonresidential fixed investment and federal government spending. Imports, which are a subtraction in the calculation of GDP, were revised down. The increase in real GDP in the first quarter reflected increases in consumer spending, exports, state and local government spending, federal government spending, and nonresidential fixed investment that were partly offset by decreases in private inventory investment and residential fixed investment. Imports increased.
Durable Goods – Released 6/27/2023 – New orders for manufactured durable goods in May, up three consecutive months, increased $4.9 billion or 1.7 percent to $288.2 billion, the U.S. Census Bureau announced today. This followed a 1.2 percent April increase. Excluding transportation, new orders increased 0.6 percent. Excluding defense, new orders increased 3.0 percent. Transportation equipment, also up three consecutive months, drove the increase, $3.9 billion or 3.9 percent to $102.6 billion.
Consumer Confidence – Released 6/27/2023 – Consumer Confidence increased in June to 109.7, up from 102.5 in May. Consumer confidence improved in June to its highest level since January 2022, reflecting improved current conditions and an improvement in expectations.
New Residential Sales – Released 6/26/2023 – Sales of new single‐family houses in May 2023 were at a seasonally adjusted annual rate of 763,000, according to estimates released jointly by the U.S. Census Bureau and the Department of Housing and Urban Development. This is 12.2 percent above the revised April rate of 680,000 and is 20.0 percent above the May 2022 estimate of 636,000. The median sales price of new houses sold in May 2023 was $416,300. The average sales price was $487,300. At the end of May, the seasonally adjusted estimate of new homes for sale was 428,000, a supply of 6.7 months at the current sales rate.
Recent Economic Data
Links take you to the data source
Existing Home Sales – Released 6/22/2023 – May 2023 brought 4.30 million in sales, an increase of 0.2% from April. The median sales price was $396,100. The current unsold housing inventory was 3.0 months of inventory.
Housing Starts – Released 6/20/2023 – May housing starts came in at 1,613,000, 21.7% above the April estimate and 5.7% above the May 2022 rate. Building permits were 5.2% above the April rate at $1,491,000 but 12.7% below the May 2022 rate.
Industrial Production and Capacity Utilization – Released 6/15/2023 – Industrial production decreased 0.2% in May. Utilities output fell 1.8%. Manufacturing increased 0.1%. Mining fell 0.4%. Capacity utilization declined to 79.6% in May, 0.1% below the long-run average.
Retail Sales – Released 6/15/2023 – Headline retail sales increased 0.3% in May and are up 1.6% above May 2022.
Producer Price Index – Released 6/14/2023 – The Producer Price Index for final demand declined 0.3 percent in May, seasonally adjusted. Final demand prices rose 0.2 percent in April and fell 0.4 in March. On an unadjusted basis, the index for final demand moved up 1.1 percent for the 12 months ended in May.
Consumer Price Index – Released 6/13/2023 – The Consumer Price Index for All Urban Consumers rose 0.1 percent in May on a seasonally adjusted basis, after increasing 0.4 percent in April. Over the last 12 months, the all items index increased 4.0 percent before seasonal adjustment.
Consumer Credit – Released 6/7/2023 – Consumer credit increased at a seasonally adjusted annual rate of 5.7 percent in April. Revolving credit increased at an annual rate of 13.1 percent, while nonrevolving credit increased at an annual rate of 3.2 percent.
U.S. Trade Balance – Released 6/7/2023 – The U.S. Census Bureau and the U.S. Bureau of Economic Analysis announced that the goods and services deficit was $74.6 billion in April, up $14.0 billion from $60.6 billion in March. April exports were $249.0 billion, $9.2 billion less than March exports. April imports were $323.6 billion, $4.8 billion more than March imports. The April increase in the goods and services deficit reflected a increase in the goods deficit of $14.5 billion to $96.1 billion and an increase in the services surplus of $0.6 billion to $21.6 billion.
PMI Non-Manufacturing Index – Released 6/5/2023 – Economic activity in the services sector expanded in May for the fifth consecutive month as the Services PMI® registered 50.3 percent, 1.6 percentage point lower than April’s reading of 51.9 percent. The composite index indicated growth in May for the fifth consecutive month after a reading of 49.2 percent in December, the first contraction since May 2020.
US Light Vehicle Sales – Released 6/2/2023 – U.S. light vehicle sales were at a seasonally adjusted annual rate (SAAR) of 15.045 million units in May.
U.S. Construction Spending – Released 6/1/2023 – Construction spending during April 2023 was estimated at a seasonally adjusted annual rate of $1,908.4 billion, 1.2 percent above the revised March estimate of $1,885.0 billion. The April figure is 7.2 percent above the April 2022 estimate of $1,780.9 billion.
PMI Manufacturing Index – Released 6/1/2023 – The May Manufacturing PMI registered 46.9 percent, 0.2 percentage points lower than the 47.1 percent recorded in April. Regarding the overall economy, this figure indicates a sixth month of contraction after a 30-month period of expansion. The New Orders Index remained in contraction territory at 42.6 percent, 3.1 percentage points lower than the figure of 45.7 percent recorded in April. The Production Index reading of 51.1 percent is a 2.2-percentage point increase compared to April’s figure of 48.9 percent.
Next week we get data on PMI Manufacturing, U.S. Construction Spending, PMI Services, the U.S. Trade Balance, JOLTS, and the June Jobs Report.
Data Sources:
Bureau of Economic Analysis (BEA)
Congressional Budget Office (CBO)
U.S. Bureau of Labor Statistics (BLS)
Federal Reserve Economic Data (FRED Charts)
CME Fed Watch
U.S. Treasury – Yields
U.S. Census Bureau
Institute for Supply Management (ISM)
Weekly DOL Employment Data
BLS Monthly Jobs Report
JOLTS
US Energy Admin (EIA)
BLS Consumer Price Index CPI
BLS Producer Price Index PPI
Atlanta Fed GDPNOW
NY Fed Nowcast GDP
US Census Bureau Housing Starts
Consumer Credit
USCB Retail Sales
Construction Spending
Federal Reserve Dot Plots
NY Empire Index
Philadelphia Federal Reserve
P/E Ratio Data -Yardeni Research
Technical Analysis Info:
StockCharts.com – Financial Charts
Exponential vs Simple moving average
Koyfin.com
Other Links:
1973 Arab Oil Embargo
Hunt Brothers Silver
Long-Term Capital bailout
Asian Contagion


Table of Contents
Good Life Advisors – Talking Points – Week 26
US equities were stronger this week, returning to gains after major indices slipped in the prior week’s trading. Big tech was mostly, with other areas including airlines, energy, chemicals, media, machinery, and banks contributing to market leadership. Among the relative laggards were drug stores, biotech, pharma, food, beverages, and utilities. Treasuries were weaker with the curve flattening; the 2Y yield hit its highest levels since before the March banking crisis amid this week’s solid economic data. The dollar posted slight weekly gains on the euro and yen crosses. Gold was only marginally changed on the week. Oil was higher, with WTI settling up 2.1%
The week’s performance was underpinned by continued economic optimism, with some strong economic data being welcomed more than higher-for-longer Fed policy was feared. The big release was Friday’s May PCE data, which showed a below-consensus core reading and an annual headline rise of just 3.8%, the lowest since April 2021. May new-home sales were much stronger than consensus, rising at the fastest pace since February 2022 (May pending-home sales, however, were weak). Among the other bright spots, May durable-goods orders posted an unexpected increase, consumer confidence continued to improve, and initial jobless claims logged their largest weekly decrease in 20 months.
The big central-bank headline was the appearance of Fed Chair Powell at the annual ECB conference in Portugal. He reiterated that most committee members still see more tightening to come, and also defended the choice for the Fed to slow its hiking pace to evaluate the stress from tightening that may be coming through the pipeline. But in a line sharply noticed by the market, Powell said that he wouldn’t take the idea of hikes at consecutive meetings off the table. There was little other Fedspeak this week, but in a bit of a contrast Atlanta Fed President Bostic said he doesn’t see as much urgency to move as others on the committee, including Chair Powell. The Fed this week also released the results of its annual stress tests, and all participating banks passed, as expected. The market now waits for the release of capital-return plans but there is also uncertainty about the new capital requirements expected to be released this summer.
Geopolitics were also in the mix. Last weekend there was enormous buzz around the apparent insurrection by Wagner Group mercenaries in Russia, with the group turning away from Ukraine to march on Moscow. However, after some skirmishes Wagner head Prigozhin abruptly decided to accept exile to Belarus in exchange for escaping criminal penalties, defusing the situation though leaving commentators to wonder about the domestic strength of Putin’s regime. Elsewhere, the US-China relationship again came into view this week on reporting the Biden administration’s Commerce Department could impose additional restrictions on exports of AI chips by Nvidia and other manufacturers to China.
The path of least resistance seemed to shift back to the upside this week, with solid economic data playing into soft-/no-landing hopes and even thoughts of a more hawkish Fed remaining tempered by a sense that the rate ceiling is near. There was a lot of discussion of FOMO and the “catch-up trade,” with analysts also judging underlying conditions as firmer than earlier in the year when the AI trade was a big driver (though AI is still seen as a secular growth tailwind). All that said, recession fears have not entirely abated and the Fed is still expected to raise rates again next month. While disinflationary forces seem to be gaining traction, there remain concerns about sticky prices as well as the headwinds from eroding corporate pricing power. The health of the consumer is also a wildcard and there remains some concern about spending pressure from the resumption of student-loan repayments, especially after Friday’s Supreme Court decisions (though there are also thoughts this may be priced in already).
Fixed Income
Yield Curve
May FOMC Statement March Fed Minutes Balance Sheet Reduction Plan Credit, Liquidity and Balance Sheet Federal Reserve Dot Plots
Treasury.gov yields FOMC Policy Normalization Statement Longer- Run Goals Jan 2022
Foreign Exchange Market
Energy Complex
The Baker Hughes rig count was down by 8 this week. There are 674 oil and gas rigs operating in the US – down 76 over last year.
Metals Complex
Employment Picture
Weekly Unemployment Claims – Released Thursday 6/29/2023 – In the week ending June 24, the advance figure for seasonally adjusted initial claims was 239,000, declining 26,000 from the previous week’s revised level. The 4-week moving average was 257,500 an increase of 1,500 from the previous week’s revised average.
May Jobs Report – BLS Summary – Released 6/2/2023 – The US Economy added 339k nonfarm jobs in May and the Unemployment rate increase 0.3% to 3.7%. Average hourly earnings increased 11 cents to $33.44. Hiring highlights include +48k Leisure and Hospitality, +97k Education and Health Services, +56 Government, and +64k Professional and Business Services.
Job Openings & Labor Turnover Survey JOLTS – Released 5/31/2023 – The number of job openings increased to 10.1 million on the last business day of April, the U.S. Bureau of Labor Statistics reported. Over the month the number of hires and total separations changed little at 6.1 million and 5.7 million, respectively. Within separations, quits (3.8 million) changed little and layoffs and discharges (1.6 million) changed little.
Employment Cost Index – Released 4/28/2023 – Compensation costs for civilian workers increased 1.2% for the 3-month period ending in March 2023. The 12-month period ending in March 2023 saw compensation costs increase by 4.8. The 12-month period ending March 2022 increased 4.5%. Wages and salaries increased 5.0 percent over the 12-month March 2023 and increased 4.7 percent for the 12-month period ending in March 2022. Benefit costs increased 4.5 percent over the 12-month period ending March 2023 and increased 4.1 percent for the 12-month period ending in March 2022. This report is published quarterly.
This Week’s Economic Data
Links take you to the data source
Chicago PMI – Released 6/30/2023 – Chicago PMI remained in contraction territory in June increasing to 41.5 points up from 40.4 points in May. This marks ten months in contractionary territory.
Personal Income – Released 6/30/2023 – Personal income increased $91.2 billion (0.4 percent at a monthly rate) in May. Disposable personal income (DPI) increased $86.7 billion (0.4 percent). Personal consumption expenditures (PCE) increased $18.9 billion (0.1 percent).
3rd Estimate of 1st Quarter 2023 GDP – Released 6/29/2023 – Real gross domestic product (GDP) increased at an annual rate of 2.0 percent in the first quarter of 2023, according to the “third” estimate released by the Bureau of Economic Analysis. In the fourth quarter, real GDP increased 2.6 percent. The “third” GDP estimate is based on more complete source data than were available for the “second” estimate issued last month. In the second estimate, the increase in real GDP was 1.3 percent. The updated estimates primarily reflected upward revisions to exports and consumer spending that were partly offset by downward revisions to nonresidential fixed investment and federal government spending. Imports, which are a subtraction in the calculation of GDP, were revised down. The increase in real GDP in the first quarter reflected increases in consumer spending, exports, state and local government spending, federal government spending, and nonresidential fixed investment that were partly offset by decreases in private inventory investment and residential fixed investment. Imports increased.
Durable Goods – Released 6/27/2023 – New orders for manufactured durable goods in May, up three consecutive months, increased $4.9 billion or 1.7 percent to $288.2 billion, the U.S. Census Bureau announced today. This followed a 1.2 percent April increase. Excluding transportation, new orders increased 0.6 percent. Excluding defense, new orders increased 3.0 percent. Transportation equipment, also up three consecutive months, drove the increase, $3.9 billion or 3.9 percent to $102.6 billion.
Consumer Confidence – Released 6/27/2023 – Consumer Confidence increased in June to 109.7, up from 102.5 in May. Consumer confidence improved in June to its highest level since January 2022, reflecting improved current conditions and an improvement in expectations.
New Residential Sales – Released 6/26/2023 – Sales of new single‐family houses in May 2023 were at a seasonally adjusted annual rate of 763,000, according to estimates released jointly by the U.S. Census Bureau and the Department of Housing and Urban Development. This is 12.2 percent above the revised April rate of 680,000 and is 20.0 percent above the May 2022 estimate of 636,000. The median sales price of new houses sold in May 2023 was $416,300. The average sales price was $487,300. At the end of May, the seasonally adjusted estimate of new homes for sale was 428,000, a supply of 6.7 months at the current sales rate.
Recent Economic Data
Links take you to the data source
Existing Home Sales – Released 6/22/2023 – May 2023 brought 4.30 million in sales, an increase of 0.2% from April. The median sales price was $396,100. The current unsold housing inventory was 3.0 months of inventory.
Housing Starts – Released 6/20/2023 – May housing starts came in at 1,613,000, 21.7% above the April estimate and 5.7% above the May 2022 rate. Building permits were 5.2% above the April rate at $1,491,000 but 12.7% below the May 2022 rate.
Industrial Production and Capacity Utilization – Released 6/15/2023 – Industrial production decreased 0.2% in May. Utilities output fell 1.8%. Manufacturing increased 0.1%. Mining fell 0.4%. Capacity utilization declined to 79.6% in May, 0.1% below the long-run average.
Retail Sales – Released 6/15/2023 – Headline retail sales increased 0.3% in May and are up 1.6% above May 2022.
Producer Price Index – Released 6/14/2023 – The Producer Price Index for final demand declined 0.3 percent in May, seasonally adjusted. Final demand prices rose 0.2 percent in April and fell 0.4 in March. On an unadjusted basis, the index for final demand moved up 1.1 percent for the 12 months ended in May.
Consumer Price Index – Released 6/13/2023 – The Consumer Price Index for All Urban Consumers rose 0.1 percent in May on a seasonally adjusted basis, after increasing 0.4 percent in April. Over the last 12 months, the all items index increased 4.0 percent before seasonal adjustment.
Consumer Credit – Released 6/7/2023 – Consumer credit increased at a seasonally adjusted annual rate of 5.7 percent in April. Revolving credit increased at an annual rate of 13.1 percent, while nonrevolving credit increased at an annual rate of 3.2 percent.
U.S. Trade Balance – Released 6/7/2023 – The U.S. Census Bureau and the U.S. Bureau of Economic Analysis announced that the goods and services deficit was $74.6 billion in April, up $14.0 billion from $60.6 billion in March. April exports were $249.0 billion, $9.2 billion less than March exports. April imports were $323.6 billion, $4.8 billion more than March imports. The April increase in the goods and services deficit reflected a increase in the goods deficit of $14.5 billion to $96.1 billion and an increase in the services surplus of $0.6 billion to $21.6 billion.
PMI Non-Manufacturing Index – Released 6/5/2023 – Economic activity in the services sector expanded in May for the fifth consecutive month as the Services PMI® registered 50.3 percent, 1.6 percentage point lower than April’s reading of 51.9 percent. The composite index indicated growth in May for the fifth consecutive month after a reading of 49.2 percent in December, the first contraction since May 2020.
US Light Vehicle Sales – Released 6/2/2023 – U.S. light vehicle sales were at a seasonally adjusted annual rate (SAAR) of 15.045 million units in May.
U.S. Construction Spending – Released 6/1/2023 – Construction spending during April 2023 was estimated at a seasonally adjusted annual rate of $1,908.4 billion, 1.2 percent above the revised March estimate of $1,885.0 billion. The April figure is 7.2 percent above the April 2022 estimate of $1,780.9 billion.
PMI Manufacturing Index – Released 6/1/2023 – The May Manufacturing PMI registered 46.9 percent, 0.2 percentage points lower than the 47.1 percent recorded in April. Regarding the overall economy, this figure indicates a sixth month of contraction after a 30-month period of expansion. The New Orders Index remained in contraction territory at 42.6 percent, 3.1 percentage points lower than the figure of 45.7 percent recorded in April. The Production Index reading of 51.1 percent is a 2.2-percentage point increase compared to April’s figure of 48.9 percent.
Next week we get data on PMI Manufacturing, U.S. Construction Spending, PMI Services, the U.S. Trade Balance, JOLTS, and the June Jobs Report.
Data Sources:
Bureau of Economic Analysis (BEA)
Congressional Budget Office (CBO)
U.S. Bureau of Labor Statistics (BLS)
Federal Reserve Economic Data (FRED Charts)
CME Fed Watch
U.S. Treasury – Yields
U.S. Census Bureau
Institute for Supply Management (ISM)
Weekly DOL Employment Data
BLS Monthly Jobs Report
JOLTS
US Energy Admin (EIA)
BLS Consumer Price Index CPI
BLS Producer Price Index PPI
Atlanta Fed GDPNOW
NY Fed Nowcast GDP
US Census Bureau Housing Starts
Consumer Credit
USCB Retail Sales
Construction Spending
Federal Reserve Dot Plots
NY Empire Index
Philadelphia Federal Reserve
P/E Ratio Data -Yardeni Research
Technical Analysis Info:
StockCharts.com – Financial Charts
Exponential vs Simple moving average
Koyfin.com
Other Links:
1973 Arab Oil Embargo
Hunt Brothers Silver
Long-Term Capital bailout
Asian Contagion
Categories:
Tags: