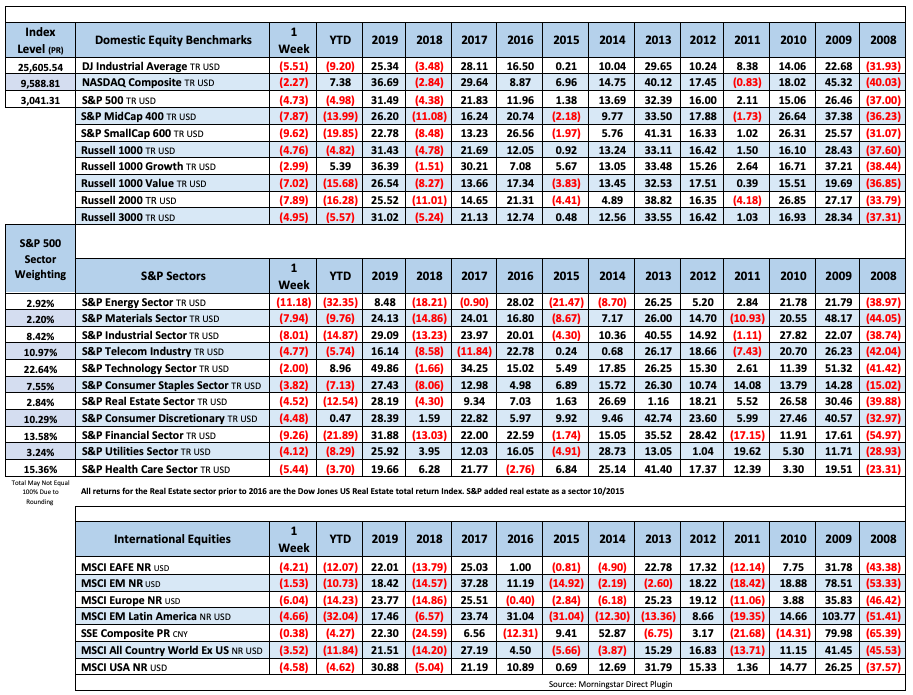
Equities started the week hitting key milestones — the S&P 500 turned positive for the year, and the Nasdaq Composite rose above 10,000 for the first time — but all this succumbed to profit taking that handed it its worst week since March. The S&P 500 fell 4.8%, the Nasdaq fell 2.3%, the Dow Jones Industrial Average fell 5.6%, the Russell 2000 fell 7.9%.
A bulk of this week’s losses came on Thursday when the S&P 500 declined 5.9%. There was no specific news catalyst that contributed to the decline, but some blamed the Fed for its cautious June FOMC statement while others pointed to data showing increasing rates of coronavirus in many U.S. states. 6/10/2020 Statement
The Fed didn’t suddenly change its tune, though, and the market had chosen to ignore the coronavirus threat in recent weeks. The market may have just gone up too much, too fast. At Monday’s high, the S&P 500 had gained as much as 48% from its March 23 low despite the uncertainty facing the economy.
All 11 S&P 500 sectors finished the week with losses ranging from 2.0% (tech) to 11.1% (energy). The value, cyclical, and bankrupt stocks that exhibited strength early in the week were hit the hardest, while the mega-caps performed relatively well amid a slew of price target increases from brokerage firms.
At this week’s policy meeting, the Fed kept the target range for the fed funds rate unchanged at 0.00-0.25%, and its dot plot signaled rates will remain near zero through at least 2022. The Fed’s economic projections called for a 6.5% contraction in 2020 GDP, followed by 5.0% growth in 2021. Core PCE inflation is expected to remain below the Fed’s 2.0% target through 2020.
U.S. Treasuries ended the week with curve-flattening gains. The 2-yr yield declined three basis points to 0.18%, and the 10-yr yield declined 20 basis points to 0.70%. The U.S. Dollar Index increased 0.2% to 97.11. WTI crude fell 8.3% to $36.24/bbl. The Volatility Index spiked 47% to 36.09, which reflected increased hedging interest against further equity weakness.

Fixed Income
6/10/2020 Statement
FOMC December Statement Federal Reserve Dot Plots US Debt Measurement US Corporate Debt Tops $6 Trillion Treasury.gov yields
FOMC Policy Normalization Statement
Global Bond Yields
Daily US Treasury Yields
Foreign Exchange Market
Energy Complex
The Baker Hughes rig count was down 5 this week. There are 279 oil and gas rigs operating in the US – down 69 over last year.
- Brent Crude Oil lost 8.44% this week closing at $37.01/bbl
- WTI Crude Oil lost 8.32% this week to close at $36.26/bbl
- Heating Oil lost 4.28% this week closing at $1.10/gallon
- Natural Gas declined 2.86% this week closing at $1.73 per million BTUs
- Unleaded Gas lost 7.36% this week closing at $1.12/gallon
Metals Complex
- Gold gained 3.23% this week closing at $1737.30/oz
- Silver gained 0.02% on the week closing at $17.48/oz
- Palladium declined 0.72% this week closing at $1938.50/oz
- Platinum declined 1.37% this week closing at $819.00/oz
- Copper gained 1.74% this week closing at $2.60/lb
Employment Picture
Weekly Unemployment Claims – Released Thursday 6/11/2020 – Initial jobless claims for the week ending June 6 decreased by 355,000 to a still-high 1.542 million while continuing claims for the week ending May 30 decreased by 339,000 to a still stunningly high 20.929 million. Not withstanding the hiring activity in May, this report shows the labor market remains a long, long way from being back. Over the past 12 weeks, there has been a total of 44.2 million applications for jobless claims filed.
Job Openings & Labor Turnover Survey JOLTS – Released 6/9/2020 – The U.S. Bureau of Labor Statistics reported the number and rate of job openings declined to 5.0 million and 3.7% respectively, on the last business day of April. Over the month, hires declined to 3.5 million and separations decreased by 4.8 million to 9.9 million. Within separations, the quits rate declined to 1.4%. The layoffs and discharges rates decreased to 5.9%.
May Jobs Report – BLS Summary – Released 6/5/2020 – The US Economy gained 2.5 million nonfarm jobs in May and the Unemployment rate declined to 13.3%. Average hourly earnings fell by 29 cents. Hiring highlights include Leisure and Hospitality +1.24 million, Construction +464k, Education and Health Services +424k, Retail Trade +368k, and Manufacturing +225k.
- Average hourly earnings declined by 29 cents in May to $29.75.
- U3 unemployment rate declined to 13.3%. U6 unemployment rate declined to 21.2%.
- The labor force participation rate increased by 0.6% to 60.8%.
- Average work week increased by 0.5 hours to 34.7 hours.
Employment Cost Index – Released 4/30/2020 – Compensation costs for civilian workers increased 0.8% for the 3-month period ending in March 2020. The 12 month period ending on March 2020 saw compensation costs increase by 2.8%, same as the 12 month period ending March 2019. Wages and salaries increased 3.1 percent over the year and increased 2.9 percent for the 12-month period ending in March 2019. Benefit costs increased 2.1 percent for the 12-month period ending in March 2020. In March 2019, the increase was 2.6 percent. This report is published quarterly.
This Week’s Economic Data
Links take you to the data source
Producer Price Index – Released 6/11/2020 – The Producer Price Index for final demand increased 0.4% in May. Core PPI was flat. Year over year the index for final demand declined 0.8%.
Consumer Price Index – Released 6/10/2020 – The Consumer Price Index declined 0.1% in May. Core CPI, which excludes food and energy also declined by 0.1%. The monthly changes left total CPI up 0.1% year-over-year and core CPI up 1.2%.
Recent Economic Data
Links take you to the data source
Consumer Credit – Released 6/5/2020 – Consumer credit increased at a seasonally adjusted annual rate of 19.5% in April. Revolving and nonrevolving credit decreased at annual rates of 65.0% and increased 4.0% respectively. Total Outstanding consumer credit is currently at $4.1333 trillion.
U.S. Trade Balance – Released 6/4/2020 – According to the U.S. Census Bureau of Economic Analysis the goods and services deficit increased in April by $7.1 billion to $42.3 billion. April exports were $151.3 billion, $38.9 billion less than March exports. April imports were $200.7 billion, $31.8 billion less than March imports. The goods and services deficit decreased $26.0 billion or 13.4% year-to-date, from the same period in 2019. Year – over – year exports and imports decreased $79.8 billion or 9.5% and decreased $105.8 billion or 10.2% respectively.
PMI Non-Manufacturing Index (ISM Services) – Released 6/3/2020 – Economic activity in the non-manufacturing sector contracted in May for the second consecutive month. ISM Non-Manufacturing registered 45.4 percent, which is 3.6 percentage points above the adjusted April reading of 41.8 percent.
PMI Manufacturing ISM Index – Released 6/1/2020 – May PMI increased 1.6% to 43.1% from April’s reading of 41.5%. The New Orders Index was up 4.7% from April’s reading of 27.1% to 31.8%. The Production Index registered 33.2%, up 5.7%.
U.S. Construction Spending – Released 6/1/2020 – Construction spending declined 2.9% in April measuring at a seasonally adjusted annual rate of $1,346.2 billion. The April figure is 3.0% above the April 2019 estimate. Private construction spending was 3.0% below the revised March estimate at $1,004.1 billion. Public construction spending was 2.5% below the revised March estimate at $342.1 billion.
Chicago PMI – Released 5/29/2020 – Chicago PMI declined 3.1 points decreasing to 32.3. This marks ten consecutive months in contraction and the lowest level since March 1982.
Personal Income – Released 5/29/2020 – Personal income increased $1.97 trillion or 10.5 percent in April according to estimates released today by the Bureau of Economic Analysis. Disposable personal income (DPI) increased $2.13 trillion or 12.9 percent and personal consumption expenditures (PCE) decreased $1.89 trillion or 13.6 percent.
Second Estimate of 1st Quarter 2020 GDP – Released 5/28/2020 – Real gross domestic product (GDP) decreased at an annual rate of 5.0 percent in the first quarter of 2020, according to the second estimate released by the Bureau of Economic Analysis. In the fourth quarter of 2019, real GDP increased 2.1 percent. This second GDP estimate is based on more complete source data than were available for the “advance” estimate issued last month. In the advance estimate, the decrease in real GDP was 4.8 percent. With the second estimate, a downward revision to private inventory investment was partly offset by upward revisions to personal consumption expenditures (PCE) and nonresidential fixed investment. The decrease in real GDP in the first quarter reflected negative contributions from personal consumption expenditures (PCE), nonresidential fixed investment, exports, and private inventory investment that were partly offset by positive contributions from residential fixed investment, federal government spending, and state and local government spending.
Durable Goods – Released 5/28/2020 – New orders for manufactured durable goods decreased $35.4billion or 17.2% in April. Down three of the last four months.
Consumer Confidence – Released 5/26/2020 – The Consumer confidence index increased slightly by 0.9% in May following a sharp decline in April. The Index now shows a reading of 86.6, up from 85.7 in April.
New Residential Sales – Released 5/26/2020 – Sales of new single-family homes increased 0.6% to 623k, seasonally adjusted, in April. The median sales price of new homes sold in April was $309,900 with an average sales price of $364,500. At the end of April the seasonally adjusted estimate of new homes for sale was 325k. This represents a supply of 6.3 months at the current sales rate.
Existing Home Sales – Released 5/21/2020 – Existing home sales declined in April. Sales declined 17.8% to a seasonally adjusted rate of 4.33 million. Sales are currently down 17.2% from one year ago. Housing inventory sits at 1.47 million units. Down 1.3% over last month. Down 19.7% over last year. Unsold inventory sits at a 4.1 month supply.
Housing Starts – Released 5/19/2020 – New home starts in April were at a seasonally adjusted annual rate of 891k; down 30.2% below March and 29.7% below last April’s rate. Building Permits were at a seasonally adjusted annual rate of 1.074 million, down 20.8% compared to March and down 19.2% over last year.
Industrial Production and Capacity Utilization – Released 5/15/2020 – In April Industrial production declined 11.2%. Manufacturing declined 13.7%, its largest decline on record. The output of motor vehicles and parts is down more than 70 percent. Industrial production was 92.6% of its 2012 average which is 15.0% lower than a year ago. Total capacity utilization declined 8.3% to 64.9% in April which is 14.9% below its long run average.
Retail Sales – Released 5/15/2020 – U.S. retail sales for April declined 16.4% to $403.9 billion. U.S. retail sales are down 21.6% year/y.
US Light Vehicle Sales – Released 2/28/2020 – U.S. light vehicle sales were at a seasonally adjusted annual rate (SAAR) of 16.81 million units in January.
Next week we get data on Retail Sales, Industrial Production and Capacity Utilization, and Housing Starts.
Data Sources:
Bureau of Economic Analysis (BEA)
Congressional Budget Office (CBO)
U.S. Bureau of Labor Statistics (BLS)
Federal Reserve Economic Data (FRED Charts)
CME Fed Watch
U.S. Treasury – Yields
U.S. Census Bureau
Institute for Supply Management (ISM)
Weekly DOL Employment Data
BLS Monthly Jobs Report
JOLTS
US Energy Admin (EIA)
BLS Consumer Price Index CPI
BLS Producer Price Index PPI
Atlanta Fed GDPNOW
NY Fed Nowcast GDP
US Census Bureau Housing Starts
Consumer Credit
USCB Retail Sales
Construction Spending
Federal Reserve Dot Plots
NY Empire Index
Philadelphia Federal Reserve
P/E Ratio Data -Yardeni Research
Technical Analysis Info:
StockCharts.com – Financial Charts
Exponential vs Simple moving average
Other Links:
1973 Arab Oil Embargo
Hunt Brothers Silver
Long-Term Capital bailout


Week 24 Talking Points
Equities started the week hitting key milestones — the S&P 500 turned positive for the year, and the Nasdaq Composite rose above 10,000 for the first time — but all this succumbed to profit taking that handed it its worst week since March. The S&P 500 fell 4.8%, the Nasdaq fell 2.3%, the Dow Jones Industrial Average fell 5.6%, the Russell 2000 fell 7.9%.
A bulk of this week’s losses came on Thursday when the S&P 500 declined 5.9%. There was no specific news catalyst that contributed to the decline, but some blamed the Fed for its cautious June FOMC statement while others pointed to data showing increasing rates of coronavirus in many U.S. states. 6/10/2020 Statement
The Fed didn’t suddenly change its tune, though, and the market had chosen to ignore the coronavirus threat in recent weeks. The market may have just gone up too much, too fast. At Monday’s high, the S&P 500 had gained as much as 48% from its March 23 low despite the uncertainty facing the economy.
All 11 S&P 500 sectors finished the week with losses ranging from 2.0% (tech) to 11.1% (energy). The value, cyclical, and bankrupt stocks that exhibited strength early in the week were hit the hardest, while the mega-caps performed relatively well amid a slew of price target increases from brokerage firms.
At this week’s policy meeting, the Fed kept the target range for the fed funds rate unchanged at 0.00-0.25%, and its dot plot signaled rates will remain near zero through at least 2022. The Fed’s economic projections called for a 6.5% contraction in 2020 GDP, followed by 5.0% growth in 2021. Core PCE inflation is expected to remain below the Fed’s 2.0% target through 2020.
U.S. Treasuries ended the week with curve-flattening gains. The 2-yr yield declined three basis points to 0.18%, and the 10-yr yield declined 20 basis points to 0.70%. The U.S. Dollar Index increased 0.2% to 97.11. WTI crude fell 8.3% to $36.24/bbl. The Volatility Index spiked 47% to 36.09, which reflected increased hedging interest against further equity weakness.
Table of Contents
Fixed Income
6/10/2020 Statement
FOMC December Statement Federal Reserve Dot Plots US Debt Measurement US Corporate Debt Tops $6 Trillion Treasury.gov yields
FOMC Policy Normalization Statement
Global Bond Yields
Daily US Treasury Yields
Foreign Exchange Market
Energy Complex
The Baker Hughes rig count was down 5 this week. There are 279 oil and gas rigs operating in the US – down 69 over last year.
Metals Complex
Employment Picture
Weekly Unemployment Claims – Released Thursday 6/11/2020 – Initial jobless claims for the week ending June 6 decreased by 355,000 to a still-high 1.542 million while continuing claims for the week ending May 30 decreased by 339,000 to a still stunningly high 20.929 million. Not withstanding the hiring activity in May, this report shows the labor market remains a long, long way from being back. Over the past 12 weeks, there has been a total of 44.2 million applications for jobless claims filed.
Job Openings & Labor Turnover Survey JOLTS – Released 6/9/2020 – The U.S. Bureau of Labor Statistics reported the number and rate of job openings declined to 5.0 million and 3.7% respectively, on the last business day of April. Over the month, hires declined to 3.5 million and separations decreased by 4.8 million to 9.9 million. Within separations, the quits rate declined to 1.4%. The layoffs and discharges rates decreased to 5.9%.
May Jobs Report – BLS Summary – Released 6/5/2020 – The US Economy gained 2.5 million nonfarm jobs in May and the Unemployment rate declined to 13.3%. Average hourly earnings fell by 29 cents. Hiring highlights include Leisure and Hospitality +1.24 million, Construction +464k, Education and Health Services +424k, Retail Trade +368k, and Manufacturing +225k.
Employment Cost Index – Released 4/30/2020 – Compensation costs for civilian workers increased 0.8% for the 3-month period ending in March 2020. The 12 month period ending on March 2020 saw compensation costs increase by 2.8%, same as the 12 month period ending March 2019. Wages and salaries increased 3.1 percent over the year and increased 2.9 percent for the 12-month period ending in March 2019. Benefit costs increased 2.1 percent for the 12-month period ending in March 2020. In March 2019, the increase was 2.6 percent. This report is published quarterly.
This Week’s Economic Data
Links take you to the data source
Producer Price Index – Released 6/11/2020 – The Producer Price Index for final demand increased 0.4% in May. Core PPI was flat. Year over year the index for final demand declined 0.8%.
Consumer Price Index – Released 6/10/2020 – The Consumer Price Index declined 0.1% in May. Core CPI, which excludes food and energy also declined by 0.1%. The monthly changes left total CPI up 0.1% year-over-year and core CPI up 1.2%.
Recent Economic Data
Links take you to the data source
Consumer Credit – Released 6/5/2020 – Consumer credit increased at a seasonally adjusted annual rate of 19.5% in April. Revolving and nonrevolving credit decreased at annual rates of 65.0% and increased 4.0% respectively. Total Outstanding consumer credit is currently at $4.1333 trillion.
U.S. Trade Balance – Released 6/4/2020 – According to the U.S. Census Bureau of Economic Analysis the goods and services deficit increased in April by $7.1 billion to $42.3 billion. April exports were $151.3 billion, $38.9 billion less than March exports. April imports were $200.7 billion, $31.8 billion less than March imports. The goods and services deficit decreased $26.0 billion or 13.4% year-to-date, from the same period in 2019. Year – over – year exports and imports decreased $79.8 billion or 9.5% and decreased $105.8 billion or 10.2% respectively.
PMI Non-Manufacturing Index (ISM Services) – Released 6/3/2020 – Economic activity in the non-manufacturing sector contracted in May for the second consecutive month. ISM Non-Manufacturing registered 45.4 percent, which is 3.6 percentage points above the adjusted April reading of 41.8 percent.
PMI Manufacturing ISM Index – Released 6/1/2020 – May PMI increased 1.6% to 43.1% from April’s reading of 41.5%. The New Orders Index was up 4.7% from April’s reading of 27.1% to 31.8%. The Production Index registered 33.2%, up 5.7%.
U.S. Construction Spending – Released 6/1/2020 – Construction spending declined 2.9% in April measuring at a seasonally adjusted annual rate of $1,346.2 billion. The April figure is 3.0% above the April 2019 estimate. Private construction spending was 3.0% below the revised March estimate at $1,004.1 billion. Public construction spending was 2.5% below the revised March estimate at $342.1 billion.
Chicago PMI – Released 5/29/2020 – Chicago PMI declined 3.1 points decreasing to 32.3. This marks ten consecutive months in contraction and the lowest level since March 1982.
Personal Income – Released 5/29/2020 – Personal income increased $1.97 trillion or 10.5 percent in April according to estimates released today by the Bureau of Economic Analysis. Disposable personal income (DPI) increased $2.13 trillion or 12.9 percent and personal consumption expenditures (PCE) decreased $1.89 trillion or 13.6 percent.
Second Estimate of 1st Quarter 2020 GDP – Released 5/28/2020 – Real gross domestic product (GDP) decreased at an annual rate of 5.0 percent in the first quarter of 2020, according to the second estimate released by the Bureau of Economic Analysis. In the fourth quarter of 2019, real GDP increased 2.1 percent. This second GDP estimate is based on more complete source data than were available for the “advance” estimate issued last month. In the advance estimate, the decrease in real GDP was 4.8 percent. With the second estimate, a downward revision to private inventory investment was partly offset by upward revisions to personal consumption expenditures (PCE) and nonresidential fixed investment. The decrease in real GDP in the first quarter reflected negative contributions from personal consumption expenditures (PCE), nonresidential fixed investment, exports, and private inventory investment that were partly offset by positive contributions from residential fixed investment, federal government spending, and state and local government spending.
Durable Goods – Released 5/28/2020 – New orders for manufactured durable goods decreased $35.4billion or 17.2% in April. Down three of the last four months.
Consumer Confidence – Released 5/26/2020 – The Consumer confidence index increased slightly by 0.9% in May following a sharp decline in April. The Index now shows a reading of 86.6, up from 85.7 in April.
New Residential Sales – Released 5/26/2020 – Sales of new single-family homes increased 0.6% to 623k, seasonally adjusted, in April. The median sales price of new homes sold in April was $309,900 with an average sales price of $364,500. At the end of April the seasonally adjusted estimate of new homes for sale was 325k. This represents a supply of 6.3 months at the current sales rate.
Existing Home Sales – Released 5/21/2020 – Existing home sales declined in April. Sales declined 17.8% to a seasonally adjusted rate of 4.33 million. Sales are currently down 17.2% from one year ago. Housing inventory sits at 1.47 million units. Down 1.3% over last month. Down 19.7% over last year. Unsold inventory sits at a 4.1 month supply.
Housing Starts – Released 5/19/2020 – New home starts in April were at a seasonally adjusted annual rate of 891k; down 30.2% below March and 29.7% below last April’s rate. Building Permits were at a seasonally adjusted annual rate of 1.074 million, down 20.8% compared to March and down 19.2% over last year.
Industrial Production and Capacity Utilization – Released 5/15/2020 – In April Industrial production declined 11.2%. Manufacturing declined 13.7%, its largest decline on record. The output of motor vehicles and parts is down more than 70 percent. Industrial production was 92.6% of its 2012 average which is 15.0% lower than a year ago. Total capacity utilization declined 8.3% to 64.9% in April which is 14.9% below its long run average.
Retail Sales – Released 5/15/2020 – U.S. retail sales for April declined 16.4% to $403.9 billion. U.S. retail sales are down 21.6% year/y.
US Light Vehicle Sales – Released 2/28/2020 – U.S. light vehicle sales were at a seasonally adjusted annual rate (SAAR) of 16.81 million units in January.
Next week we get data on Retail Sales, Industrial Production and Capacity Utilization, and Housing Starts.
Data Sources:
Bureau of Economic Analysis (BEA)
Congressional Budget Office (CBO)
U.S. Bureau of Labor Statistics (BLS)
Federal Reserve Economic Data (FRED Charts)
CME Fed Watch
U.S. Treasury – Yields
U.S. Census Bureau
Institute for Supply Management (ISM)
Weekly DOL Employment Data
BLS Monthly Jobs Report
JOLTS
US Energy Admin (EIA)
BLS Consumer Price Index CPI
BLS Producer Price Index PPI
Atlanta Fed GDPNOW
NY Fed Nowcast GDP
US Census Bureau Housing Starts
Consumer Credit
USCB Retail Sales
Construction Spending
Federal Reserve Dot Plots
NY Empire Index
Philadelphia Federal Reserve
P/E Ratio Data -Yardeni Research
Technical Analysis Info:
StockCharts.com – Financial Charts
Exponential vs Simple moving average
Other Links:
1973 Arab Oil Embargo
Hunt Brothers Silver
Long-Term Capital bailout
Categories:
Tags: