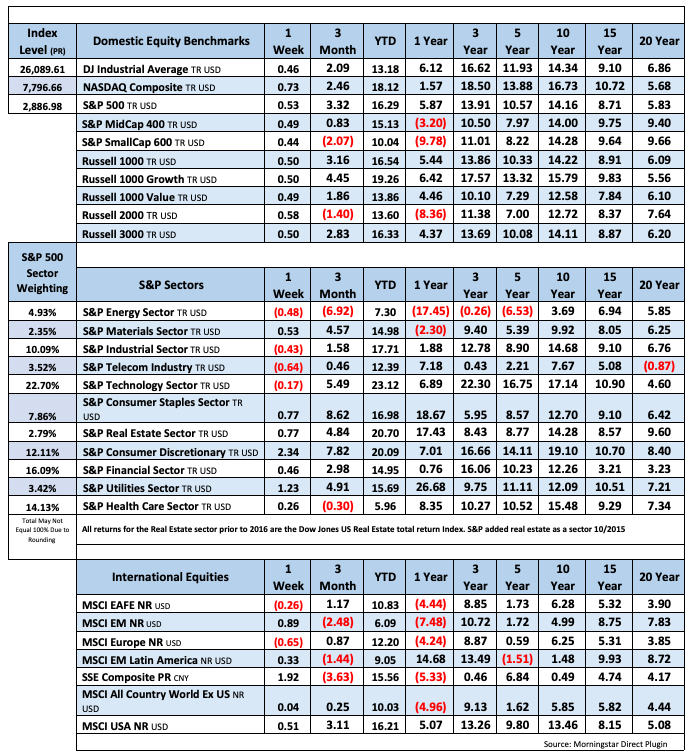
The S&P 500 increased 0.53% this week, buoyed by consumer discretionary companies as the market remained hopeful for positive outcomes in the Fed’s policy decision next week and the G-20 summit later this month. The Dow gained 0.4%, the Nasdaq rose 0.73%, and the R2k increased by 0.58%. There was strength early on in the week as the market was relieved to hear that the U.S. and Mexico reached a deal to avert a 5% tariff rate on all goods imported from Mexico. President Trump could still reinstate the tariffs, though, if the U.S. thinks Mexico is not doing enough to stop the flow of illegal migration through its borders.
At its high on Monday, the S&P 500 was up 6.1% in a span of six sessions. An understanding that the market may have advanced too far, too fast contributed to some tight-ranged sessions the rest of the week ahead of the Fed’s policy meeting next week and the G-20 summit at the end of the month. Growing expectations for the Fed to signal a rate cut and lingering hopes that the G-20 summit can improve U.S.-China trade relations contributed to the positive disposition. As of Friday, the fed funds futures market was seeing an 86.4% implied likelihood of a rate cut in July. Those expectations were bolstered this week by muted inflation pressure in the Consumer Price Index for May.
The federal deficit so far in fiscal 2019 is $739 billion. You can see the spending and revenue here: May budget receipts and outlays
Fixed Income

FOMC March Statement Federal Reserve Dot Plots Dec 18 US Debt Measurement March Meeting Minutes US Corporate Debt Tops $6 Trillion Treasury.gov yields
FOMC Policy Normalization Statement
Global Bond Yields
Foreign Exchange Market
Energy Complex
The Baker Hughes rig count lost 6 this week. There are 969 oil and gas rigs operating in the US – Down 90 over last year.
- Brent Crude Oil lost 2.02% this week closing at $62.01/bbl
- WTI Crude Oil fell 2.74% this week to close at $52.51/bbl
- Heating Oil rose 0.25% this week closing at $1.82/gallon
- Natural Gas gained 2.14% this week closing at $2.387 per million BTUs
- Unleaded Gas lost 0.37% this week closing at $1.732/gallon
Metals Complex
- Gold lost 0.12% this week closing at $1344.50/oz
- Silver fell 1.52% on the week closing at $14.80/oz
- Palladium gained 7.78% this week closing at $1461.5/oz
- Platinum fell 0.17% this week closing at $804.70/oz
- Copper lost 0.08% this week closing at $2.629/lb
Employment Picture
Weekly Unemployment Claims – Released Thursday 6/13 – In the week ending June 8th, initial claims were 222,000, an increase of 3000 from the previous week’s revised level. The 4-week moving average was 217,750, an increase of 2,500 from the previous week’s revised average.
Job Openings & Labor Turnover Survey JOLTS – Released Tuesday 6/10 – The U.S. Bureau of Labor Statistics reported the number of job openings was little changed at 7.4 million on the last business day of April. Over the month, hires edged up to 5.9million and separations were little changed at 5.6 million. Within separations, the quits rate remained unchanged at 2.3% at a level of 3.4 million. The layoffs and discharges rates were little changed at 1.2%.
May Jobs Report – BLS Summary – Released 6/7 – The US Economy added 75k nonfarm jobs in May (lower than expected) and the Unemployment rate remained unchanged at 3.6%. The April report was revised down 39k. Average hourly earnings increased by 6 cents. Hiring highlights include Education and Health Services +27k, Professional and Business Services +33k, Leisure and Hospitality +26k, and Retail Trade -8k.
- Average hourly earnings increased by 6 cents/ 0.22% in May y/y hourly earnings are up 3.1%.
- U3 unemployment remained unchanged at 3.6%. U6 unemployment rate declined 0.2% to 7.1%.
- The labor force participation rate was unchanged in May at 62.8% (Unchanged year/y).
- Average workweek was unchanged at 34.4 hours.
Employment Cost Index – Released 4/30/19 – Compensation costs for civilian workers increased 0.7% for the 3-month period ending in March 2019. The 12 month period ending in March 2019 saw compensation costs increase by 2.8% versus 2.7% in March 2018. Wages and salaries were up 2.9% for the 12-month period ending March 2019, versus 2.7% for the 12-month period ending March 2018. Benefit costs increased 2.6% for the 12-month period ending March 2019. For private industry workers, compensation costs increased 2.8% year-over-year, versus 2.8% for the 12 months ending March 2018. Wages and salaries increased 3.0% year-over-year, versus 2.9% for the 12 months ending March 2018. Benefit costs increased by 2.4%, versus 2.5% for the 12 months ending March 2018. This report is published quarterly.
This Week’s Economic Data
Links take you to the data source
Industrial Production and Capacity Utilization – Released 6/14 – Industrial production increased 0.4% in May following an upwardly revised 0.4% decrease (from -0.5%) in April. Total capacity utilization increased to 78.1% from an unrevised 77.9% in April.
Retail Sales – Released 6/14 – U.S. retail sales for May 2019, were $519 billion, an increase of 0.5% from the previous month. Retail sales are up 3.6% year to year.
Consumer Price Index – Released 6/12 – The Consumer Price Index increased 0.1% in May. Core CPI, which excludes food and energy increased 0.1%. The monthly changes left total CPI up 1.8% year-over-year and core CPI up 2.0%.
Producer Price Index – Released 6/11 – The Producer Price Index for final demand increased 0.1% in May. Core PPI was up 0.2%. Year over year the index for final demand rose 2.3%.
Recent Economic Data
Links take you to the data source
US Light Vehicle Sales – Released 6/7 – U.S. light vehicle sales were at a seasonally adjusted annual rate (SAAR) of 17.9 million units in May versus a SAAR of 16.9 million units in April.
Consumer Credit – Released 6/7 – Consumer credit increased at a seasonally adjusted annual rate of 5.25% in April. Revolving and nonrevolving credit increased 8.0% and 4.25% respectively. Total Outstanding consumer credit is currently at $4.070 trillion.
U.S. Trade Balance – Released 6/6 – The U.S. Trade deficit was $50.8 billion in April, down $1.1 billion from $51.9 billion in March. April exports were $206.8 billion, $4.6 billion less than March exports. April imports were $257.6 billion, $5.7 billion less than March imports. The goods and services deficit has increased $4.1 billion or 2.0% year to date. Year to date exports and imports increased $8.3 billion or 1.0% and $12.4 billion or 1.2% respectively.
PMI Non-Manufacturing Index (ISM Services) – Released 6/5 – Economic activity in the non-manufacturing sector grew in May for the 112th consecutive month. ISM Non-Manufacturing registered 56.9 percent, which is 1.4 percentage points higher than the April reading of 55.5 percent. This represents continued growth in the non-manufacturing sector, at a slightly faster rate.
PMI Manufacturing ISM Index – Released 6/3 – May PMI decreased 0.7% to 52.1% from April’s reading of 52.8%. The New Orders Index was up 1.0% from April’s reading of 51.7% to 52.7% for May. The Production Index registered 51.3% down 1.0%.
U.S. Construction Spending – Released 6/3 – Construction spending was roughly unchanged in April measuring at a seasonally adjusted annual rate of $1,298.5 billion. The April figure is 1.2% below the April 2018 estimate. Private construction spending was 1.7% below the revised March estimate at $954.0 billion. Public construction spending was 4.8% above the revised March estimate at $344.6 billion.
Chicago PMI – Released 5/31 – Chicago PMI increased 1.6 points in May rising to 54.2, up from 52.6 in April. Despite the uptick in sentiment, the survey points to softness in business activity as the three-month average slips to a two-year low. Since the turn of the year, slower growth in demand and production has presented weaker labor demand. Employment fell below both the three-month and 12-month averages reaching its lowest level since October 2017. Factory gate prices increased slightly following last month’s dramatic decline with the rise in the price of oil. Firms were asked about supply side issues with 40% claiming adverse impacts from supply side issues citing tariffs and delays adding costs and reducing competitiveness. Indicators are below their last year averages but moving toward their long-term means suggesting conditions are neither great nor bad.
Personal Income – Released 5/31 – Personal Income increased 0.5% in April after seeing a 0.1% increase in March according to the BEA. The majority of the increase in April was due to increases in personal interest income, wages and salaries, and government social benefits to persons. Real PCE (the Feds preferred inflation gauge) declined less than 0.1% in April. Real disposable personal income increased 0.1% in April.
Second Estimate of 1st Quarter GDP – Released 5/30 – According to the second estimate released by the Bureau of Economic Analysis, Real Gross Domestic Product (Real GDP) increased at an annual rate of 3.1% in the first quarter of 2019. The second estimate is based on more complete source data than was available for the advance estimate. The advance estimate, estimated real GDP increased at 3.2% in the 1st quarter. The first quarter increase in real GDP observed positive contributions from personal consumption expenditures (PCE), private inventory investment, exports, state and local gov’t spending, and nonresidential fixed income. Also, imports decreased in the first quarter further increasing gains to real GDP. Positive contributions were partly offset by a decrease in residential fixed investment. A third estimate for first quarter GDP growth will be released on June 27, 2019.
Consumer Confidence – Released 5/28 – The Consumer confidence index increased in May following an increase in April. The Index now shows a reading of 134.1 up from 129.2 in April. The increase in Consumer Confidence in May has brought the index levels back to levels seen last Fall hovering near 18-year highs. Consumer confidence levels suggest consumers expect the economy to continue to expand at a solid pace in the short term. Consumers continue to view both business and labor market conditions favorably.
Durable Goods – Released 5/24 – New orders for manufactured durable goods decreased $5.4 billion or 2.1% to $248.4 billion in April. The decrease in April follows a 1.7% increase in March. Two of the last three months have seen declines. Transportation equipment declined 5.9%, driving the decrease by $5.4 billion to $85.4 billion.
New Residential Sales – Released 5/23 – Sales of new single-family homes declined 6.9% to 673k, seasonally adjusted, in April. The median sales price of new homes sold in April was $342.2k with an average sales price of $393.7k. At the end of April the seasonally adjusted estimate of new homes for sale was 332k. This represents a supply of 5.9 months at the current sales rate.
Existing Home Sales – Released 5/21 – Existing home sales declined slightly by 0.4% in April. Sales declined to a seasonally adjusted rate of 5.19 million. Sales are currently down 4.4% from one year ago. Housing inventory increased to 4.2 months of inventory and the existing homes for sale increased to 1.83 million. The median sales price for all types of homes was $267,300, up 3.6% year/y.
Housing Starts – Released 5/16 – New home starts in April were at a seasonally adjusted rate of 1.235 million; up 5.7% above March but 2.5% below last April’s rate. Building Permits were at a seasonally adjusted rate of 1.296 million, up 0.6% compared to March and down 5.0% over last year.
Next week we get data on the Housing Starts and Existing Home Sales.
Data Sources:
Bureau of Economic Analysis (BEA)
Congressional Budget Office (CBO)
U.S. Bureau of Labor Statistics (BLS)
Federal Reserve Economic Data (FRED Charts)
CME Fed Watch
U.S. Treasury – Yields
U.S. Census Bureau
Institute for Supply Management (ISM)
Weekly DOL Employment Data
BLS Monthly Jobs Report
JOLTS
US Energy Admin (EIA)
BLS Consumer Price Index CPI
BLS Producer Price Index PPI
Atlanta Fed GDPNOW
NY Fed Nowcast GDP
US Census Bureau Housing Starts
Consumer Credit
USCB Retail Sales
Construction Spending
Federal Reserve Dot Plots
NY Empire Index
Philadelphia Federal Reserve
P/E Ratio Data -Yardeni Research
Technical Analysis Info:
StockCharts.com – Financial Charts
Exponential vs Simple moving average
Other Links:
1973 Arab Oil Embargo
Hunt Brothers Silver
Long-Term Capital bailout


Week 23 Talking Points #18
The S&P 500 increased 0.53% this week, buoyed by consumer discretionary companies as the market remained hopeful for positive outcomes in the Fed’s policy decision next week and the G-20 summit later this month. The Dow gained 0.4%, the Nasdaq rose 0.73%, and the R2k increased by 0.58%. There was strength early on in the week as the market was relieved to hear that the U.S. and Mexico reached a deal to avert a 5% tariff rate on all goods imported from Mexico. President Trump could still reinstate the tariffs, though, if the U.S. thinks Mexico is not doing enough to stop the flow of illegal migration through its borders.
At its high on Monday, the S&P 500 was up 6.1% in a span of six sessions. An understanding that the market may have advanced too far, too fast contributed to some tight-ranged sessions the rest of the week ahead of the Fed’s policy meeting next week and the G-20 summit at the end of the month. Growing expectations for the Fed to signal a rate cut and lingering hopes that the G-20 summit can improve U.S.-China trade relations contributed to the positive disposition. As of Friday, the fed funds futures market was seeing an 86.4% implied likelihood of a rate cut in July. Those expectations were bolstered this week by muted inflation pressure in the Consumer Price Index for May.
The federal deficit so far in fiscal 2019 is $739 billion. You can see the spending and revenue here: May budget receipts and outlays
Table of Contents
Fixed Income
FOMC March Statement Federal Reserve Dot Plots Dec 18 US Debt Measurement March Meeting Minutes US Corporate Debt Tops $6 Trillion Treasury.gov yields
FOMC Policy Normalization Statement
Global Bond Yields
Foreign Exchange Market
Energy Complex
The Baker Hughes rig count lost 6 this week. There are 969 oil and gas rigs operating in the US – Down 90 over last year.
Metals Complex
Employment Picture
Weekly Unemployment Claims – Released Thursday 6/13 – In the week ending June 8th, initial claims were 222,000, an increase of 3000 from the previous week’s revised level. The 4-week moving average was 217,750, an increase of 2,500 from the previous week’s revised average.
Job Openings & Labor Turnover Survey JOLTS – Released Tuesday 6/10 – The U.S. Bureau of Labor Statistics reported the number of job openings was little changed at 7.4 million on the last business day of April. Over the month, hires edged up to 5.9million and separations were little changed at 5.6 million. Within separations, the quits rate remained unchanged at 2.3% at a level of 3.4 million. The layoffs and discharges rates were little changed at 1.2%.
May Jobs Report – BLS Summary – Released 6/7 – The US Economy added 75k nonfarm jobs in May (lower than expected) and the Unemployment rate remained unchanged at 3.6%. The April report was revised down 39k. Average hourly earnings increased by 6 cents. Hiring highlights include Education and Health Services +27k, Professional and Business Services +33k, Leisure and Hospitality +26k, and Retail Trade -8k.
Employment Cost Index – Released 4/30/19 – Compensation costs for civilian workers increased 0.7% for the 3-month period ending in March 2019. The 12 month period ending in March 2019 saw compensation costs increase by 2.8% versus 2.7% in March 2018. Wages and salaries were up 2.9% for the 12-month period ending March 2019, versus 2.7% for the 12-month period ending March 2018. Benefit costs increased 2.6% for the 12-month period ending March 2019. For private industry workers, compensation costs increased 2.8% year-over-year, versus 2.8% for the 12 months ending March 2018. Wages and salaries increased 3.0% year-over-year, versus 2.9% for the 12 months ending March 2018. Benefit costs increased by 2.4%, versus 2.5% for the 12 months ending March 2018. This report is published quarterly.
This Week’s Economic Data
Links take you to the data source
Industrial Production and Capacity Utilization – Released 6/14 – Industrial production increased 0.4% in May following an upwardly revised 0.4% decrease (from -0.5%) in April. Total capacity utilization increased to 78.1% from an unrevised 77.9% in April.
Retail Sales – Released 6/14 – U.S. retail sales for May 2019, were $519 billion, an increase of 0.5% from the previous month. Retail sales are up 3.6% year to year.
Consumer Price Index – Released 6/12 – The Consumer Price Index increased 0.1% in May. Core CPI, which excludes food and energy increased 0.1%. The monthly changes left total CPI up 1.8% year-over-year and core CPI up 2.0%.
Producer Price Index – Released 6/11 – The Producer Price Index for final demand increased 0.1% in May. Core PPI was up 0.2%. Year over year the index for final demand rose 2.3%.
Recent Economic Data
Links take you to the data source
US Light Vehicle Sales – Released 6/7 – U.S. light vehicle sales were at a seasonally adjusted annual rate (SAAR) of 17.9 million units in May versus a SAAR of 16.9 million units in April.
Consumer Credit – Released 6/7 – Consumer credit increased at a seasonally adjusted annual rate of 5.25% in April. Revolving and nonrevolving credit increased 8.0% and 4.25% respectively. Total Outstanding consumer credit is currently at $4.070 trillion.
U.S. Trade Balance – Released 6/6 – The U.S. Trade deficit was $50.8 billion in April, down $1.1 billion from $51.9 billion in March. April exports were $206.8 billion, $4.6 billion less than March exports. April imports were $257.6 billion, $5.7 billion less than March imports. The goods and services deficit has increased $4.1 billion or 2.0% year to date. Year to date exports and imports increased $8.3 billion or 1.0% and $12.4 billion or 1.2% respectively.
PMI Non-Manufacturing Index (ISM Services) – Released 6/5 – Economic activity in the non-manufacturing sector grew in May for the 112th consecutive month. ISM Non-Manufacturing registered 56.9 percent, which is 1.4 percentage points higher than the April reading of 55.5 percent. This represents continued growth in the non-manufacturing sector, at a slightly faster rate.
PMI Manufacturing ISM Index – Released 6/3 – May PMI decreased 0.7% to 52.1% from April’s reading of 52.8%. The New Orders Index was up 1.0% from April’s reading of 51.7% to 52.7% for May. The Production Index registered 51.3% down 1.0%.
U.S. Construction Spending – Released 6/3 – Construction spending was roughly unchanged in April measuring at a seasonally adjusted annual rate of $1,298.5 billion. The April figure is 1.2% below the April 2018 estimate. Private construction spending was 1.7% below the revised March estimate at $954.0 billion. Public construction spending was 4.8% above the revised March estimate at $344.6 billion.
Chicago PMI – Released 5/31 – Chicago PMI increased 1.6 points in May rising to 54.2, up from 52.6 in April. Despite the uptick in sentiment, the survey points to softness in business activity as the three-month average slips to a two-year low. Since the turn of the year, slower growth in demand and production has presented weaker labor demand. Employment fell below both the three-month and 12-month averages reaching its lowest level since October 2017. Factory gate prices increased slightly following last month’s dramatic decline with the rise in the price of oil. Firms were asked about supply side issues with 40% claiming adverse impacts from supply side issues citing tariffs and delays adding costs and reducing competitiveness. Indicators are below their last year averages but moving toward their long-term means suggesting conditions are neither great nor bad.
Personal Income – Released 5/31 – Personal Income increased 0.5% in April after seeing a 0.1% increase in March according to the BEA. The majority of the increase in April was due to increases in personal interest income, wages and salaries, and government social benefits to persons. Real PCE (the Feds preferred inflation gauge) declined less than 0.1% in April. Real disposable personal income increased 0.1% in April.
Second Estimate of 1st Quarter GDP – Released 5/30 – According to the second estimate released by the Bureau of Economic Analysis, Real Gross Domestic Product (Real GDP) increased at an annual rate of 3.1% in the first quarter of 2019. The second estimate is based on more complete source data than was available for the advance estimate. The advance estimate, estimated real GDP increased at 3.2% in the 1st quarter. The first quarter increase in real GDP observed positive contributions from personal consumption expenditures (PCE), private inventory investment, exports, state and local gov’t spending, and nonresidential fixed income. Also, imports decreased in the first quarter further increasing gains to real GDP. Positive contributions were partly offset by a decrease in residential fixed investment. A third estimate for first quarter GDP growth will be released on June 27, 2019.
Consumer Confidence – Released 5/28 – The Consumer confidence index increased in May following an increase in April. The Index now shows a reading of 134.1 up from 129.2 in April. The increase in Consumer Confidence in May has brought the index levels back to levels seen last Fall hovering near 18-year highs. Consumer confidence levels suggest consumers expect the economy to continue to expand at a solid pace in the short term. Consumers continue to view both business and labor market conditions favorably.
Durable Goods – Released 5/24 – New orders for manufactured durable goods decreased $5.4 billion or 2.1% to $248.4 billion in April. The decrease in April follows a 1.7% increase in March. Two of the last three months have seen declines. Transportation equipment declined 5.9%, driving the decrease by $5.4 billion to $85.4 billion.
New Residential Sales – Released 5/23 – Sales of new single-family homes declined 6.9% to 673k, seasonally adjusted, in April. The median sales price of new homes sold in April was $342.2k with an average sales price of $393.7k. At the end of April the seasonally adjusted estimate of new homes for sale was 332k. This represents a supply of 5.9 months at the current sales rate.
Existing Home Sales – Released 5/21 – Existing home sales declined slightly by 0.4% in April. Sales declined to a seasonally adjusted rate of 5.19 million. Sales are currently down 4.4% from one year ago. Housing inventory increased to 4.2 months of inventory and the existing homes for sale increased to 1.83 million. The median sales price for all types of homes was $267,300, up 3.6% year/y.
Housing Starts – Released 5/16 – New home starts in April were at a seasonally adjusted rate of 1.235 million; up 5.7% above March but 2.5% below last April’s rate. Building Permits were at a seasonally adjusted rate of 1.296 million, up 0.6% compared to March and down 5.0% over last year.
Next week we get data on the Housing Starts and Existing Home Sales.
Data Sources:
Bureau of Economic Analysis (BEA)
Congressional Budget Office (CBO)
U.S. Bureau of Labor Statistics (BLS)
Federal Reserve Economic Data (FRED Charts)
CME Fed Watch
U.S. Treasury – Yields
U.S. Census Bureau
Institute for Supply Management (ISM)
Weekly DOL Employment Data
BLS Monthly Jobs Report
JOLTS
US Energy Admin (EIA)
BLS Consumer Price Index CPI
BLS Producer Price Index PPI
Atlanta Fed GDPNOW
NY Fed Nowcast GDP
US Census Bureau Housing Starts
Consumer Credit
USCB Retail Sales
Construction Spending
Federal Reserve Dot Plots
NY Empire Index
Philadelphia Federal Reserve
P/E Ratio Data -Yardeni Research
Technical Analysis Info:
StockCharts.com – Financial Charts
Exponential vs Simple moving average
Other Links:
1973 Arab Oil Embargo
Hunt Brothers Silver
Long-Term Capital bailout
Categories:
Tags: