Good Life Advisors – Talking Points – Week 17
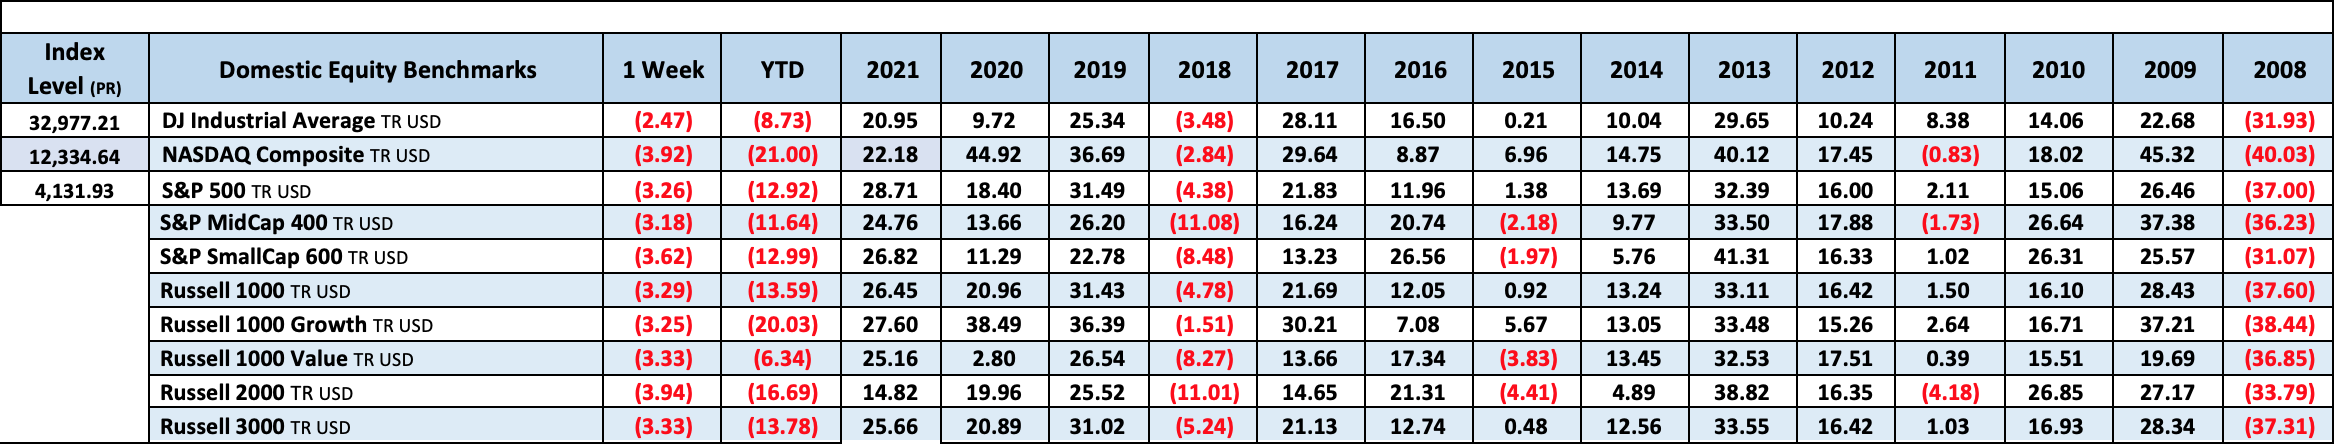
An April sell-off in tech stocks deepened Friday, dragging the Nasdaq to its worst monthly performance in more than a decade, as soaring inflation and rising interest rates fanned worries of a recession. The broad selloff has erased trillions of dollars in market value from the tech-heavy gauge, with investors souring on shares of everything from software and semiconductor companies to social-media giants. Friday’s 4.2% decline brings its April loss to more than 13%. The index is down 21% ytd, its worst start to a year on record. The S&P 500 closed Friday 13.85% off its all-time time high. At the same time, the U.S. bond aggregate closed Friday down 10.7% from August 21’, marking its second largest drawdown since 1980.
Worries about the Federal Reserve raising interest rates, soaring inflation and the path of the economy have brought stocks sharply lower from the record levels at which they started the year. Many pandemic-era winners also have come falling back to earth as consumer tastes have evolved since 2020. And recently, earnings season has been dotted with some high-profile disappointments, delivering head-spinning one-day stock moves following the reports.
There was no shortage of other bearish talking points throughout the month of April, with many of them stemming from the policy shift theme. Tightening financial conditions, bouts of curve inversion and negative real wage growth dynamics drove some recession calls. The sharp jump in mortgage rates and longstanding affordability issues also fostered some angst around what has been a very strong housing market. Dollar strength was frequently cited in Q1 earnings reports and conference calls as a drag on guidance as well. Risk to consensus 2022 EPS estimates was also flagged via persistent supply chain and input price (including wages) pressures, along with skepticism about the ability of corporate America to keep taking prices increases. The biggest issue not related to the policy shift theme seemed to be China’s unwillingness to deviate from its zero-tolerance approach to Covid and related lockdowns. Sell-side firms slashed their China growth estimates for 2022, with the median falling to 4.5%, a full point below the government’s target. The China lockdowns were also flagged as another earnings headwind from companies in a wide range of industries. Finally, geopolitical tensions remained unsettled in April and played into both the cautious guidance and commodity rally/persistent inflation narratives.

Fixed Income
FOMC Minutes Credit, Liquidity and Balance Sheet Federal Reserve Dot Plots
US Corporate Debt Tops 7 Trillion. Treasury.gov yields FOMC Policy Normalization Statement Longer Run Goals August 2020
Foreign Exchange Market
Energy Complex
The Baker Hughes rig count gained 3 this week. There are 698 oil and gas rigs operating in the US – Up 258 over last year.
Metals Complex
Employment Picture
Employment Cost Index – Released 4/29/2022 – Compensation costs for civilian workers increased 1.4% for the 3-month period ending in March 2022. The 12-month period ending in March 2022 saw compensation costs increase by 4.5%. The 12-month period ending March 2021 increased 2.6%. Wages and salaries increased 4.7 percent over the year and increased 2.7 percent for the 12-month period ending in March 2021. Benefit costs increased 4.1 percent over the year and increased 2.5 percent for the 12-month period ending in March 2021. This report is published quarterly.
Weekly Unemployment Claims – Released Thursday 4/28/2022 – The week ending April 23rd observed a decrease of 5k in initial claims decreasing to 180k. The four-week moving average of initial jobless claims increased 2.25k to 179.75k.
March Jobs Report – BLS Summary Released 4/1/2022 – The US Economy added 431k nonfarm jobs in March and the Unemployment rate declined to 3.6%. Average hourly earnings increased 13 to $31.73. Hiring highlights include +112k Leisure and Hospitality, +102k Professional and Business Services, +53k Education and Health Services, and +49k Retail Trade.
- Average hourly earnings increased 13 cents to $31.73.
- U3 unemployment rate declined 0.2% to 3.6%. U6 unemployment rate declined to 6.9%.
- The labor force participation rate was little changed at 62.4%.
- Average work week fell 0.1 hour to 34.6 hours.
Job Openings & Labor Turnover Survey JOLTS – Released 3/29/2022 – The U.S. Bureau of Labor Statistics reported the number and rate of job openings was little changed at 11.3 million on the last business day of February. Over the month, hires increased 6.7 million and separations were little changed at 6.1 million. Within separations, the quits rate was little changed at 2.9%. The layoffs and discharges rates were unchanged at 0.9%.
This Week’s Economic Data
Links take you to the data source
Chicago PMI – Released 4/29/2022 – Chicago PMI decreased by 6.5 points in April to 56.4. All five of the main five indicators decreased.
Personal Income – Released 4/29/2022 – Personal income increased $107.2 billion or 0.5 percent in March according to estimates released today by the Bureau of Economic Analysis. Disposable personal income (DPI) increased $89.7 billion or 0.5 percent and personal consumption expenditures (PCE) increased $185.0 billion or 1.1 percent.
Advance Estimate of 1st Quarter 2022 GDP – Released 4/28/2022 – Real gross domestic product (GDP) decreased at an annual rate of 1.4 percent in the first quarter of 2022, according to the advance estimate released by the Bureau of Economic Analysis. GDP increased 6.9 percent in the fourth quarter of 2021. The GDP advance estimate is based on data that are incomplete or subject to further revision. The decrease in real GDP reflected decreases in private inventory investment, exports, federal government spending, and state and local government spending, while imports, which are a subtraction in the calculation of GDP, increased. Personal consumption expenditures (PCE), nonresidential fixed investment, and residential fixed investment increased.
Consumer Confidence – Released 4/26/2022 – The Consumer confidence index saw a slight decline in April following an increase in March. The Index now stands at 107.3, down from 107.6 in March.
Durable Goods – Released 4/26/2022 – New orders for manufactured durable goods in March increased $2.3 billion or 0.8% to $275.0 billion. Computer and electronic products led the increase rising $0.7 billion or 2.6% to $26.3 billion.
New Residential Sales – Released 4/26/2022 – Sales of new single-family homes decreased 8.6% to 763k, seasonally adjusted, in March. The median sales price of new homes sold in February was $436,700 with an average sales price of $523,900. At the end of March, the seasonally adjusted estimate of new homes for sale was 407k. This represents a supply of 6.4 months at the current sales rate.
Recent Economic Data
Links take you to the data source
Existing Home Sales – Released 4/20/2022 – Existing home sales decreased in March following a decrease in February. Sales declined 2.7% to a seasonally adjusted rate of 5.77 million in March. Sales decreased 4.5% year-over-year. Housing inventory sits at 950k units. Up 11.8% from February’s inventory. Down 9.5% over last year. Unsold inventory sits at a 1.7-month supply. The median existing home price for all housing types was $375,300 which is up 15.0% from March 2021. This marks 121 consecutive months of year-over-year increases, the longest-running streak on record.
Housing Starts – Released 4/19/2022 – New home starts in March were at a seasonally adjusted annual rate of 1.793 million; up 0.3% above February, and 3.9% above last March’s rate. Building Permits were at a seasonally adjusted annual rate of 1.865 million, up 0.4% compared to February, but up 6.7% over last year.
Industrial Production and Capacity Utilization – Released 4/15/2022 – In March Industrial production increased 0.9%. Manufacturing increased 0.9%. Utilities output increased 0.4%. Mining output increased 1.7%. Total industrial production was 5.5% higher in March than a year ago. Total capacity utilization increased 0.7% to 78.3% in March which is 1.2% below its long run average.
Retail Sales – Released 4/14/2022 – U.S. retail sales for March increased 0.5% to $665.7 billion and retail sales are 6.9% above March 2021. U.S. retail sales for the January 2022 through March 2022 period were up 12.9% from the same period a year ago.
Producer Price Index – Released 4/13/2022 – The Producer Price Index for final demand increased 1.4% in March. PPI less food and energy increased 1.1%. The change in PPI for final demand has increased 11.2% year/y.
Consumer Price Index – Released 4/12/2022 – Consumer prices rose 1.2% m/m in March following a 0.8% gain in February. Consumer prices are up 8.5% for the 12-month period ending in March. Core consumer prices increased 0.3% m/m in March following a 0.5% gain in February.
US Light Vehicle Sales – Released 4/8/2022 – U.S. light vehicle sales were at a seasonally adjusted annual rate (SAAR) of 13.333 million units in March.
Consumer Credit – Released 4/7/2022 – Consumer credit increased at a seasonally adjusted annual rate of 11.3 percent in February. Revolving credit increased at an annual rate of 20.7 percent, while nonrevolving credit increased at an annual rate of 8.4 percent.
U.S. Trade Balance – Released 4/5/2022 – According to the U.S. Census Bureau of Economic Analysis the goods and services deficit decreased in February by $0.1 billion to $89.2 billion. February exports were $228.6 billion, $4.1 billion more than January exports. February imports were $317.8 billion, $4.1 billion more than January imports. Year-over-year, the goods and services deficit increased $45.7 billion, or 34.5 percent, from the same period in 2021. Exports increased $68.0 billion or 17.6 percent. Imports increased $113.7 billion or 22.0 percent.
PMI Non-Manufacturing Index – Released 4/5/2022 – Economic activity in the non-manufacturing sector grew in March for the 22nd consecutive month. ISM Non-Manufacturing registered 58.3 percent, which is 1.8 percentage points above the February reading of 56.5 percent.
PMI Manufacturing Index – Released 4/1/2022 – March PMI decreased 1.5% to 57.1% down from February’s reading of 58.6%. The New Orders Index was 53.8% down 7.9% from February’s reading of 61.7%. The Production Index registered 54.5%, down 4.0%.
U.S. Construction Spending – Released 4/1/2022 – Construction spending increased 0.5% in February measuring at a seasonally adjusted annual rate of $1,704.4 billion. The February figure is 11.2% above the February 2021 estimate. Private construction spending was 0.8% above the revised January estimate at $1,343.4 billion. Public construction spending was 0.4% below the revised January estimate at $350.7 billion.
Next week we get data on U.S. Construction Spending, Manufacturing PMI, Services PMI, the U.S. Trade Balance, Consumer Credit, JOLTS, and the April Jobs Report.
Data Sources:
Bureau of Economic Analysis (BEA)
Congressional Budget Office (CBO)
U.S. Bureau of Labor Statistics (BLS)
Federal Reserve Economic Data (FRED Charts)
CME Fed Watch
U.S. Treasury – Yields
U.S. Census Bureau
Institute for Supply Management (ISM)
Weekly DOL Employment Data
BLS Monthly Jobs Report
JOLTS
US Energy Admin (EIA)
BLS Consumer Price Index CPI
BLS Producer Price Index PPI
Atlanta Fed GDPNOW
NY Fed Nowcast GDP
US Census Bureau Housing Starts
Consumer Credit
USCB Retail Sales
Construction Spending
Federal Reserve Dot Plots
NY Empire Index
Philadelphia Federal Reserve
P/E Ratio Data -Yardeni Research
Technical Analysis Info:
StockCharts.com – Financial Charts
Exponential vs Simple moving average
Other Links:
1973 Arab Oil Embargo
Hunt Brothers Silver
Long-Term Capital bailout


Week 17 Talking Points
Good Life Advisors – Talking Points – Week 17
An April sell-off in tech stocks deepened Friday, dragging the Nasdaq to its worst monthly performance in more than a decade, as soaring inflation and rising interest rates fanned worries of a recession. The broad selloff has erased trillions of dollars in market value from the tech-heavy gauge, with investors souring on shares of everything from software and semiconductor companies to social-media giants. Friday’s 4.2% decline brings its April loss to more than 13%. The index is down 21% ytd, its worst start to a year on record. The S&P 500 closed Friday 13.85% off its all-time time high. At the same time, the U.S. bond aggregate closed Friday down 10.7% from August 21’, marking its second largest drawdown since 1980.
Worries about the Federal Reserve raising interest rates, soaring inflation and the path of the economy have brought stocks sharply lower from the record levels at which they started the year. Many pandemic-era winners also have come falling back to earth as consumer tastes have evolved since 2020. And recently, earnings season has been dotted with some high-profile disappointments, delivering head-spinning one-day stock moves following the reports.
There was no shortage of other bearish talking points throughout the month of April, with many of them stemming from the policy shift theme. Tightening financial conditions, bouts of curve inversion and negative real wage growth dynamics drove some recession calls. The sharp jump in mortgage rates and longstanding affordability issues also fostered some angst around what has been a very strong housing market. Dollar strength was frequently cited in Q1 earnings reports and conference calls as a drag on guidance as well. Risk to consensus 2022 EPS estimates was also flagged via persistent supply chain and input price (including wages) pressures, along with skepticism about the ability of corporate America to keep taking prices increases. The biggest issue not related to the policy shift theme seemed to be China’s unwillingness to deviate from its zero-tolerance approach to Covid and related lockdowns. Sell-side firms slashed their China growth estimates for 2022, with the median falling to 4.5%, a full point below the government’s target. The China lockdowns were also flagged as another earnings headwind from companies in a wide range of industries. Finally, geopolitical tensions remained unsettled in April and played into both the cautious guidance and commodity rally/persistent inflation narratives.
Table of Contents
Fixed Income
FOMC Minutes Credit, Liquidity and Balance Sheet Federal Reserve Dot Plots
US Corporate Debt Tops 7 Trillion. Treasury.gov yields FOMC Policy Normalization Statement Longer Run Goals August 2020
Foreign Exchange Market
Energy Complex
The Baker Hughes rig count gained 3 this week. There are 698 oil and gas rigs operating in the US – Up 258 over last year.
Metals Complex
Employment Picture
Employment Cost Index – Released 4/29/2022 – Compensation costs for civilian workers increased 1.4% for the 3-month period ending in March 2022. The 12-month period ending in March 2022 saw compensation costs increase by 4.5%. The 12-month period ending March 2021 increased 2.6%. Wages and salaries increased 4.7 percent over the year and increased 2.7 percent for the 12-month period ending in March 2021. Benefit costs increased 4.1 percent over the year and increased 2.5 percent for the 12-month period ending in March 2021. This report is published quarterly.
Weekly Unemployment Claims – Released Thursday 4/28/2022 – The week ending April 23rd observed a decrease of 5k in initial claims decreasing to 180k. The four-week moving average of initial jobless claims increased 2.25k to 179.75k.
March Jobs Report – BLS Summary Released 4/1/2022 – The US Economy added 431k nonfarm jobs in March and the Unemployment rate declined to 3.6%. Average hourly earnings increased 13 to $31.73. Hiring highlights include +112k Leisure and Hospitality, +102k Professional and Business Services, +53k Education and Health Services, and +49k Retail Trade.
Job Openings & Labor Turnover Survey JOLTS – Released 3/29/2022 – The U.S. Bureau of Labor Statistics reported the number and rate of job openings was little changed at 11.3 million on the last business day of February. Over the month, hires increased 6.7 million and separations were little changed at 6.1 million. Within separations, the quits rate was little changed at 2.9%. The layoffs and discharges rates were unchanged at 0.9%.
This Week’s Economic Data
Links take you to the data source
Chicago PMI – Released 4/29/2022 – Chicago PMI decreased by 6.5 points in April to 56.4. All five of the main five indicators decreased.
Personal Income – Released 4/29/2022 – Personal income increased $107.2 billion or 0.5 percent in March according to estimates released today by the Bureau of Economic Analysis. Disposable personal income (DPI) increased $89.7 billion or 0.5 percent and personal consumption expenditures (PCE) increased $185.0 billion or 1.1 percent.
Advance Estimate of 1st Quarter 2022 GDP – Released 4/28/2022 – Real gross domestic product (GDP) decreased at an annual rate of 1.4 percent in the first quarter of 2022, according to the advance estimate released by the Bureau of Economic Analysis. GDP increased 6.9 percent in the fourth quarter of 2021. The GDP advance estimate is based on data that are incomplete or subject to further revision. The decrease in real GDP reflected decreases in private inventory investment, exports, federal government spending, and state and local government spending, while imports, which are a subtraction in the calculation of GDP, increased. Personal consumption expenditures (PCE), nonresidential fixed investment, and residential fixed investment increased.
Consumer Confidence – Released 4/26/2022 – The Consumer confidence index saw a slight decline in April following an increase in March. The Index now stands at 107.3, down from 107.6 in March.
Durable Goods – Released 4/26/2022 – New orders for manufactured durable goods in March increased $2.3 billion or 0.8% to $275.0 billion. Computer and electronic products led the increase rising $0.7 billion or 2.6% to $26.3 billion.
New Residential Sales – Released 4/26/2022 – Sales of new single-family homes decreased 8.6% to 763k, seasonally adjusted, in March. The median sales price of new homes sold in February was $436,700 with an average sales price of $523,900. At the end of March, the seasonally adjusted estimate of new homes for sale was 407k. This represents a supply of 6.4 months at the current sales rate.
Recent Economic Data
Links take you to the data source
Existing Home Sales – Released 4/20/2022 – Existing home sales decreased in March following a decrease in February. Sales declined 2.7% to a seasonally adjusted rate of 5.77 million in March. Sales decreased 4.5% year-over-year. Housing inventory sits at 950k units. Up 11.8% from February’s inventory. Down 9.5% over last year. Unsold inventory sits at a 1.7-month supply. The median existing home price for all housing types was $375,300 which is up 15.0% from March 2021. This marks 121 consecutive months of year-over-year increases, the longest-running streak on record.
Housing Starts – Released 4/19/2022 – New home starts in March were at a seasonally adjusted annual rate of 1.793 million; up 0.3% above February, and 3.9% above last March’s rate. Building Permits were at a seasonally adjusted annual rate of 1.865 million, up 0.4% compared to February, but up 6.7% over last year.
Industrial Production and Capacity Utilization – Released 4/15/2022 – In March Industrial production increased 0.9%. Manufacturing increased 0.9%. Utilities output increased 0.4%. Mining output increased 1.7%. Total industrial production was 5.5% higher in March than a year ago. Total capacity utilization increased 0.7% to 78.3% in March which is 1.2% below its long run average.
Retail Sales – Released 4/14/2022 – U.S. retail sales for March increased 0.5% to $665.7 billion and retail sales are 6.9% above March 2021. U.S. retail sales for the January 2022 through March 2022 period were up 12.9% from the same period a year ago.
Producer Price Index – Released 4/13/2022 – The Producer Price Index for final demand increased 1.4% in March. PPI less food and energy increased 1.1%. The change in PPI for final demand has increased 11.2% year/y.
Consumer Price Index – Released 4/12/2022 – Consumer prices rose 1.2% m/m in March following a 0.8% gain in February. Consumer prices are up 8.5% for the 12-month period ending in March. Core consumer prices increased 0.3% m/m in March following a 0.5% gain in February.
US Light Vehicle Sales – Released 4/8/2022 – U.S. light vehicle sales were at a seasonally adjusted annual rate (SAAR) of 13.333 million units in March.
Consumer Credit – Released 4/7/2022 – Consumer credit increased at a seasonally adjusted annual rate of 11.3 percent in February. Revolving credit increased at an annual rate of 20.7 percent, while nonrevolving credit increased at an annual rate of 8.4 percent.
U.S. Trade Balance – Released 4/5/2022 – According to the U.S. Census Bureau of Economic Analysis the goods and services deficit decreased in February by $0.1 billion to $89.2 billion. February exports were $228.6 billion, $4.1 billion more than January exports. February imports were $317.8 billion, $4.1 billion more than January imports. Year-over-year, the goods and services deficit increased $45.7 billion, or 34.5 percent, from the same period in 2021. Exports increased $68.0 billion or 17.6 percent. Imports increased $113.7 billion or 22.0 percent.
PMI Non-Manufacturing Index – Released 4/5/2022 – Economic activity in the non-manufacturing sector grew in March for the 22nd consecutive month. ISM Non-Manufacturing registered 58.3 percent, which is 1.8 percentage points above the February reading of 56.5 percent.
PMI Manufacturing Index – Released 4/1/2022 – March PMI decreased 1.5% to 57.1% down from February’s reading of 58.6%. The New Orders Index was 53.8% down 7.9% from February’s reading of 61.7%. The Production Index registered 54.5%, down 4.0%.
U.S. Construction Spending – Released 4/1/2022 – Construction spending increased 0.5% in February measuring at a seasonally adjusted annual rate of $1,704.4 billion. The February figure is 11.2% above the February 2021 estimate. Private construction spending was 0.8% above the revised January estimate at $1,343.4 billion. Public construction spending was 0.4% below the revised January estimate at $350.7 billion.
Next week we get data on U.S. Construction Spending, Manufacturing PMI, Services PMI, the U.S. Trade Balance, Consumer Credit, JOLTS, and the April Jobs Report.
Data Sources:
Bureau of Economic Analysis (BEA)
Congressional Budget Office (CBO)
U.S. Bureau of Labor Statistics (BLS)
Federal Reserve Economic Data (FRED Charts)
CME Fed Watch
U.S. Treasury – Yields
U.S. Census Bureau
Institute for Supply Management (ISM)
Weekly DOL Employment Data
BLS Monthly Jobs Report
JOLTS
US Energy Admin (EIA)
BLS Consumer Price Index CPI
BLS Producer Price Index PPI
Atlanta Fed GDPNOW
NY Fed Nowcast GDP
US Census Bureau Housing Starts
Consumer Credit
USCB Retail Sales
Construction Spending
Federal Reserve Dot Plots
NY Empire Index
Philadelphia Federal Reserve
P/E Ratio Data -Yardeni Research
Technical Analysis Info:
StockCharts.com – Financial Charts
Exponential vs Simple moving average
Other Links:
1973 Arab Oil Embargo
Hunt Brothers Silver
Long-Term Capital bailout
Categories:
Tags: