Ahead this week, US China trade talks continue as Beijing’s top trade negotiator travels to Washington for more discussions. Expect more volatility in the British Pound £ as the UK Parliament fights off a no-deal Brexit. On the data front, this coming week is full of releases, housing starts, trade balance, new home sales, personal spending and of course the Big one: non-farm payrolls come out Friday.
The ten-year yield, minus the two year is still positive but the one, two and six months rates are currently above the ten year.

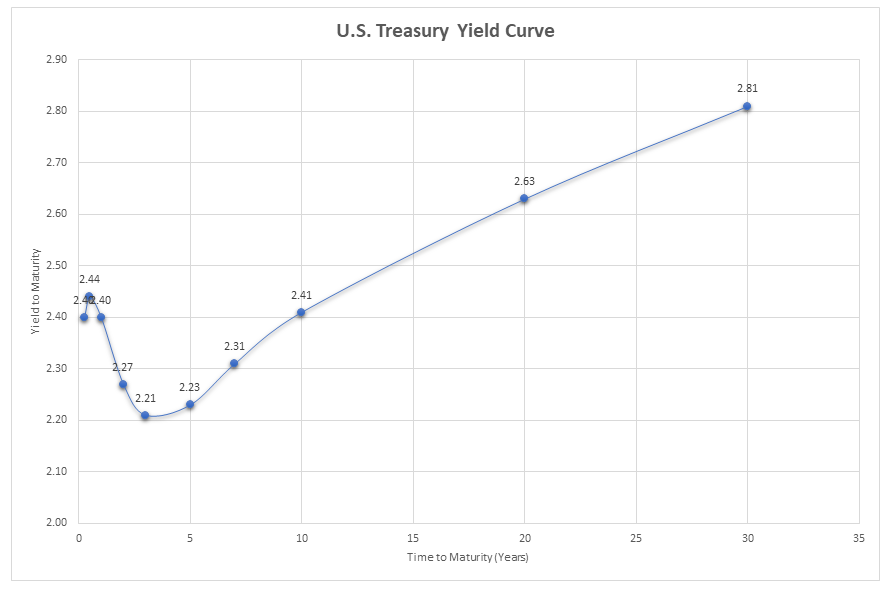
Fixed Income
FOMC January Statement Federal Reserve Dot Plots Dec 18 US Debt Measurement– January Meeting Minutes US Corporate Debt Tops $6 Trillion. Treasury.gov yields
Global Bond Yields
The Federal Reserve decreased their total holdings by 10.8% over the last year. $4.435 Trillion to $3.956 Trillion.
https://fred.stlouisfed.org/graph/?g=n9BM
Foreign Exchange Market
The USD weakened slightly but has been gaining strength despite concerns over the US economy.
Energy Complex
The Baker Hughes rig count declined by 10 this week. There are 1006 oil and gas rigs operating in the US – Up 13 over last year.
- Brent Crude Oil gained 0.79% this week closing at $67.56/bbl
- WTI Crude Oil gained 1.86% this week to close at $60.14/bbl
- Heating Oil gained 0.23% this week closing at $1.97/gallon
- Natural Gas declined 3.79% this week closing at $2.66 per million BTUs
- Unleaded Gas declined 0.40% this week closing at $1.88/gallon
Metals Complex
Gold back under $1300/oz. again.
- Gold declined 1.05% this week closing at $1298.50/oz
- Silver declined 1.93% on the week closing at $15.11/oz
- Palladium declined 11.46% this week closing at $1341.80/oz
- Platinum gained 0.67% this week closing at $854.10/oz
- Copper gained 3.29% this week closing at $2.94/lb
Employment Picture
Weekly Unemployment Claims – Released Thursday 3/28 – In the week ending March 23rd, initial claims were 211,000 a decrease of 5,000 from the previous week’s revised level. The 4-week moving average was 217,250, a decrease of 3,250 from the previous week’s revised average.
February Jobs Report – BLS Summary – Released 3/8 – The US Economy added 20k nonfarm jobs in February and the Unemployment rate declined to 3.8%. February’s 20k increase in nonfarm jobs is a little change, given the job growth has averaged 235k over the prior 12 months. The January report was revised up 7k. Average hourly earnings increased by 11 cents. Hiring highlights include Professional and Business services +42k, Health Care +21k, Wholesale trade +11k, Construction -31k, and Retail Trade -6k.
- Average hourly earnings increased by 11 cents/ 0.40% in February y/y hourly earnings are up 3.4%.
- U3 unemployment edged downward by 0.2 to 3.8%. U6 unemployment rate decreased by 0.8 at 7.3%.
- The labor force participation rate held steady at 63.2%.
- Average workweek decreased slightly by 0.1 hours to 34.4 hours.
Job Openings & Labor Turnover Survey – JOLTS – Released Tuesday 3/15 – The number of job openings saw a slight increase to 7.6 million on the last business day of January, the U.S. Bureau of Labor Statistics reported. Over the month, hires were little changed at 5.8 million, quits increased slightly to 3.5 million, and total separations were little changed at 5.6 million. Within separations, the quits rate and the layoffs and discharges rates were unchanged at 2.3 percent and 1.1 percent, respectively
Employment Cost Index – Released 1/31/19 – Compensation costs for civilian workers increased by 2.9% for the 12-month period ending in December 2018 compared with a compensation costs increase of 2.6% in December 2017. Wages and salaries were up 3.1%, versus 2.5% for the 12-month period ending December 2017. Benefit costs increased by 2.8%, versus 2.5% in December 2017. For private industry workers, compensation costs increased 3.0% year-over-year, versus 2.6% for the 12 months ending December 2017. Wages and salaries increased 3.1% year-over-year, versus 2.8% for the 12 months ending December 2017. Benefit costs increased by 2.6%, versus 2.3% for the 12 months ending December 2017. This report is published quarterly.
This Week’s Economic Data
Links take you to the data source
Personal Income – Released 3/29 – Personal Income increased 0.2% in February after seeing a 0.1% decline in January according to the BEA. The majority of the increase in February was due to increases in wages and salaries, government social benefits, and proprietor’s income. The decrease in January was primarily reflected by decreases in personal dividend income, farm proprietors’ income, and personal interest income. Real PCE (the Feds preferred inflation gauge) increased by 0.1% in January. Real disposable personal income decreased by 0.2% for January.
New Residential Sales – Released 3/29 – Sales of new single-family homes increased 4.9% to 667k, seasonally adjusted, in February. The median sales price of new homes sold in February was $315.3k with an average sales price of $379.6k. At the end of February, the seasonally adjusted estimate of new homes for sale was 340k. This represents a supply of 6.1 months at the current sales rate.
Chicago PMI – Released 3/29 – Chicago PMI declined by 6 points in March falling to 58.7, down from 64.7 in February. The Prices Paid indicator experienced its biggest decline in the past 17 months hitting its lowest level since August 2017. Although the Chicago Business Barometer has remained above the 50 – neutral level for more than two years, survey evidence suggests a slight slowdown since last year.
3rd Estimate of 4th Quarter GDP – Released 3/28 – According to the third estimate released by the Bureau of Economic Analysis, Real Gross Domestic Product (Real GDP) increased at an annual rate of 2.2% in the fourth quarter of 2018. The first estimate had suggested an annual rate of 2.6%. The general view of economic growth remains the same. The increase in real GDP reflected positive contributions from personal consumption expenditures, nonresidential fixed investment, and state and local gov’t spending. Negative contributions included imports which increased in the fourth quarter. Both nonresidential fixed investment and imports were revised down.
U.S. Trade Balance – Released 3/27 – The U.S. Trade deficit was $51.1 billion in January, down $8.8 billion from $59.9 billion in December. January exports were $207.3 billion, $1.9 billion more than December exports. January imports were $258.5 billion, $6.8 billion less than December imports. The goods and services deficit decreased $1.9 billion yearly. Exports and imports increased $6.1 billion or 3.0% and $4.1 billion or 1.6% respectively.
Consumer Confidence – Released 3/26 – The Consumer confidence index declined in March. The Index now shows a reading of 124.1 down from 131.4 in February. Expectations in recent months had declined due to financial market volatility, the government shutdown, and a poor Jobs report in February. Worries of a global economic slowdown have moderated consumer confidence. Consumer confidence levels suggest consumers still expect the economy to continue to expand as consumers continue to view both business and labor market conditions favorably. The pace of expansion of the economy is expected to moderate in 2019 however; especially as confidence softens.
Housing Starts – Released 3/26 – New home starts in February were at a seasonally adjusted rate of 1.162 million; down 8.7% January and 9.9% below last February’s rate. Building Permits were at a seasonally adjusted rate of 1.296 million, down 1.6% compared to January and down 2.0% over last year.
Recent Economic Data
Links take you to the data source
Existing Home Sales – Released 3/22 – Existing home sales dramatically increased rising 11.8% in February. Sales increased to a seasonally adjusted rate of 5.51 million. Sales are currently down 1.8% from one year ago. Housing inventory increased to 3.5 months of inventory and the existing homes for sale increased to 1.63 million. The median sales price for all types of homes was $245,500, up 3.6% year/y.
Industrial Production and Capacity Utilization – Released 3/15 – Industrial production increased slightly up 0.1% in February following a 0.4% decline in January. Manufacturing output fell by 0.4%. Capacity utilization declined 0.1% to78.2%. Utilization is 1.6% below its long-run (1972-2018) average.
U.S. Construction Spending – Released 3/13 – Construction spending increased by 1.3% in January measuring at a seasonally adjusted annual rate of $1,279.6 billion. The January figure is 0.3% above the January 2018 estimate. Private construction spending was 0.2% above the revised December estimate at $964.2 billion.
Durable Goods – Released 3/13 – New orders for manufactured durable goods increased $0.9 billion or 0.4% to $255.3 billion in January. This increase makes three consecutive months of gains. Transportation equipment, up 1.2%, drove the increase by $1.0 billion to $90.9 billion.
Producer Price Index – Released 3/13 – The Producer Price Index for final demand increased 0.1% in February. Core PPI (less food and energy) increased by 0.1%. Year over year the index for final demand rose 1.9%.
Consumer Price Index – Released 3/12 – The Consumer Price Index increased by 0.2 percent in February. Core CPI, which excludes food and energy increased 0.1%. The monthly changes left total CPI up 1.5% year-over-year and core CPI up 2.1%.
Retail Sales – Released 3/11 – U.S. retail sales for January 2019, were $504.4 billion, an increase of 0.2% from the previous month and 2.3% above January 2018.
Consumer Credit – Released 3/7 – Consumer credit increased at a seasonally adjusted annual rate of 5.0% in January. Revolving and nonrevolving credit increased by 3.0% and 6.0% respectively.
PMI Non-Manufacturing Index (ISM Services) – Released 3/5 – Economic activity in the non-manufacturing sector grew in February for the 109th consecutive month. ISM Non-Manufacturing registered 59.7 percent, which is 3 percentage points higher than the January reading of 56.7 percent. This represents continued growth in the non-manufacturing sector, at a faster rate.
US Light Vehicle Sales – Released 3/4 – U.S. light vehicle sales were at a seasonally adjusted annual rate (SAAR) of 17.09 million units in February versus a SAAR of 17.21 million units in January. The February run rate was down 1.7% from the SAAR of 17.39 million units for February 2018.
PMI Manufacturing ISM Index – Released 3/1 – February PMI decreased 2.4% to 54.2% from January’s reading of 56.6%. The New Orders Index was down 2.7% from the January reading of 58.2% to 55.5% for February. The Production Index registered 54.8% down 5.7%.
Next week we get data on the PMI Manufacturing ISM index, ISM Services, Retail Sales, U.S. Construction Spending, U.S. Light Vehicle Sales, and the March Jobs Report.
Data Sources:
Bureau of Economic Analysis (BEA)
Congressional Budget Office (CBO)
U.S. Bureau of Labor Statistics (BLS)
Federal Reserve Economic Data (FRED Charts)
CME Fed Watch
U.S. Treasury – Yields
U.S. Census Bureau
Institute for Supply Management (ISM)
Weekly DOL Employment Data
BLS Monthly Jobs Report
JOLTS
US Energy Admin (EIA)
BLS Consumer Price Index CPI
BLS Producer Price Index PPI
Atlanta Fed GDPNOW
NY Fed Nowcast GDP
US Census Bureau Housing Starts
Consumer Credit
USCB Retail Sales
Construction Spending
Federal Reserve Dot Plots
NY Empire Index
Philadelphia Federal Reserve
P/E Ratio Data -Yardeni Research
Technical Analysis Info:
StockCharts.com – Financial Charts
Exponential vs Simple moving average
Other Links:
1973 Arab Oil Embargo
Hunt Brothers Silver
Long-Term Capital bailout


Week 13 Talking Points #11
Ahead this week, US China trade talks continue as Beijing’s top trade negotiator travels to Washington for more discussions. Expect more volatility in the British Pound £ as the UK Parliament fights off a no-deal Brexit. On the data front, this coming week is full of releases, housing starts, trade balance, new home sales, personal spending and of course the Big one: non-farm payrolls come out Friday.
The ten-year yield, minus the two year is still positive but the one, two and six months rates are currently above the ten year.
Table of Contents
Fixed Income
FOMC January Statement Federal Reserve Dot Plots Dec 18 US Debt Measurement– January Meeting Minutes US Corporate Debt Tops $6 Trillion. Treasury.gov yields
Global Bond Yields
The Federal Reserve decreased their total holdings by 10.8% over the last year. $4.435 Trillion to $3.956 Trillion.
https://fred.stlouisfed.org/graph/?g=n9BM
Foreign Exchange Market
The USD weakened slightly but has been gaining strength despite concerns over the US economy.
Energy Complex
The Baker Hughes rig count declined by 10 this week. There are 1006 oil and gas rigs operating in the US – Up 13 over last year.
Metals Complex
Gold back under $1300/oz. again.
Employment Picture
Weekly Unemployment Claims – Released Thursday 3/28 – In the week ending March 23rd, initial claims were 211,000 a decrease of 5,000 from the previous week’s revised level. The 4-week moving average was 217,250, a decrease of 3,250 from the previous week’s revised average.
February Jobs Report – BLS Summary – Released 3/8 – The US Economy added 20k nonfarm jobs in February and the Unemployment rate declined to 3.8%. February’s 20k increase in nonfarm jobs is a little change, given the job growth has averaged 235k over the prior 12 months. The January report was revised up 7k. Average hourly earnings increased by 11 cents. Hiring highlights include Professional and Business services +42k, Health Care +21k, Wholesale trade +11k, Construction -31k, and Retail Trade -6k.
Job Openings & Labor Turnover Survey – JOLTS – Released Tuesday 3/15 – The number of job openings saw a slight increase to 7.6 million on the last business day of January, the U.S. Bureau of Labor Statistics reported. Over the month, hires were little changed at 5.8 million, quits increased slightly to 3.5 million, and total separations were little changed at 5.6 million. Within separations, the quits rate and the layoffs and discharges rates were unchanged at 2.3 percent and 1.1 percent, respectively
Employment Cost Index – Released 1/31/19 – Compensation costs for civilian workers increased by 2.9% for the 12-month period ending in December 2018 compared with a compensation costs increase of 2.6% in December 2017. Wages and salaries were up 3.1%, versus 2.5% for the 12-month period ending December 2017. Benefit costs increased by 2.8%, versus 2.5% in December 2017. For private industry workers, compensation costs increased 3.0% year-over-year, versus 2.6% for the 12 months ending December 2017. Wages and salaries increased 3.1% year-over-year, versus 2.8% for the 12 months ending December 2017. Benefit costs increased by 2.6%, versus 2.3% for the 12 months ending December 2017. This report is published quarterly.
This Week’s Economic Data
Links take you to the data source
Personal Income – Released 3/29 – Personal Income increased 0.2% in February after seeing a 0.1% decline in January according to the BEA. The majority of the increase in February was due to increases in wages and salaries, government social benefits, and proprietor’s income. The decrease in January was primarily reflected by decreases in personal dividend income, farm proprietors’ income, and personal interest income. Real PCE (the Feds preferred inflation gauge) increased by 0.1% in January. Real disposable personal income decreased by 0.2% for January.
New Residential Sales – Released 3/29 – Sales of new single-family homes increased 4.9% to 667k, seasonally adjusted, in February. The median sales price of new homes sold in February was $315.3k with an average sales price of $379.6k. At the end of February, the seasonally adjusted estimate of new homes for sale was 340k. This represents a supply of 6.1 months at the current sales rate.
Chicago PMI – Released 3/29 – Chicago PMI declined by 6 points in March falling to 58.7, down from 64.7 in February. The Prices Paid indicator experienced its biggest decline in the past 17 months hitting its lowest level since August 2017. Although the Chicago Business Barometer has remained above the 50 – neutral level for more than two years, survey evidence suggests a slight slowdown since last year.
3rd Estimate of 4th Quarter GDP – Released 3/28 – According to the third estimate released by the Bureau of Economic Analysis, Real Gross Domestic Product (Real GDP) increased at an annual rate of 2.2% in the fourth quarter of 2018. The first estimate had suggested an annual rate of 2.6%. The general view of economic growth remains the same. The increase in real GDP reflected positive contributions from personal consumption expenditures, nonresidential fixed investment, and state and local gov’t spending. Negative contributions included imports which increased in the fourth quarter. Both nonresidential fixed investment and imports were revised down.
U.S. Trade Balance – Released 3/27 – The U.S. Trade deficit was $51.1 billion in January, down $8.8 billion from $59.9 billion in December. January exports were $207.3 billion, $1.9 billion more than December exports. January imports were $258.5 billion, $6.8 billion less than December imports. The goods and services deficit decreased $1.9 billion yearly. Exports and imports increased $6.1 billion or 3.0% and $4.1 billion or 1.6% respectively.
Consumer Confidence – Released 3/26 – The Consumer confidence index declined in March. The Index now shows a reading of 124.1 down from 131.4 in February. Expectations in recent months had declined due to financial market volatility, the government shutdown, and a poor Jobs report in February. Worries of a global economic slowdown have moderated consumer confidence. Consumer confidence levels suggest consumers still expect the economy to continue to expand as consumers continue to view both business and labor market conditions favorably. The pace of expansion of the economy is expected to moderate in 2019 however; especially as confidence softens.
Housing Starts – Released 3/26 – New home starts in February were at a seasonally adjusted rate of 1.162 million; down 8.7% January and 9.9% below last February’s rate. Building Permits were at a seasonally adjusted rate of 1.296 million, down 1.6% compared to January and down 2.0% over last year.
Recent Economic Data
Links take you to the data source
Existing Home Sales – Released 3/22 – Existing home sales dramatically increased rising 11.8% in February. Sales increased to a seasonally adjusted rate of 5.51 million. Sales are currently down 1.8% from one year ago. Housing inventory increased to 3.5 months of inventory and the existing homes for sale increased to 1.63 million. The median sales price for all types of homes was $245,500, up 3.6% year/y.
Industrial Production and Capacity Utilization – Released 3/15 – Industrial production increased slightly up 0.1% in February following a 0.4% decline in January. Manufacturing output fell by 0.4%. Capacity utilization declined 0.1% to78.2%. Utilization is 1.6% below its long-run (1972-2018) average.
U.S. Construction Spending – Released 3/13 – Construction spending increased by 1.3% in January measuring at a seasonally adjusted annual rate of $1,279.6 billion. The January figure is 0.3% above the January 2018 estimate. Private construction spending was 0.2% above the revised December estimate at $964.2 billion.
Durable Goods – Released 3/13 – New orders for manufactured durable goods increased $0.9 billion or 0.4% to $255.3 billion in January. This increase makes three consecutive months of gains. Transportation equipment, up 1.2%, drove the increase by $1.0 billion to $90.9 billion.
Producer Price Index – Released 3/13 – The Producer Price Index for final demand increased 0.1% in February. Core PPI (less food and energy) increased by 0.1%. Year over year the index for final demand rose 1.9%.
Consumer Price Index – Released 3/12 – The Consumer Price Index increased by 0.2 percent in February. Core CPI, which excludes food and energy increased 0.1%. The monthly changes left total CPI up 1.5% year-over-year and core CPI up 2.1%.
Retail Sales – Released 3/11 – U.S. retail sales for January 2019, were $504.4 billion, an increase of 0.2% from the previous month and 2.3% above January 2018.
Consumer Credit – Released 3/7 – Consumer credit increased at a seasonally adjusted annual rate of 5.0% in January. Revolving and nonrevolving credit increased by 3.0% and 6.0% respectively.
PMI Non-Manufacturing Index (ISM Services) – Released 3/5 – Economic activity in the non-manufacturing sector grew in February for the 109th consecutive month. ISM Non-Manufacturing registered 59.7 percent, which is 3 percentage points higher than the January reading of 56.7 percent. This represents continued growth in the non-manufacturing sector, at a faster rate.
US Light Vehicle Sales – Released 3/4 – U.S. light vehicle sales were at a seasonally adjusted annual rate (SAAR) of 17.09 million units in February versus a SAAR of 17.21 million units in January. The February run rate was down 1.7% from the SAAR of 17.39 million units for February 2018.
PMI Manufacturing ISM Index – Released 3/1 – February PMI decreased 2.4% to 54.2% from January’s reading of 56.6%. The New Orders Index was down 2.7% from the January reading of 58.2% to 55.5% for February. The Production Index registered 54.8% down 5.7%.
Next week we get data on the PMI Manufacturing ISM index, ISM Services, Retail Sales, U.S. Construction Spending, U.S. Light Vehicle Sales, and the March Jobs Report.
Data Sources:
Bureau of Economic Analysis (BEA)
Congressional Budget Office (CBO)
U.S. Bureau of Labor Statistics (BLS)
Federal Reserve Economic Data (FRED Charts)
CME Fed Watch
U.S. Treasury – Yields
U.S. Census Bureau
Institute for Supply Management (ISM)
Weekly DOL Employment Data
BLS Monthly Jobs Report
JOLTS
US Energy Admin (EIA)
BLS Consumer Price Index CPI
BLS Producer Price Index PPI
Atlanta Fed GDPNOW
NY Fed Nowcast GDP
US Census Bureau Housing Starts
Consumer Credit
USCB Retail Sales
Construction Spending
Federal Reserve Dot Plots
NY Empire Index
Philadelphia Federal Reserve
P/E Ratio Data -Yardeni Research
Technical Analysis Info:
StockCharts.com – Financial Charts
Exponential vs Simple moving average
Other Links:
1973 Arab Oil Embargo
Hunt Brothers Silver
Long-Term Capital bailout
Categories:
Tags: