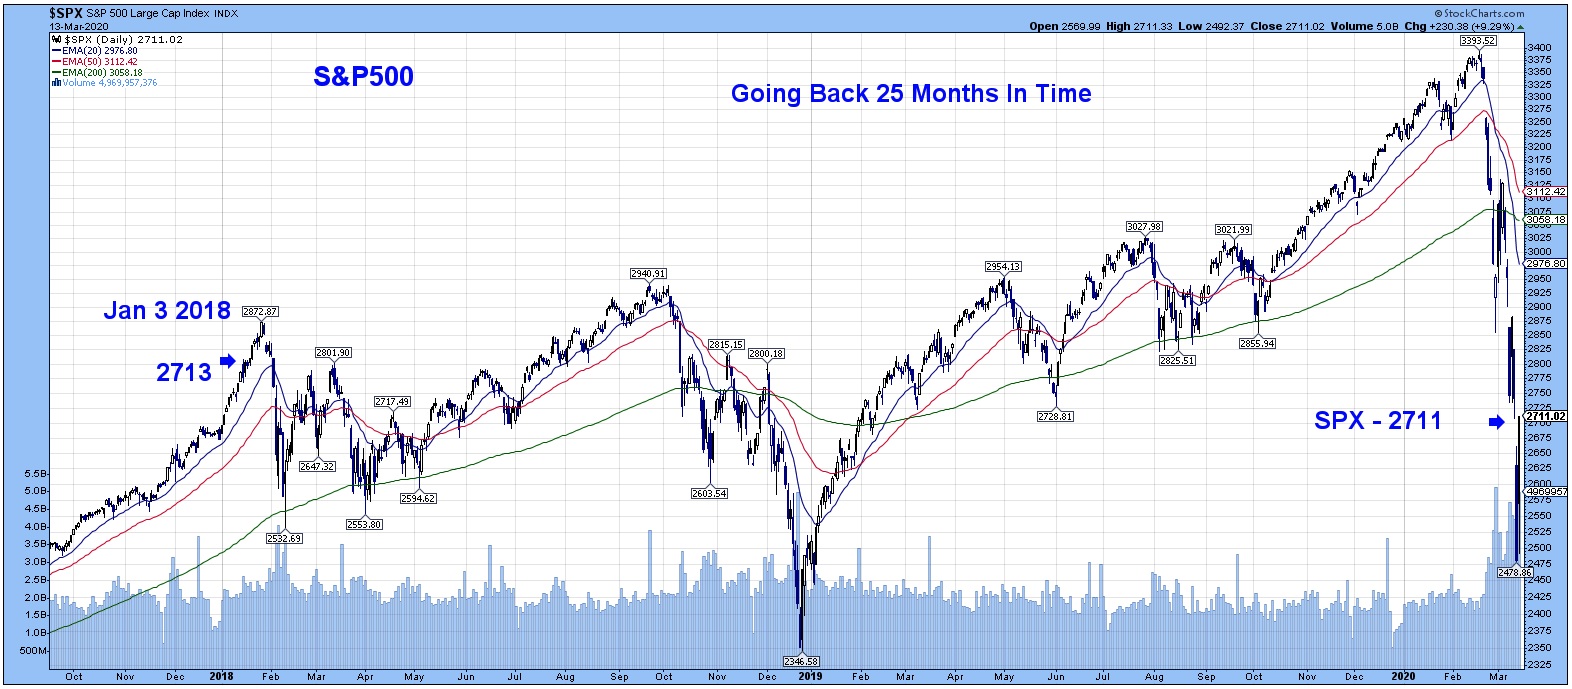
17 Trading Days from All-Time Highs to Panic Lows
The turning point is happening. We are moving our self into a recession, intentionally, to prevent a worse outcome. That’s what happening right now. As I type this, schools in Pennsylvania and 18 other states are shut down for at least two weeks. Most events are being canceled and the CDC issued guidelines to halt any gathering with more than 50 people. The Fed announced a sweeping plan intended to curb the Coronavirus fallout. They rolled out a set of programs that includes plans to buy huge amounts of government and mortgage-backed debt. They also effectively brought interest rates to zero yesterday.
John Hopkins Virus Tracker Fed Statement from Sunday 3.15
What just happened? The Efficient Market happened. In a matter of weeks, the market determined that COVID-19 would shut down the worldwide retail economy. The markets grasped the information before the public did. What we just witnessed was the scope of knowledge being digested. A very startled public, coming to grips with what is unprecedented – a non-war time quarantine possibly throughout the US. Retails sales will be decimated in the US, Europe, China, Japan, and most of the world. We witnessed a total collapse of oil prices this week that certainly isn’t helping. And everything is being priced in to the market.
Where do we go from here? After the shutdowns are over do you think we go back to where we were last week, as far as behavior? Do we go back to normal?
What changes? The healthcare system? International travel? Cultural changes? Shaking hands, mask-wearing.
“P” falling faster than “E”
Less than a month ago, the S&P 500 was trading at 19.1x forward twelve-month earnings. As of Fridays close, it was trading at 14.5x forward twelve-month earnings, which is a slight discount to the 10-yr average of 15.0x, according to FactSet.
That’s a better entry point for long-term investors, but it’s a valuation that can’t be taken at face value because it does not incorporate the sharp cut to earnings estimates that seems inevitable.

Fixed Income
3/15/2020 Statement
FOMC December Statement Federal Reserve Dot Plots US Debt Measurement US Corporate Debt Tops $6 Trillion Treasury.gov yields
FOMC Policy Normalization Statement
Global Bond Yields
Daily US Treasury Yields
Foreign Exchange Market
Energy Complex
The Baker Hughes rig count was down 1 this week. There are 792 oil and gas rigs operating in the US – down 234 over last year.
- Brent Crude Oil lost 21.71% this week closing at $35.44/bbl
- WTI Crude Oil lost 23.13% this week to close at $31.73/bbl
- Heating Oil lost 17.89% this week closing at $1.14/gallon
- Natural Gas gained 9.43% this week closing at $1.87 per million BTUs
- Unleaded Gas lost 35.26% this week closing at $0.90/gallon
Metals Complex
- Gold lost 9.31% this week closing at $1516.70/oz
- Silver lost 16.01% on the week closing at $14.50/oz
- Palladium lost 38.13% this week closing at $1509.10/oz
- Platinum lost 17.01% this week closing at $743.90/oz
- Copper lost 3.77% this week closing at $2.46/lb
Employment Picture
Weekly Unemployment Claims – Released Thursday 3/12/2020 – In the week ending March 7th, initial claims were 211,000, a decrease of 4,000 from the previous week’s revised level. The 4-week moving average was 214,000, an increase of 1,250 from the previous week’s revised average.
February Jobs Report – BLS Summary – Released 3/6/2020 – The US Economy added 273k nonfarm jobs in February and the Unemployment rate was little changed at 3.5%. Average hourly earnings increased by 9 cents. Hiring highlights include Education and Health Services +54k, Construction +42k, Government +44k, and Leisure and Hospitality +51k.
- Average hourly earnings increased by 9 cents in February, y/y hourly earnings are up 3.0%.
- U3 unemployment rate was little changed at 3.5%. U6 unemployment rate increased 0.1% to 7.0%.
- The labor force participation rate was unchanged in February at 63.4%.
- Average workweek increased by 0.1 hour to 34.4 hours.
Job Openings & Labor Turnover Survey JOLTS – Released 2/11/2020 – The U.S. Bureau of Labor Statistics reported the number of job openings declined from 6.8 million to 6.4 million on the last business day of December. Over the month, hires and separations were little changed at 5.9 million and 5.7 million, respectively. Within separations, the quits rate was unchanged at 2.3%. The layoffs and discharges rates was little changed at 1.2%.
Employment Cost Index – Released 1/31/2020 – Compensation costs for civilian workers increased 0.7% for the 3-month period ending in December 2019. The 12 month period ending on December 2019 saw compensation costs increase by 2.7%, 0.2% less than the 12 month period ending December 2018. Wages and salaries were up 2.9% for the 12-month period ending December 2019 compared to 3.1% for the 12 month period ending December 2018. Benefit costs increased 2.2% for the 12-month period ending December 2019. For private industry workers, compensation costs increased 2.7% year-over-year, versus 3.0% for the 12 months ending December 2018. This report is published quarterly.
This Week’s Economic Data
Links take you to the data source
Producer Price Index – Released 3/12 – The Producer Price Index for final demand declined 0.6% in February. Core PPI was down 0.1%. Year over year the index for final demand rose 1.3%.
Consumer Price Index – Released 3/11 – The Consumer Price Index gained 0.1% in February. Core CPI, which excludes food and energy increased 0.2%. The monthly changes left total CPI up 2.3% year-over-year and core CPI up 2.4%.
Recent Economic Data
Links take you to the data source
Consumer Credit – Released 3/6 – Consumer credit increased at a seasonally adjusted annual rate of 3.50% in January. Revolving and nonrevolving credit increased at annual rates of 3.25% and increased 5.75% respectively. Total Outstanding consumer credit is currently at $4.2027 trillion.
U.S. Trade Balance – Released 3/6 – According to the U.S. Census Bureau of Economic Analysis, the goods and services deficit declined in January to $45.3 billion. This increase is $3.3 billion lower than the deficit recorded in December. January exports were $208.6 billion, $0.9 billion less than December exports. January imports were $253.9 billion, $4.2 billion less than December imports. The goods and services deficit increased $8.5 billion or 15.8% year/y. Year – over – year exports and imports increased $2.3 billion or 1.1% and decreased $6.2 billion or 2.4% respectively.
PMI Non-Manufacturing Index (ISM Services) – Released 3/4 – Economic activity in the non-manufacturing sector grew in February for the 121st consecutive month. ISM Non-Manufacturing registered 57.3 percent, which is 1.8 percentage points above the adjusted January reading of 55.5 percent. This represents continued growth in the non-manufacturing sector, at a faster rate.
PMI Manufacturing ISM Index – Released 3/2 – February PMI declined 0.8% to 50.1% from January’s reading of 50.9%. The New Orders Index was down 2.2% from January’s reading of 52.0% to 49.8%. The Production Index registered 50.3%, down 4.0%.
U.S. Construction Spending – Released 3/2 – Construction spending increased 1.8% in January measuring at a seasonally adjusted annual rate of $1,369.2 billion. The January figure is 6.8% above the January 2019 estimate. Private construction spending was 1.5% above the revised December estimate at $1,007.6 billion. Public construction spending was 2.6% above the revised December estimate at $337.8 billion.
Chicago PMI – Released 2/28 – Chicago PMI increased 6.1 points increasing to 49.0, up from 42.9 in January. This marks the highest reading since August 2019. The index is up three of the last four months yet the index is still in contractionary territory and has been for six consecutive months. Production and Supplier Deliveries showed the greatest gains and Employment was the only indicator to decline in February.
Personal Income – Released 2/28 – Personal Income increased 0.6% in January according to the BEA. The majority of the increase in January was due to increases in compensation of employees and social security benefit payments, and other government social benefits to persons. Real PCE (the Feds preferred inflation gauge) increased 0.1% in January. Real disposable personal income increased 0.5% in January.
US Light Vehicle Sales – Released 2/28 – U.S. light vehicle sales were at a seasonally adjusted annual rate (SAAR) of 16.81 million units in January.
Second Estimate of 4th Quarter and Year 2019 GDP – Released 2/27 – According to the Advance Estimate released by the Bureau of Economic Analysis, Real Gross Domestic Product (Real GDP) increased at an annual rate of 2.1% in the fourth quarter of 2019. The advance estimate is based on data that are more complete than were available for the advance estimate. The second estimate saw an upward revision to private inventory investment that was offset by a downward revision to nonresidential fixed investment. The fourth quarter increase in real GDP observed positive contributions from personal consumption expenditures (PCE), federal gov’t spending, state and local gov’t spending, residential fixed investment, and exports that were partly offset by negative contributions from private inventory investment, nonresidential fixed investment, and imports (which decreased). The Third Estimate of fourth quarter GDP growth, which is based on more complete data, will be released on March 26, 2020.
Durable Goods – Released 2/27 – New orders for manufactured durable goods decreased $0.4 billion or 0.2% to $246.2 billion in January. The decrease in January follows a 2.9% increase in December. Transportation equipment drove the decrease; down $1.8 billion or 2.2%.
New Residential Sales – Released 2/26 – Sales of new single-family homes increased 7.9% to 764k, seasonally adjusted, in January. The median sales price of new homes sold in January was $348.2k with an average sales price of $402.3k. At the end of January, the seasonally adjusted estimate of new homes for sale was 324k. This represents a supply of 5.1 months at the current sales rate.
Consumer Confidence – Released 2/25 – The Consumer confidence index increased slightly in February following an increase in January. The Index now shows a reading of 130.7 which is up from 130.4 in January. Consumers continue to view current conditions favorably.
Existing Home Sales – Released 2/21 – Existing home sales decreased in January. Sales decreased 1.3% to a seasonally adjusted rate of 5.46 million. Sales are currently up 9.6% from one year ago. Housing inventory increased from 3.0 months of inventory to 3.1 months of unsold inventory and the total housing inventory increased from 1.40 million to 1.42 million. The median sales price for all types of homes was $266,300, up 6.8% year/y.
Housing Starts – Released 2/19 – New home starts in January were at a seasonally adjusted annual rate of 1.567 million; down 3.6% below December but 21.4% above last January’s rate. Building Permits were at a seasonally adjusted annual rate of 1.551 million, up 9.2% compared to December and up 17.9% over last year.
Industrial Production and Capacity Utilization – Released 2/14 – In January Industrial production declined 0.3%. Unseasonably warm weather resulted in a lower output from utilities. Manufacturing declined 0.1% and mining was up 1.2%. Industrial production was 0.8% lower year/y. Total capacity utilization declined 0.3% to 76.8% in January which is 3.0% below its long run average.
Retail Sales – Released 2/14 – U.S. retail sales for January increased 0.3% to $529.8 billion. U.S. retail sales are up 4.4% year/y.
Next week we get data on Retail Sales, Industrial Production and Capacity Utilization, Housing Starts, Existing Home Sales, and JOLTS.
Data Sources:
Bureau of Economic Analysis (BEA)
Congressional Budget Office (CBO)
U.S. Bureau of Labor Statistics (BLS)
Federal Reserve Economic Data (FRED Charts)
CME Fed Watch
U.S. Treasury – Yields
U.S. Census Bureau
Institute for Supply Management (ISM)
Weekly DOL Employment Data
BLS Monthly Jobs Report
JOLTS
US Energy Admin (EIA)
BLS Consumer Price Index CPI
BLS Producer Price Index PPI
Atlanta Fed GDPNOW
NY Fed Nowcast GDP
US Census Bureau Housing Starts
Consumer Credit
USCB Retail Sales
Construction Spending
Federal Reserve Dot Plots
NY Empire Index
Philadelphia Federal Reserve
P/E Ratio Data -Yardeni Research
Technical Analysis Info:
StockCharts.com – Financial Charts
Exponential vs Simple moving average
Other Links:
1973 Arab Oil Embargo
Hunt Brothers Silver
Long-Term Capital bailout


Week 11 Talking Points
17 Trading Days from All-Time Highs to Panic Lows
The turning point is happening. We are moving our self into a recession, intentionally, to prevent a worse outcome. That’s what happening right now. As I type this, schools in Pennsylvania and 18 other states are shut down for at least two weeks. Most events are being canceled and the CDC issued guidelines to halt any gathering with more than 50 people. The Fed announced a sweeping plan intended to curb the Coronavirus fallout. They rolled out a set of programs that includes plans to buy huge amounts of government and mortgage-backed debt. They also effectively brought interest rates to zero yesterday.
John Hopkins Virus Tracker Fed Statement from Sunday 3.15
What just happened? The Efficient Market happened. In a matter of weeks, the market determined that COVID-19 would shut down the worldwide retail economy. The markets grasped the information before the public did. What we just witnessed was the scope of knowledge being digested. A very startled public, coming to grips with what is unprecedented – a non-war time quarantine possibly throughout the US. Retails sales will be decimated in the US, Europe, China, Japan, and most of the world. We witnessed a total collapse of oil prices this week that certainly isn’t helping. And everything is being priced in to the market.
Where do we go from here? After the shutdowns are over do you think we go back to where we were last week, as far as behavior? Do we go back to normal?
What changes? The healthcare system? International travel? Cultural changes? Shaking hands, mask-wearing.
“P” falling faster than “E”
Less than a month ago, the S&P 500 was trading at 19.1x forward twelve-month earnings. As of Fridays close, it was trading at 14.5x forward twelve-month earnings, which is a slight discount to the 10-yr average of 15.0x, according to FactSet.
That’s a better entry point for long-term investors, but it’s a valuation that can’t be taken at face value because it does not incorporate the sharp cut to earnings estimates that seems inevitable.
Table of Contents
Fixed Income
3/15/2020 Statement
FOMC December Statement Federal Reserve Dot Plots US Debt Measurement US Corporate Debt Tops $6 Trillion Treasury.gov yields
FOMC Policy Normalization Statement
Global Bond Yields
Daily US Treasury Yields
Foreign Exchange Market
Energy Complex
The Baker Hughes rig count was down 1 this week. There are 792 oil and gas rigs operating in the US – down 234 over last year.
Metals Complex
Employment Picture
Weekly Unemployment Claims – Released Thursday 3/12/2020 – In the week ending March 7th, initial claims were 211,000, a decrease of 4,000 from the previous week’s revised level. The 4-week moving average was 214,000, an increase of 1,250 from the previous week’s revised average.
February Jobs Report – BLS Summary – Released 3/6/2020 – The US Economy added 273k nonfarm jobs in February and the Unemployment rate was little changed at 3.5%. Average hourly earnings increased by 9 cents. Hiring highlights include Education and Health Services +54k, Construction +42k, Government +44k, and Leisure and Hospitality +51k.
Job Openings & Labor Turnover Survey JOLTS – Released 2/11/2020 – The U.S. Bureau of Labor Statistics reported the number of job openings declined from 6.8 million to 6.4 million on the last business day of December. Over the month, hires and separations were little changed at 5.9 million and 5.7 million, respectively. Within separations, the quits rate was unchanged at 2.3%. The layoffs and discharges rates was little changed at 1.2%.
Employment Cost Index – Released 1/31/2020 – Compensation costs for civilian workers increased 0.7% for the 3-month period ending in December 2019. The 12 month period ending on December 2019 saw compensation costs increase by 2.7%, 0.2% less than the 12 month period ending December 2018. Wages and salaries were up 2.9% for the 12-month period ending December 2019 compared to 3.1% for the 12 month period ending December 2018. Benefit costs increased 2.2% for the 12-month period ending December 2019. For private industry workers, compensation costs increased 2.7% year-over-year, versus 3.0% for the 12 months ending December 2018. This report is published quarterly.
This Week’s Economic Data
Links take you to the data source
Producer Price Index – Released 3/12 – The Producer Price Index for final demand declined 0.6% in February. Core PPI was down 0.1%. Year over year the index for final demand rose 1.3%.
Consumer Price Index – Released 3/11 – The Consumer Price Index gained 0.1% in February. Core CPI, which excludes food and energy increased 0.2%. The monthly changes left total CPI up 2.3% year-over-year and core CPI up 2.4%.
Recent Economic Data
Links take you to the data source
Consumer Credit – Released 3/6 – Consumer credit increased at a seasonally adjusted annual rate of 3.50% in January. Revolving and nonrevolving credit increased at annual rates of 3.25% and increased 5.75% respectively. Total Outstanding consumer credit is currently at $4.2027 trillion.
U.S. Trade Balance – Released 3/6 – According to the U.S. Census Bureau of Economic Analysis, the goods and services deficit declined in January to $45.3 billion. This increase is $3.3 billion lower than the deficit recorded in December. January exports were $208.6 billion, $0.9 billion less than December exports. January imports were $253.9 billion, $4.2 billion less than December imports. The goods and services deficit increased $8.5 billion or 15.8% year/y. Year – over – year exports and imports increased $2.3 billion or 1.1% and decreased $6.2 billion or 2.4% respectively.
PMI Non-Manufacturing Index (ISM Services) – Released 3/4 – Economic activity in the non-manufacturing sector grew in February for the 121st consecutive month. ISM Non-Manufacturing registered 57.3 percent, which is 1.8 percentage points above the adjusted January reading of 55.5 percent. This represents continued growth in the non-manufacturing sector, at a faster rate.
PMI Manufacturing ISM Index – Released 3/2 – February PMI declined 0.8% to 50.1% from January’s reading of 50.9%. The New Orders Index was down 2.2% from January’s reading of 52.0% to 49.8%. The Production Index registered 50.3%, down 4.0%.
U.S. Construction Spending – Released 3/2 – Construction spending increased 1.8% in January measuring at a seasonally adjusted annual rate of $1,369.2 billion. The January figure is 6.8% above the January 2019 estimate. Private construction spending was 1.5% above the revised December estimate at $1,007.6 billion. Public construction spending was 2.6% above the revised December estimate at $337.8 billion.
Chicago PMI – Released 2/28 – Chicago PMI increased 6.1 points increasing to 49.0, up from 42.9 in January. This marks the highest reading since August 2019. The index is up three of the last four months yet the index is still in contractionary territory and has been for six consecutive months. Production and Supplier Deliveries showed the greatest gains and Employment was the only indicator to decline in February.
Personal Income – Released 2/28 – Personal Income increased 0.6% in January according to the BEA. The majority of the increase in January was due to increases in compensation of employees and social security benefit payments, and other government social benefits to persons. Real PCE (the Feds preferred inflation gauge) increased 0.1% in January. Real disposable personal income increased 0.5% in January.
US Light Vehicle Sales – Released 2/28 – U.S. light vehicle sales were at a seasonally adjusted annual rate (SAAR) of 16.81 million units in January.
Second Estimate of 4th Quarter and Year 2019 GDP – Released 2/27 – According to the Advance Estimate released by the Bureau of Economic Analysis, Real Gross Domestic Product (Real GDP) increased at an annual rate of 2.1% in the fourth quarter of 2019. The advance estimate is based on data that are more complete than were available for the advance estimate. The second estimate saw an upward revision to private inventory investment that was offset by a downward revision to nonresidential fixed investment. The fourth quarter increase in real GDP observed positive contributions from personal consumption expenditures (PCE), federal gov’t spending, state and local gov’t spending, residential fixed investment, and exports that were partly offset by negative contributions from private inventory investment, nonresidential fixed investment, and imports (which decreased). The Third Estimate of fourth quarter GDP growth, which is based on more complete data, will be released on March 26, 2020.
Durable Goods – Released 2/27 – New orders for manufactured durable goods decreased $0.4 billion or 0.2% to $246.2 billion in January. The decrease in January follows a 2.9% increase in December. Transportation equipment drove the decrease; down $1.8 billion or 2.2%.
New Residential Sales – Released 2/26 – Sales of new single-family homes increased 7.9% to 764k, seasonally adjusted, in January. The median sales price of new homes sold in January was $348.2k with an average sales price of $402.3k. At the end of January, the seasonally adjusted estimate of new homes for sale was 324k. This represents a supply of 5.1 months at the current sales rate.
Consumer Confidence – Released 2/25 – The Consumer confidence index increased slightly in February following an increase in January. The Index now shows a reading of 130.7 which is up from 130.4 in January. Consumers continue to view current conditions favorably.
Existing Home Sales – Released 2/21 – Existing home sales decreased in January. Sales decreased 1.3% to a seasonally adjusted rate of 5.46 million. Sales are currently up 9.6% from one year ago. Housing inventory increased from 3.0 months of inventory to 3.1 months of unsold inventory and the total housing inventory increased from 1.40 million to 1.42 million. The median sales price for all types of homes was $266,300, up 6.8% year/y.
Housing Starts – Released 2/19 – New home starts in January were at a seasonally adjusted annual rate of 1.567 million; down 3.6% below December but 21.4% above last January’s rate. Building Permits were at a seasonally adjusted annual rate of 1.551 million, up 9.2% compared to December and up 17.9% over last year.
Industrial Production and Capacity Utilization – Released 2/14 – In January Industrial production declined 0.3%. Unseasonably warm weather resulted in a lower output from utilities. Manufacturing declined 0.1% and mining was up 1.2%. Industrial production was 0.8% lower year/y. Total capacity utilization declined 0.3% to 76.8% in January which is 3.0% below its long run average.
Retail Sales – Released 2/14 – U.S. retail sales for January increased 0.3% to $529.8 billion. U.S. retail sales are up 4.4% year/y.
Next week we get data on Retail Sales, Industrial Production and Capacity Utilization, Housing Starts, Existing Home Sales, and JOLTS.
Data Sources:
Bureau of Economic Analysis (BEA)
Congressional Budget Office (CBO)
U.S. Bureau of Labor Statistics (BLS)
Federal Reserve Economic Data (FRED Charts)
CME Fed Watch
U.S. Treasury – Yields
U.S. Census Bureau
Institute for Supply Management (ISM)
Weekly DOL Employment Data
BLS Monthly Jobs Report
JOLTS
US Energy Admin (EIA)
BLS Consumer Price Index CPI
BLS Producer Price Index PPI
Atlanta Fed GDPNOW
NY Fed Nowcast GDP
US Census Bureau Housing Starts
Consumer Credit
USCB Retail Sales
Construction Spending
Federal Reserve Dot Plots
NY Empire Index
Philadelphia Federal Reserve
P/E Ratio Data -Yardeni Research
Technical Analysis Info:
StockCharts.com – Financial Charts
Exponential vs Simple moving average
Other Links:
1973 Arab Oil Embargo
Hunt Brothers Silver
Long-Term Capital bailout
Categories:
Tags: