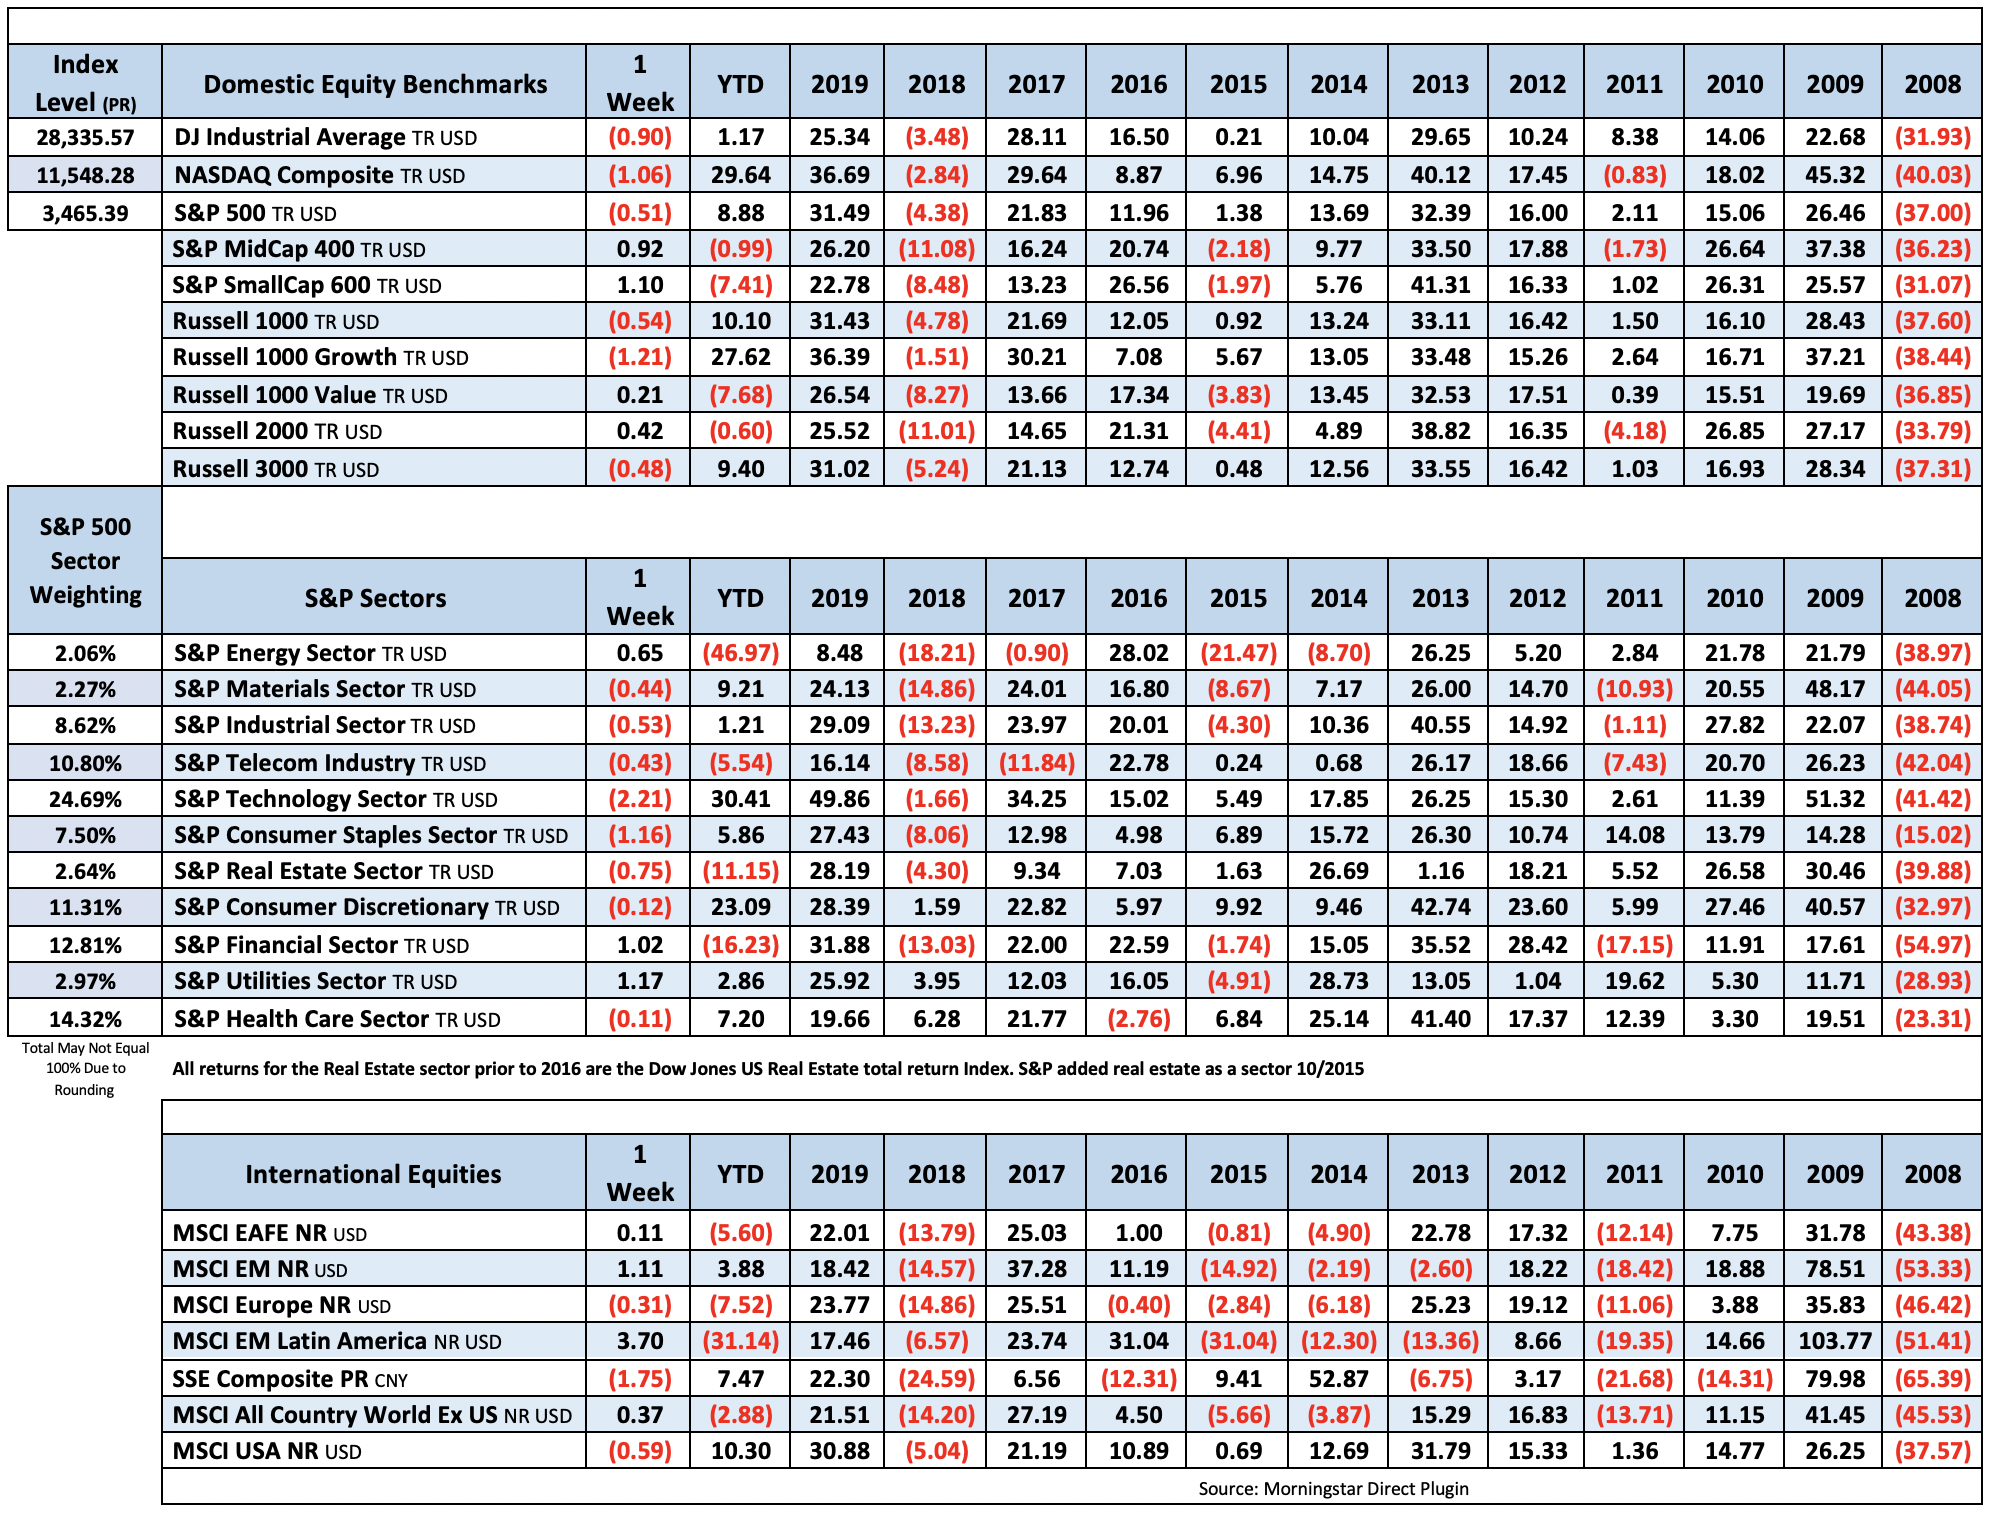
Technology weighed on the major indices this week with the Nasdaq falling more than 1% and the S&P 500 falling 0.5%. Small and mid-caps were able to remain positive into the close, with the mid-cap 400 up 0.9% and the small-cap 600 up 1.1%. Yields were up this week with the 10 year closing at 0.85%, the highest yield since June.
.

Fixed Income
9/16 FOMC Statement Credit, Liquidity and Balance Sheet Federal Reserve Dot Plots US Debt Measurement US Corporate Debt Almost 7 Trillion Treasury.gov yields FOMC Policy Normalization Statement Longer Run Goals August 2020
Global Bond Yields
Daily US Treasury Yields
Foreign Exchange Market
Energy Complex
The Baker Hughes rig count gained 5 this week. There are 287 oil and gas rigs operating in the US – Down 564 over last year.
- Brent Crude Oil lost 2.00% this week closing at $42.07/bbl
- WTI Crude Oil lost 3.09% this week to close at $39.85/bbl
- Heating Oil declined 1.76% this week closing at $1.16/gallon
- Natural Gas gained 15.22% this week closing at $3.19 per million BTUs
- Unleaded Gas declined 2.30% this week closing at $1.13/gallon
Metals Complex
- Gold declined 0.06% this week closing at $1905.20oz
- Silver gained 1.11% on the week closing at $24.67/oz
- Palladium gained 2.40% this week closing at $2398.60/oz
- Platinum gained 4.30% this week closing at $906.70/oz
- Copper gained 2.00% this week closing at $3.13/lb
Employment Picture
Weekly Unemployment Claims – Released Thursday 10/22/2020 – Initial jobless claims for the week ending October 17th decreased 55k to 787k. The 4-week moving average was 811k, an decrease of 21.5k.
Job Openings & Labor Turnover Survey JOLTS – Released 10/6/2020 – The U.S. Bureau of Labor Statistics reported the number and rate of job openings was little changed at 6.5 million on the last business day of August. Over the month, hires increased to 5.9 million and separations decreased to 4.6 million. Within separations, the quits rate decreased to 2.0%. The layoffs and discharges rates decreased to 1.0%.
September Jobs Report – BLS Summary – Released 10/2/2020 – The US Economy gained 661k million nonfarm jobs in September and the Unemployment rate declined to 7.9%. Average hourly earnings were steady at $29.47. Hiring highlights include Leisure and Hospitality +318k, Retail Trade +142k, Professional and Business Services +89k.
- Average hourly earnings increased held steady in September at $29.47.
- U3 unemployment rate declined to 7.9%. U6 unemployment rate declined to 12.8%.
- The labor force participation rate decreased 0.3% to 61.4%.
- Average work week increased by 0.1 hours to 34.7 hours.
Employment Cost Index – Released 7/31/2020 – Compensation costs for civilian workers increased 0.5% for the 3-month period ending in June 2020. The 12 month period ending on June 2020 saw compensation costs increase by 2.7%, same as the 12 month period ending June 2019. Wages and salaries increased 2.9 percent over the year and increased 2.9 percent for the 12-month period ending in June 2019. Benefit costs increased 2.2 percent for the 12-month period ending in June 2020. In June 2019, the increase was 2.3 percent. This report is published quarterly.
This Week’s Economic Data
Links take you to the data source
Existing Home Sales – Released 10/22/2020 – Existing home sales increased in September making four consecutive months of sales gains. Sales increased 9.4% to a seasonally adjusted rate of 6.54 million in September. Sales are currently up 20.9% from one year ago. Housing inventory sits at 1.47 million units. Down 1.3% over last month. Down 19.2% over last year. Unsold inventory sits at a 2.7 month supply. The median existing home price for all housing types was $311,800.
Housing Starts – Released 10/20/2020 – New home starts in September were at a seasonally adjusted annual rate of 1.415 million; up 1.9 above August and 11.1% above last September’s rate. Building Permits were at a seasonally adjusted annual rate of 1.553 million, up 5.2% compared to August and up 8.1% over last year.
Recent Economic Data
Links take you to the data source
Retail Sales – Released 10/16/2020 – U.S. retail sales for September increased 1.9% to $549.3 billion. U.S. retail sales are up 5.4% year/y.
Industrial Production and Capacity Utilization – Released 10/16/2020 – In September Industrial production declined 0.6%. Total Industrial production is still 7.1% below its pre-pandemic February level. Manufacturing declined 0.3%. Mining production increased 1.7%. Total industrial production was 101.5% of its 2012 average which is 7.3% lower in September than a year ago. Total capacity utilization declined 0.5% to 71.5% in September which is 8.3% below its long run average.
US Light Vehicle Sales – Released 10/14/2020 – U.S. light vehicle sales were at a seasonally adjusted annual rate (SAAR) of 16.341 million units in September.
Producer Price Index – Released 10/14/2020 – The Producer Price Index for final demand increased 0.4% in September. PPI less food and energy also increased 0.4% in September.
Consumer Price Index -– Released 10/13/2020 – The Consumer Price Index increased 0.2% in September. Core CPI, which excludes food and energy also increased 0.2%. The monthly changes left total CPI up 1.4% year-over-year and core CPI up 1.7%.
Consumer Credit – Released 10/7/2020 – In August, consumer credit decreased at a seasonally adjusted rate of 2.0%. Revolving credit decreased at an annual rate of 11.25 percent, while nonrevolving credit increased at an annual rate of 0.75 percent. Total Outstanding consumer credit is currently at $4.145 trillion.
U.S. Trade Balance – Released 10/6/2020 – According to the U.S. Census Bureau of Economic Analysis, the goods and services deficit increased in August by $3.7 billion to $63.4 billion. August exports were $171.9 billion, $3.6 billion more than July exports. August imports were $239.0 billion, $7.4 billion more than July imports. The goods and services deficit increased $22.6 billion or 5.7% year-to-date, from the same period in 2019. Year – over – year exports and imports decreased $296.1 billion or 17.6% and decreased $273.5 billion or 13.1% respectively.
PMI Non-Manufacturing Index (ISM Services) – Released 10/5/2020 – Economic activity in the non-manufacturing sector grew in September for the fourth consecutive month. ISM Non-Manufacturing registered 57.8 percent, which is 0.9 percentage points above the adjusted August reading of 56.9 percent.
PMI Manufacturing ISM Index – Released 10/2/2020 – September PMI declined 0.6% to 55.4% from August’s reading of 56.0%. The New Orders Index was down 7.4% from August’s reading of 67.6% to 60.2%. The Production Index registered 61.0%, down 2.3%.
U.S. Construction Spending – Released 10/1/2020 – Construction spending increased 1.4% in August measuring at a seasonally adjusted annual rate of $1,412.8 billion. The August figure is 2.5% above the August 2019 estimate. Private construction spending was 1.9% above the revised July estimate at $1,061.4 billion. Public construction spending was 0.1% above the revised July estimate at $351.4 billion.
Personal Income – Released 10/1/2020 – Personal income decreased $543.5 billion or 2.7 percent in August according to estimates released today by the Bureau of Economic Analysis. Disposable personal income (DPI) decreased $570.9 billion or 3.2 percent and personal consumption expenditures (PCE) increased $141.1 billion or 1.0 percent.
Chicago PMI – Released 9/30/2020 – Chicago PMI increased 11.2 points climbing to 62.4. This marks three consecutive months above the 50-mark following a full year under it. It also marks the highest reading since December 2018. All five main indicators saw monthly gains in September, with Production and New Orders leading the way. On a quarterly basis, Supplier Deliveries was the only category to see a decline.
Third Estimate of 2nd Quarter 2020 GDP – Released 9/30/2020 – Real gross domestic product (GDP) decreased at an annual rate of 31.4 percent in the second quarter of 2020, according to the third estimate released by the Bureau of Economic Analysis. The decline in GDP seen in the second quarter marks the worst quarterly decline in GDP to date. This GDP estimate is based on data that are more complete than that of the data of the advance estimate and second estimate. The upward revision with the third estimate primarily reflected an upward revision to personal consumption expenditures (PCE) that was partly offset by downward revisions to exports and to nonresidential fixed investment. The decrease in real GDP reflected decreases in personal consumption expenditures (PCE), exports, private inventory investment, nonresidential fixed investment, residential fixed investment, and state and local government spending that were partly offset by an increase in federal government spending. Imports, which are a subtraction in the calculation of GDP, decreased.
Consumer Confidence – Released 9/29/2020 – The Consumer confidence index increased 15.5% in September following an decrease in August. The Index now shows a reading of 101.8, up from 86.3 in August.
Durable Goods – Released 9/25/2020 – New orders for manufactured durable goods in August increased for the fourth consecutive month up $1.0 billion or 0.4% to $232.8 billion. Machinery led the increase rising $0.5 billion or 1.5% to $31.2 billion.
New Residential Sales – Released 9/24/2020 – Sales of new single-family homes increased 4.8% to 1.011 million, seasonally adjusted, in August. The median sales price of new homes sold in August was $312,800 with an average sales price of $369,000. At the end of August the seasonally adjusted estimate of new homes for sale was 282k. This represents a supply of 3.3 months at the current sales rate.
Next week we get data on New Residential Sales, Durable Goods, Consumer Confidence, Chicago PMI, Personal Income, and the First Estimate of 3rd Quarter 2020 GDP.
Data Sources:
Bureau of Economic Analysis (BEA)
Congressional Budget Office (CBO)
U.S. Bureau of Labor Statistics (BLS)
Federal Reserve Economic Data (FRED Charts)
CME Fed Watch
U.S. Treasury – Yields
U.S. Census Bureau
Institute for Supply Management (ISM)
Weekly DOL Employment Data
BLS Monthly Jobs Report
JOLTS
US Energy Admin (EIA)
BLS Consumer Price Index CPI
BLS Producer Price Index PPI
Atlanta Fed GDPNOW
NY Fed Nowcast GDP
US Census Bureau Housing Starts
Consumer Credit
USCB Retail Sales
Construction Spending
Federal Reserve Dot Plots
NY Empire Index
Philadelphia Federal Reserve
P/E Ratio Data -Yardeni Research
Technical Analysis Info:
StockCharts.com – Financial Charts
Exponential vs Simple moving average
Other Links:
1973 Arab Oil Embargo
Hunt Brothers Silver
Long-Term Capital bailout


Week 42 Talking Points
Technology weighed on the major indices this week with the Nasdaq falling more than 1% and the S&P 500 falling 0.5%. Small and mid-caps were able to remain positive into the close, with the mid-cap 400 up 0.9% and the small-cap 600 up 1.1%. Yields were up this week with the 10 year closing at 0.85%, the highest yield since June.
.
Table of Contents
Fixed Income
9/16 FOMC Statement Credit, Liquidity and Balance Sheet Federal Reserve Dot Plots US Debt Measurement US Corporate Debt Almost 7 Trillion Treasury.gov yields FOMC Policy Normalization Statement Longer Run Goals August 2020
Global Bond Yields
Daily US Treasury Yields
Foreign Exchange Market
Energy Complex
The Baker Hughes rig count gained 5 this week. There are 287 oil and gas rigs operating in the US – Down 564 over last year.
Metals Complex
Employment Picture
Weekly Unemployment Claims – Released Thursday 10/22/2020 – Initial jobless claims for the week ending October 17th decreased 55k to 787k. The 4-week moving average was 811k, an decrease of 21.5k.
Job Openings & Labor Turnover Survey JOLTS – Released 10/6/2020 – The U.S. Bureau of Labor Statistics reported the number and rate of job openings was little changed at 6.5 million on the last business day of August. Over the month, hires increased to 5.9 million and separations decreased to 4.6 million. Within separations, the quits rate decreased to 2.0%. The layoffs and discharges rates decreased to 1.0%.
September Jobs Report – BLS Summary – Released 10/2/2020 – The US Economy gained 661k million nonfarm jobs in September and the Unemployment rate declined to 7.9%. Average hourly earnings were steady at $29.47. Hiring highlights include Leisure and Hospitality +318k, Retail Trade +142k, Professional and Business Services +89k.
Employment Cost Index – Released 7/31/2020 – Compensation costs for civilian workers increased 0.5% for the 3-month period ending in June 2020. The 12 month period ending on June 2020 saw compensation costs increase by 2.7%, same as the 12 month period ending June 2019. Wages and salaries increased 2.9 percent over the year and increased 2.9 percent for the 12-month period ending in June 2019. Benefit costs increased 2.2 percent for the 12-month period ending in June 2020. In June 2019, the increase was 2.3 percent. This report is published quarterly.
This Week’s Economic Data
Links take you to the data source
Existing Home Sales – Released 10/22/2020 – Existing home sales increased in September making four consecutive months of sales gains. Sales increased 9.4% to a seasonally adjusted rate of 6.54 million in September. Sales are currently up 20.9% from one year ago. Housing inventory sits at 1.47 million units. Down 1.3% over last month. Down 19.2% over last year. Unsold inventory sits at a 2.7 month supply. The median existing home price for all housing types was $311,800.
Housing Starts – Released 10/20/2020 – New home starts in September were at a seasonally adjusted annual rate of 1.415 million; up 1.9 above August and 11.1% above last September’s rate. Building Permits were at a seasonally adjusted annual rate of 1.553 million, up 5.2% compared to August and up 8.1% over last year.
Recent Economic Data
Links take you to the data source
Retail Sales – Released 10/16/2020 – U.S. retail sales for September increased 1.9% to $549.3 billion. U.S. retail sales are up 5.4% year/y.
Industrial Production and Capacity Utilization – Released 10/16/2020 – In September Industrial production declined 0.6%. Total Industrial production is still 7.1% below its pre-pandemic February level. Manufacturing declined 0.3%. Mining production increased 1.7%. Total industrial production was 101.5% of its 2012 average which is 7.3% lower in September than a year ago. Total capacity utilization declined 0.5% to 71.5% in September which is 8.3% below its long run average.
US Light Vehicle Sales – Released 10/14/2020 – U.S. light vehicle sales were at a seasonally adjusted annual rate (SAAR) of 16.341 million units in September.
Producer Price Index – Released 10/14/2020 – The Producer Price Index for final demand increased 0.4% in September. PPI less food and energy also increased 0.4% in September.
Consumer Price Index -– Released 10/13/2020 – The Consumer Price Index increased 0.2% in September. Core CPI, which excludes food and energy also increased 0.2%. The monthly changes left total CPI up 1.4% year-over-year and core CPI up 1.7%.
Consumer Credit – Released 10/7/2020 – In August, consumer credit decreased at a seasonally adjusted rate of 2.0%. Revolving credit decreased at an annual rate of 11.25 percent, while nonrevolving credit increased at an annual rate of 0.75 percent. Total Outstanding consumer credit is currently at $4.145 trillion.
U.S. Trade Balance – Released 10/6/2020 – According to the U.S. Census Bureau of Economic Analysis, the goods and services deficit increased in August by $3.7 billion to $63.4 billion. August exports were $171.9 billion, $3.6 billion more than July exports. August imports were $239.0 billion, $7.4 billion more than July imports. The goods and services deficit increased $22.6 billion or 5.7% year-to-date, from the same period in 2019. Year – over – year exports and imports decreased $296.1 billion or 17.6% and decreased $273.5 billion or 13.1% respectively.
PMI Non-Manufacturing Index (ISM Services) – Released 10/5/2020 – Economic activity in the non-manufacturing sector grew in September for the fourth consecutive month. ISM Non-Manufacturing registered 57.8 percent, which is 0.9 percentage points above the adjusted August reading of 56.9 percent.
PMI Manufacturing ISM Index – Released 10/2/2020 – September PMI declined 0.6% to 55.4% from August’s reading of 56.0%. The New Orders Index was down 7.4% from August’s reading of 67.6% to 60.2%. The Production Index registered 61.0%, down 2.3%.
U.S. Construction Spending – Released 10/1/2020 – Construction spending increased 1.4% in August measuring at a seasonally adjusted annual rate of $1,412.8 billion. The August figure is 2.5% above the August 2019 estimate. Private construction spending was 1.9% above the revised July estimate at $1,061.4 billion. Public construction spending was 0.1% above the revised July estimate at $351.4 billion.
Personal Income – Released 10/1/2020 – Personal income decreased $543.5 billion or 2.7 percent in August according to estimates released today by the Bureau of Economic Analysis. Disposable personal income (DPI) decreased $570.9 billion or 3.2 percent and personal consumption expenditures (PCE) increased $141.1 billion or 1.0 percent.
Chicago PMI – Released 9/30/2020 – Chicago PMI increased 11.2 points climbing to 62.4. This marks three consecutive months above the 50-mark following a full year under it. It also marks the highest reading since December 2018. All five main indicators saw monthly gains in September, with Production and New Orders leading the way. On a quarterly basis, Supplier Deliveries was the only category to see a decline.
Third Estimate of 2nd Quarter 2020 GDP – Released 9/30/2020 – Real gross domestic product (GDP) decreased at an annual rate of 31.4 percent in the second quarter of 2020, according to the third estimate released by the Bureau of Economic Analysis. The decline in GDP seen in the second quarter marks the worst quarterly decline in GDP to date. This GDP estimate is based on data that are more complete than that of the data of the advance estimate and second estimate. The upward revision with the third estimate primarily reflected an upward revision to personal consumption expenditures (PCE) that was partly offset by downward revisions to exports and to nonresidential fixed investment. The decrease in real GDP reflected decreases in personal consumption expenditures (PCE), exports, private inventory investment, nonresidential fixed investment, residential fixed investment, and state and local government spending that were partly offset by an increase in federal government spending. Imports, which are a subtraction in the calculation of GDP, decreased.
Consumer Confidence – Released 9/29/2020 – The Consumer confidence index increased 15.5% in September following an decrease in August. The Index now shows a reading of 101.8, up from 86.3 in August.
Durable Goods – Released 9/25/2020 – New orders for manufactured durable goods in August increased for the fourth consecutive month up $1.0 billion or 0.4% to $232.8 billion. Machinery led the increase rising $0.5 billion or 1.5% to $31.2 billion.
New Residential Sales – Released 9/24/2020 – Sales of new single-family homes increased 4.8% to 1.011 million, seasonally adjusted, in August. The median sales price of new homes sold in August was $312,800 with an average sales price of $369,000. At the end of August the seasonally adjusted estimate of new homes for sale was 282k. This represents a supply of 3.3 months at the current sales rate.
Next week we get data on New Residential Sales, Durable Goods, Consumer Confidence, Chicago PMI, Personal Income, and the First Estimate of 3rd Quarter 2020 GDP.
Data Sources:
Bureau of Economic Analysis (BEA)
Congressional Budget Office (CBO)
U.S. Bureau of Labor Statistics (BLS)
Federal Reserve Economic Data (FRED Charts)
CME Fed Watch
U.S. Treasury – Yields
U.S. Census Bureau
Institute for Supply Management (ISM)
Weekly DOL Employment Data
BLS Monthly Jobs Report
JOLTS
US Energy Admin (EIA)
BLS Consumer Price Index CPI
BLS Producer Price Index PPI
Atlanta Fed GDPNOW
NY Fed Nowcast GDP
US Census Bureau Housing Starts
Consumer Credit
USCB Retail Sales
Construction Spending
Federal Reserve Dot Plots
NY Empire Index
Philadelphia Federal Reserve
P/E Ratio Data -Yardeni Research
Technical Analysis Info:
StockCharts.com – Financial Charts
Exponential vs Simple moving average
Other Links:
1973 Arab Oil Embargo
Hunt Brothers Silver
Long-Term Capital bailout
Categories:
Tags: